RIPEX - NPS Department of Oceanography - Naval Postgraduate ...
RIPEX - NPS Department of Oceanography - Naval Postgraduate ...
RIPEX - NPS Department of Oceanography - Naval Postgraduate ...

Create successful ePaper yourself
Turn your PDF publications into a flip-book with our unique Google optimized e-Paper software.
Marine Geology 218 (2005) 113–134<br />
www.elsevier.com/locate/margeo<br />
<strong>RIPEX</strong>: Observations <strong>of</strong> a rip current system<br />
Jamie H. MacMahan a, T, Ed B. Thornton a , Tim P. Stanton a , Ad J.H.M. Reniers b<br />
a <strong>Naval</strong> <strong>Postgraduate</strong> School, <strong>Oceanography</strong> <strong>Department</strong>, Monterey, CA 93943, USA<br />
b Civil Engineering and Geosciences, Delft University <strong>of</strong> Technology, Delft, The Netherlands<br />
Received 10 June 2004; received in revised form 23 February 2005; accepted 14 March 2005<br />
Abstract<br />
Rip current kinematics and beach morphodynamics were measured for 44 days at Sand City, Monterey Bay, CA using 15<br />
instruments composed <strong>of</strong> co-located velocity and pressure sensors, acoustic Doppler current pr<strong>of</strong>ilers, and kinematic GPS<br />
surveys. The morphology consisted <strong>of</strong> a low-tide terrace with incised quasi-periodic rip channels, representative <strong>of</strong> transverse<br />
bars. Offshore (17 m depth) significant wave height and peak period ranged 0.20–3.0 m and 5–20 s. The mean wave direction<br />
was consistently near 08 resulting in rip channel morphology, which evolved in response to the changing wave characteristics.<br />
An inverse relationship between sediment accreting on the transverse bar and eroding in the rip channel was found. The spatial<br />
distribution <strong>of</strong> sediment is reflected in the background rip current flow field. The mean velocity magnitudes within the rip<br />
channel (transverse bars) increased <strong>of</strong>fshore (onshore) with decreasing tidal elevations and increased with increasing sea-swell<br />
energy. Eulerian averaged flows were predominantly shoreward on the transverse bars and seaward within the rip channel<br />
throughout the experiment, resulting in a persistent cellular circulation, except during low wave energy. The rip current spacing<br />
to the rip channel width was less than or equal to two, which suggests that the rip currents are influenced by each other and that<br />
no two-dimensional bar return flow should be present. The vertical velocity pr<strong>of</strong>ile on the bar indicated that the flow was<br />
predominantly shoreward. The flow field within the surf zone was depth uniform, except for significant shear occurring near the<br />
surface, owing to Stokes drift. The wave-induced transport hypothesis is evaluated.<br />
D 2005 Elsevier B.V. All rights reserved.<br />
Keywords: rip currents; morphodynamics; nearshore; surf zone; transverse bar; circulation<br />
1. Introduction<br />
T Corresponding author.<br />
E-mail addresses: jhmacmah@nps.edu (J.H. MacMahan),<br />
thornton@nps.edu (E.B. Thornton), stanton@nps.edu (T.P. Stanton),<br />
ad@dutcvmm.ct.tudelft.nl (A.J.H.M. Reniers).<br />
Rip currents are generally strong shore-normal (jetlike)<br />
flows that originate within the surf zone and are<br />
directed seaward through the breakers. Rip currents<br />
typically reach speeds up to 1 m/s and some have been<br />
reported as high as 2 m/s at Palm Beach, Australia<br />
(Short, 1985). Rip currents influence the morphology<br />
0025-3227/$ - see front matter D 2005 Elsevier B.V. All rights reserved.<br />
doi:10.1016/j.margeo.2005.03.019
114<br />
J.H. MacMahan et al. / Marine Geology 218 (2005) 113–134<br />
<strong>of</strong> the shoreline and may be important for transporting<br />
fine sediments <strong>of</strong>fshore (Cooke, 1970; Komar, 1971;<br />
Short, 1999). Rip currents have accounted for more<br />
than 80% <strong>of</strong> lifeguard rescues, and are the number one<br />
natural hazard in Florida, USA (Luschine, 1991;<br />
Lascody, 1998). The understanding <strong>of</strong> rip current<br />
systems is important in developing accurate forecasts<br />
for predicting bhigh riskQ rip current events that are a<br />
public safety hazard (Luschine, 1991; Short and<br />
Hogan, 1994; Lascody, 1998; Engle et al., 2002).<br />
Rip currents can develop from the alongshore<br />
variations in bathymetry that induce differences in<br />
wave breaking patterns and forcing, which drive a flow<br />
from the transverse bar towards the rip channels<br />
(Bowen, 1969; Dalrymple, 1978). In the laboratory,<br />
Haller et al. (2002) verified the dynamical forcing.<br />
Waves dissipated over the bar, while the waves were<br />
larger in the rip channel owing to wave-current<br />
interaction, and dissipated closer to shore. This resulted<br />
in an increased wave set-up occurring over the bar<br />
compared to the still water level within the rip channel,<br />
which drove currents alongshore that converged within<br />
the region <strong>of</strong> lower set-up (the rip channel) and formed<br />
a rip current.<br />
There have been few field measurements <strong>of</strong><br />
morphologic evolution and concurrent rip current<br />
hydrodynamics, owing to the difficulty in measuring<br />
bathymetry within the surf zone and deploying<br />
instruments in the rip channels, in part because <strong>of</strong><br />
the tendency for the rip channels to migrate alongshore.<br />
Previous field observations found that the mean<br />
rip current velocities increased with decreasing tidal<br />
elevation (Shepard and Inman, 1950; Sonu, 1972;<br />
Bowman et al., 1988a,b; Aagaard et al., 1997;<br />
Brander, 1999; Brander and Short, 2000, 2001).<br />
These experiments were short in duration (few days)<br />
and focused only on measurements within the rip<br />
channels, with minimal information available on the<br />
neighboring transverse bars. In addition, high-resolution<br />
bathymetry and local <strong>of</strong>fshore directional wave<br />
measurements were <strong>of</strong>ten not available. Laboratory<br />
studies confirmed field observations and found that<br />
rip current velocities increase with increasing wave<br />
heights and decreasing water elevation (Dronen et al.,<br />
2002; Haller et al., 2002).<br />
The aim <strong>of</strong> this paper is to describe the morphodynamics<br />
and flow kinematics <strong>of</strong> a rip current system in<br />
the field for a beach with rip channels, which slowly<br />
evolves over the course <strong>of</strong> a 44-day experiment. This<br />
paper attempts to describe a complete rip current<br />
system in more detail than previously available. The<br />
rip currents on this beach are topographically controlled<br />
by a low-tide terrace with quasi-periodic<br />
incised rip channels, which are representative <strong>of</strong> a<br />
transverse bar beach described by the Wright and<br />
Short (1984) morphodynamic model.<br />
2. <strong>RIPEX</strong> experiment<br />
2.1. Instrumentation<br />
RIP current field EXperiment (<strong>RIPEX</strong>) was<br />
performed in conjunction with a steep beach experiment<br />
during the months <strong>of</strong> April and May 2001 at the<br />
southern end <strong>of</strong> Monterey Bay in Sand City, CA. The<br />
foreshore <strong>of</strong> the beach was relatively steep (1:10)<br />
with beach cusps O (35 m), flattening out to a lowtide<br />
terrace (1:100) with quasi-periodic, O (125 m),<br />
incised rip channels, continuing with a 1:20 <strong>of</strong>fshore<br />
slope, representative <strong>of</strong> a transverse barred beach by<br />
the Wright and Short (1984) morphodynamic model<br />
(Fig. 1). Feeder channels were present near the<br />
shoreline connecting to the incised rip channels.<br />
The rip channels began at the low-tide line and<br />
increased in width in a quasi-exponential fashion<br />
seawards to a depth <strong>of</strong> 4 m.<br />
Spatial and temporal scales <strong>of</strong> rip current behavior<br />
and morphological evolution were measured using a<br />
combination <strong>of</strong> in situ co-located pressure and bidirectional<br />
electromagnetic (em) current sensors<br />
(PUV), time-lapsed video observations, and rapid<br />
deployment bathymetric surveys. The flow dynamics<br />
over the alongshore variable bathymetry were measured<br />
using an alongshore array <strong>of</strong> 6 PUVs. Additional<br />
instruments were deployed over the transverse bar and<br />
rip channels. Velocity pr<strong>of</strong>ile measurements within the<br />
rip channel were obtained using a portable acoustic<br />
Doppler current pr<strong>of</strong>iler (ADCP), which has a 5 cm<br />
blanking distance and 20 cm bins (first bin is at 25 cm).<br />
Velocity pr<strong>of</strong>iles over the transverse bar were measured<br />
using a vertical array (MAST) <strong>of</strong> 8 em current meters,<br />
starting at 10 cm <strong>of</strong>f the bed with ~40 cm spacing that<br />
spans 2.56 m. After yearday 117, the em current meters<br />
within the rip channels were oriented downward in<br />
order to obtain measurements during lower tidal
J.H. MacMahan et al. / Marine Geology 218 (2005) 113–134 115<br />
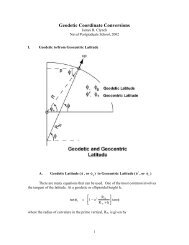
Fig. 1. Local bathymetry for yearday 117. The squares represent locations <strong>of</strong> co-located pressure and bi-directional em current meters. The MAST<br />
is a vertical array <strong>of</strong> 8 em current meters with wave sensor. The solid line is the MSL contour and the dashed line is the mean low water contour.<br />
elevations. Current meters on the transverse bar were<br />
oriented upward and were not always submerged at low<br />
tides. The current meters were horizontally aligned<br />
with the shoreline, which did not vary over the course<br />
<strong>of</strong> the experiment owing to the waves approaching near<br />
shore-normal throughout the experiment (discussed in<br />
the next section). Cosine responses <strong>of</strong> the two-axis em<br />
current sensors have been established by repeated<br />
constant velocity calibration runs in a 6m long<br />
computer-controlled tow-tank. The sensor was rotated<br />
in 10 degree increments at both 0.1 and 1 m/s tow<br />
speeds. Results fit a true cosine speed response within<br />
4%, which is very good for an invasive sensor. Currents<br />
are described as either cross (U)- or alongshore (V).<br />
The right-hand rule orientation was adapted, such that<br />
flows were positive seaward, to the south, and upward.<br />
All instruments were sampled synchronously and<br />
continuously at 8 Hz, except the portable ADCP, which<br />
sampled at 1 Hz.<br />
Bathymetric surveys were performed using a<br />
differential, kinematic, global positioning system<br />
(KGPS) mounted on a sonar equipped personal<br />
watercraft, PWC (MacMahan, 2001). Plunging breakers<br />
at the outer edge <strong>of</strong> the transverse bar injected<br />
significant amounts <strong>of</strong> air bubbles into the water<br />
column, making the bar area acoustically opaque for<br />
the echosounder. At high tides, the PWC traversed<br />
from <strong>of</strong>fshore (~7 m water depth) to the outer edge <strong>of</strong><br />
the transverse bars and within the rip channels. Wave<br />
breaking was generally less within rip channel systems<br />
allowing for safe PWC operation and bathymetric<br />
surveys. At low tides, the transverse bars and feeder<br />
channels were surveyed by a walking person carrying<br />
the KGPS housed in a water-tight back-pack. The<br />
beachface and foredune were surveyed with the KGPS<br />
mounted on an all-terrain vehicle, ATV. Bathymetry is<br />
referenced to mean sea level (MSL).<br />
2.2. Wave climate<br />
Offshore waves were recorded by a directional<br />
wave rider buoy (DWR) located 650 m <strong>of</strong>fshore in 17<br />
m water depth and by a National Oceanographic and<br />
Atmospheric Association National Data Buoy Center
116<br />
J.H. MacMahan et al. / Marine Geology 218 (2005) 113–134<br />
6<br />
H mo<br />
(m)<br />
4<br />
2<br />
0<br />
95 100 105 110 115 120 125 130 135 140<br />
T peak<br />
(s)<br />
20<br />
15<br />
10<br />
5<br />
0<br />
95 100 105 110 115 120 125 130 135 140<br />
o<br />
θ peak<br />
50<br />
0<br />
-50<br />
-100<br />
-150<br />
95 100 105 110 115 120 125 130 135 140<br />
time(yearday)<br />
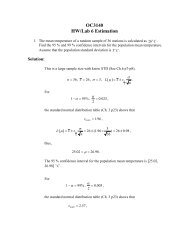
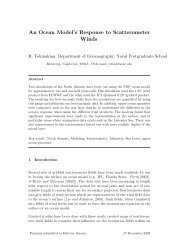
Fig. 2. (Top) significant wave height, (middle) peak wave period, and (bottom) peak wave direction relative to shore-normal measured at<br />
directional wave buoy (DWR—bold line) located 650 m <strong>of</strong>fshore in 17 m water depth and the NDBC buoy #46042 located 40 km <strong>of</strong>fshore <strong>of</strong><br />
Monterey Bay, CA.<br />
Buoy (NDBC) #46042 located 40 km <strong>of</strong>fshore,<br />
outside <strong>of</strong> Monterey Bay, CA. Large variation in<br />
significant wave heights (H mo ), peak wave periods<br />
(T p ), and wave direction (h peak ) at the peak frequency,<br />
occurred throughout the experiment (Fig. 2). The peak<br />
wave period at the two buoys were similar most <strong>of</strong> the<br />
time, which is indicative <strong>of</strong> swell conditions. Large<br />
differences in T peak occurred during times <strong>of</strong> local<br />
wave generation at DWR. The decreases in H mo and<br />
h peak are associated with sheltering by the local<br />
headlands and strong refraction over Monterey<br />
Canyon, which filters out most wave directions.<br />
H mo and T p at DWR ranged from 0.20–3.0 m to 5–<br />
20 s. The nearshore mean wave incidence angle<br />
shows little variation with a mean direction and<br />
standard deviation <strong>of</strong> 08 and 38 to shore-normal.<br />
Except for times <strong>of</strong> local wave generation (sea breeze<br />
events), the waves approach shore-normal, even<br />
though the variation in wave directions outside the<br />
bay (NDBC) are significantly larger. Due to the nearnormal<br />
incidence <strong>of</strong> waves most <strong>of</strong> the time, longshore<br />
currents were weak or non-existent, except for<br />
those associated with the rip current cellular circulations<br />
(Section 4).<br />
3. Morphodynamics<br />
Beach cusps (O (35 m)), mega-cusps (O (125 m))<br />
and rip channels (O (125 m)) characterized the<br />
morphology <strong>of</strong> this beach system, but the governing<br />
processes controlling these features differ. Beach<br />
cusps occurred at smaller spatial scales, related to<br />
swash zone processes, while the rip channels are<br />
related to surf zone processes, which develop megacusps<br />
on the beachface. At smaller-scales (O (1 m)),
J.H. MacMahan et al. / Marine Geology 218 (2005) 113–134 117<br />
mega-ripples within rip channels were observed<br />
throughout the experiment similar to observations <strong>of</strong><br />
rip channel systems by Cooke (1970), Sherman et al.<br />
(1993) and Thornton et al. (1998), but no quantitative<br />
measurements were obtained in the rip channel. On<br />
the transverse bars, a scanning-altimeter recorded<br />
migrating orbital ripples during moderate and low<br />
wave forcing and flat bed, sheet flow conditions<br />
during high wave days (Weltmer, 2003).<br />
3.1. Beachface<br />
Detailed beachface survey data were acquired from<br />
yeardays 114–136 along a 2 km stretch from Sand<br />
City south to Del Monte Beach, CA. Two beachface<br />
features are prominent: (1) beach cusps (O (35 m))<br />
and (2) mega-cusps (O (125 m)) associated with the<br />
rip channel geometry (Fig. 1). The beach cusp spacing<br />
was essentially constant along the entire length <strong>of</strong> the<br />
beach, despite decreasing beach slope and wave<br />
heights to the south (Miller, 2001; Holt, 2003). The<br />
beach cusps remained stable at relatively fixed longshore<br />
wavelengths until a storm event (yearday 122)<br />
occurred, which destroyed the cusp pattern. This<br />
behavior supports previous observations <strong>of</strong> Wright et<br />
al. (1982) that once the cusp spacing has been cut into<br />
a beach, it remains until a wave event occurs that<br />
establishes a different cusp spacing (Miller, 2001).<br />
Unfortunately, only one storm event (yearday 122)<br />
occurred during the observational period (yeardays<br />
114–136) that was large enough to modify the beach<br />
cusp spacing.<br />
Mega-cusps had the same length scale as the rip<br />
current spacing, with the rip current located at the<br />
Y(m)<br />
Y(m)<br />
Y(m)<br />
200<br />
0<br />
-200 -4<br />
200<br />
0<br />
-200<br />
200<br />
0<br />
-200<br />
Yearday 94<br />
> N<br />
0 100 200<br />
Yearday 109<br />
> N<br />
0 100 200<br />
Yearday 128<br />
> N<br />
0 100 200<br />
X(m)<br />
4<br />
2<br />
0<br />
-2<br />
-6<br />
4<br />
2<br />
0<br />
-2<br />
-4<br />
-6<br />
4<br />
2<br />
-200<br />
-200<br />
0<br />
0<br />
0<br />
-2<br />
-2<br />
-4 -200<br />
-6<br />
200<br />
0<br />
200<br />
0<br />
200<br />
Yearday 103<br />
> N<br />
0 100 200<br />
Yearday 115<br />
> N<br />
0 100 200<br />
Yearday 133<br />
> N<br />
0 100 200<br />
X(m)<br />
4<br />
2<br />
0<br />
-2<br />
-4 -200<br />
-6<br />
4<br />
2<br />
0<br />
-2<br />
-4<br />
-6<br />
4<br />
2<br />
-200<br />
> N<br />
> N<br />
> N<br />
-2<br />
-4<br />
-6<br />
-2<br />
-4<br />
-6<br />
-4 -200<br />
-2<br />
-6<br />
200<br />
0<br />
200<br />
0<br />
200<br />
0<br />
Yearday 106<br />
0 100 200<br />
Yearday 117<br />
0 100 200<br />
Yearday 136<br />
0 100 200<br />
X(m)<br />
4<br />
2<br />
0<br />
4<br />
2<br />
0<br />
4<br />
2<br />
0<br />
-4<br />
-6<br />
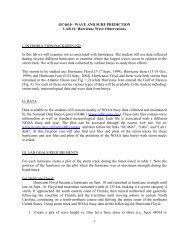
Fig. 3. Bathymetric surveys for the <strong>RIPEX</strong> experiment elevation (z(m)) color scale on the right.
118<br />
J.H. MacMahan et al. / Marine Geology 218 (2005) 113–134<br />
center <strong>of</strong> the rip (mega-cusp) embayment. The megacusps<br />
were also relatively stationary throughout the<br />
experiment. Mega-cusps appear to be erosional<br />
features <strong>of</strong> rip currents owing to the fast-seaward<br />
directed flow creating an erosional embayment (Short<br />
and Hesp, 1982). As only limited measurements were<br />
available, the erosional and accretional patterns are<br />
not discussed (see Komar, 1998; Short, 1999 for more<br />
information).<br />
3.2. Bathymetry<br />
Bathymetric variations occurred as a result <strong>of</strong><br />
accretion and deposition throughout the experiment.<br />
The rip channel and transverse bar geometry persisted,<br />
although features slowly migrated and varied in<br />
dimensions (Fig. 3). The nearshore morphology<br />
evolved continuously in response to 10 wave height<br />
events (H mo N1 m). The largest storms occurred on<br />
yearday 98 and 100 (H mo N2.5 m) and yearday 122<br />
(H mo N2.9 m), causing significant bathymetric variations<br />
(Fig. 3). The storms on yeardays 98 and 100<br />
resulted in the rip channel at y =100 m migrating<br />
downcoast approximately 50 m (unfortunately, no<br />
nearshore hydrodynamic measurements were obtained<br />
until yearday 103).<br />
At the beginning <strong>of</strong> the experiment, the bathymetry<br />
was well organized and rip channels and<br />
z(m)<br />
z(m)<br />
z(m)<br />
z(m)<br />
z(m)<br />
z(m)<br />
z(m)<br />
z(m)<br />
z(m)<br />
0<br />
-1<br />
-2<br />
-300<br />
0<br />
-1<br />
-2<br />
-300<br />
0<br />
-1<br />
-2<br />
-300<br />
0<br />
-1<br />
-2<br />
-300<br />
0<br />
-1<br />
-2<br />
-300<br />
0<br />
-1<br />
-2<br />
-300<br />
0<br />
-1<br />
-2<br />
-300<br />
0<br />
-1<br />
-2<br />
-300<br />
0<br />
-1<br />
-2<br />
-300<br />
yearday 94<br />
-200 -100<br />
yearday 103<br />
-200 -100<br />
yearday 106<br />
-200 -100<br />
yearday 109<br />
-200 -100<br />
yearday 115<br />
-200 -100<br />
yearday 117<br />
-200 -100<br />
yearday 128<br />
-200 -100<br />
yearday 133<br />
-200 -100<br />
yearday 136<br />
-200 -100<br />
0 100 200 300<br />
0 100 200 300<br />
0 100 200 300<br />
0 100 200 300<br />
0 100 200 300<br />
0 100 200 300<br />
0 100 200 300<br />
0 100 200 300<br />
time(yearday)<br />
0 100 200 300<br />
alongshore(m)<br />
Fig. 4. Alongshore pr<strong>of</strong>iles at cross-distance 100 m for the various days <strong>of</strong> bathymetric surveys. Alongshore array at cross-shore distance 88 m<br />
are represented by dots.
J.H. MacMahan et al. / Marine Geology 218 (2005) 113–134 119<br />
transverse bars were clearly defined. After the<br />
storms <strong>of</strong> yeardays 98 and 100, the rip channels<br />
shifted orientation and the transverse bars began<br />
accreting until the storm <strong>of</strong> yearday 122 (Fig. 3).<br />
The storm <strong>of</strong> yearday 122 caused significant<br />
amounts <strong>of</strong> transverse bar erosion and rip channel<br />
accretion with additional random deposition and<br />
erosion (Fig. 3), except for the channels near the<br />
arrays scoured deeper. This storm decreased the<br />
bathymetric relief, reducing the alongshore depth<br />
variability associated with the rip channels and<br />
transverse bars. The rip channels were still present,<br />
but their amplitudes decreased (in the alongshore),<br />
as compared with the deeper channels at the onset<br />
<strong>of</strong> the experiment (Fig. 4). The transverse bar on<br />
which the cross-shore instrument array was located<br />
remained relatively stable throughout the experiment.<br />
However, the morphology associated with rip<br />
channels located north <strong>of</strong> the instrument array<br />
experienced significant bathymetric variations and<br />
at times no rip channels were present. Note there is<br />
a riprap wall at the shoreline around y = 350 m<br />
(not shown), which caused significant wave reflections<br />
at high tide, potentially influencing the rip<br />
current cells in this vicinity. The region <strong>of</strong> the<br />
riprap wall was not surveyed.<br />
3.3. Inferred morphology from video images<br />
Two video cameras overlooking the experiment<br />
site were mounted on a 10 m tower with its base<br />
8.2 m above the mean water line. Images from the<br />
cameras began on yearday 118. Snap shots and 5<br />
min time-average images were obtained every 20<br />
min to document the morphodynamics between<br />
bathymetric surveys. Rectified time-averaged images<br />
depict variations in depth-limited wave breaking<br />
from which morphologic beach patterns can be<br />
inferred (Lippmann and Holman, 1990). The<br />
rectified time-averaged intensity images compare<br />
well with the bathymetric surveys (Fig. 5). Depthlimited<br />
wave breaking occurs on the bar outlining<br />
shallow regions, while the deeper sections <strong>of</strong> the<br />
rip channel have minimal wave breaking. An<br />
alongshore pixel intensity line was selected at the<br />
100 m cross-shore distance and plotted as a<br />
function <strong>of</strong> time (Fig. 6), referred to as a timestack.<br />
The timestack indicates that the rip channels were<br />
Y (m)<br />
250<br />
200<br />
150<br />
100<br />
50<br />
0<br />
-50<br />
1<br />
~30 m in width and the transverse bars were ~70 m<br />
in alongshore width before the storm <strong>of</strong> yearday<br />
122. After the storm event <strong>of</strong> yearday 122, the rip<br />
channels became slightly wider ~40 m and the<br />
transverse bars became narrower ~60 m. However,<br />
the smaller storm event <strong>of</strong> yearday 130 had the<br />
most influence in modifying the underlying morphology,<br />
as the rip channels became wider ~60–70<br />
m and the transverse bars became narrower ~30–40<br />
m (in alongshore width). The video images<br />
correspond well with the alongshore pr<strong>of</strong>ile evolution<br />
(Fig. 4), and are a good proxy for the<br />
subaqueous morphology for H mo V2.0 m, except<br />
for small wave conditions H mo V0.5 m. For larger<br />
waves, such as occurring on yearday 122, wave<br />
breaking occurs within the rip channel, obscuring<br />
the rip channels (Fig. 6).<br />
3.4. Erosional–accrectional trends<br />
1<br />
0<br />
0<br />
-1<br />
-1<br />
-1.5<br />
-1<br />
The volume <strong>of</strong> sediment on the transverse bars<br />
and within the rip channels are compared. The<br />
volume <strong>of</strong> sediment for the transverse bars was<br />
calculated between depths 1.2 m (<strong>of</strong>fshore minimum<br />
tidal elevation) and MWL, which is generally<br />
higher than the transverse bars. The volume <strong>of</strong><br />
-2<br />
-2<br />
-1.5<br />
-1.5<br />
-1.5<br />
-1.5<br />
-2<br />
-2<br />
-2<br />
-2<br />
-3<br />
-3<br />
-3<br />
-4<br />
-100<br />
50 100 150 200 250<br />
X (m)<br />
Fig. 5. Rectified time-averaged video exposure with bathymetric<br />
contours overlayed on top for yearday 128.
120<br />
J.H. MacMahan et al. / Marine Geology 218 (2005) 113–134<br />
Fig. 6. Alongshore pixel timestack at the 100 m cross-shore location. Light areas indicate waves breaking on the transverse bar and dark areas<br />
indicate deeper rip channels.<br />
sediment within the rip channels was computed<br />
between 2.4 m to 1.2 m, which encompasses<br />
the region just outside <strong>of</strong> the active surf zone. The<br />
first survey was conducted on yearday 94. After<br />
yearday 94, four relatively short storms induced a<br />
significant amount <strong>of</strong> erosion for both the transverse<br />
bars and rip channels (Fig. 7). Following the survey<br />
<strong>of</strong> yearday 106, the system began accreting around<br />
yearday 109. After yearday 109, an inverse relationship<br />
developed between erosion and accretion for the<br />
transverse bars and the rip channels. While sediments<br />
accrete on the transverse bars, they erode<br />
within the rip channels (and vice-a-versa) (Fig. 7),<br />
which is similar to observations by Brander (1999).<br />
A large storm occurred on yearday 122 (H mo N2.6<br />
m) eroding the beachface and redistributing the<br />
sediment within the sub-aqueous pr<strong>of</strong>ile ( 4 m<br />
MSL), smoothing out the alongshore variability<br />
(Figs. 3, 4 and 7).<br />
4. Rip current flow kinematics<br />
4.1. Cellular circulation<br />
In general, the flow was directed shoreward on<br />
the transverse bars and seaward within the rip<br />
current channels. The measurements are consistent<br />
with a cellular circulation (Fig. 8) and more detailed<br />
laboratory experiments (Haller et al., 2002; Haas<br />
and Svendsen, 2002). The flow within the rip<br />
channel increases at low tides. Histograms <strong>of</strong> 90<br />
min mean cross-shore and alongshore velocities<br />
were computed for the entire experiment (Figs. 9
J.H. MacMahan et al. / Marine Geology 218 (2005) 113–134 121<br />
2000<br />
Sediment Volume(m 3 )<br />
1000<br />
0<br />
-1000<br />
-2000<br />
94 96 98 100 102 104 106 108 110 112 114 116 118 120 122 124 126 128 130 132<br />
time(yearday)<br />
3.5<br />
3<br />
2.5<br />
H mo<br />
(m)<br />
2<br />
1.5<br />
1<br />
0.5<br />
0<br />
94 96 98 100 102 104 106 108 110 112 114 116 118 120 122 124 126 128 130 132<br />
time(yearday)<br />
Fig. 7. (top panel) Calculated volumes for the transverse bars (solid) and the rip current channels (dashed-line). (bottom panel) H mo measured at<br />
the 17 m buoy during the periods <strong>of</strong> bathymetric surveys shown as reference.<br />
and 10). The probability <strong>of</strong> the flow directed<br />
seaward (shoreward) for measurements within the<br />
rip channel (on the transverse bar) were calculated.<br />
The cross-shore flow was predominantly shoreward<br />
( P g 0.9) for instruments (PUV1, PUV2, PUV5)<br />
located on the transverse bar and seaward ( P g0.9)<br />
for instruments (PUV6, PUV9, PUV10, PUV11)<br />
located within the rip channels throughout the<br />
experiment (Fig. 9). The small occurrence (~10%)<br />
<strong>of</strong> opposite flows is associated with periods <strong>of</strong> small<br />
currents. PUV11 measured shoreward flows early in<br />
the experiment, as it was on the edge <strong>of</strong> the<br />
transverse bar.<br />
The direction <strong>of</strong> alongshore velocities, shown in<br />
Fig. 10, was relatively equally distributed for some<br />
instruments (PUV5, PUV6, PUV10) and directionally<br />
biased for other instruments, related to their<br />
location within the rip current cellular circulation<br />
(Fig. 1). The morphologic evolution induces much<br />
<strong>of</strong> the directional variability in the alongshore<br />
currents (Figs. 4 and 10).<br />
PUV1 and PUV2, located on opposing transverse<br />
bars, show net onshore flows, though the magnitude<br />
was reduced relative to that <strong>of</strong> PUV5 (Fig. 10), located<br />
at the end <strong>of</strong> the transverse bar. The alongshore<br />
velocities at these two sensor locations preferentially<br />
flowed toward the rip channel located at y =0 m (RIP<br />
A—see Fig. 1), and were on the same order <strong>of</strong><br />
magnitude as the cross-shore velocities (Fig. 9).<br />
PUV10, located within RIP A closest to the shore<br />
near the feeder channel <strong>of</strong> SHOAL A, measured<br />
velocities that were downcoast and <strong>of</strong>fshore toward<br />
RIP A. Two PUV sensors (PUV6, 11), located across<br />
the rip channel (RIP A), measured significant <strong>of</strong>fshore<br />
and alongshore velocities. PUV9, located in RIP B,<br />
had significant <strong>of</strong>fshore flows similar in magnitude to<br />
PUV6 and PUV11, located in RIP A. PUV9, located<br />
within the RIP B close to SHOAL C, also had
122<br />
J.H. MacMahan et al. / Marine Geology 218 (2005) 113–134<br />
Fig. 8. Hourly mean velocity vectors for yearday 122 (top panels) and 120 (bottom panels) at high (right panels) and low tide (left panels). An<br />
instrument location without a velocity vector indicates that the em was not submerged.<br />
alongshore flows directed toward the center <strong>of</strong> RIP B.<br />
Throughout the experiment RIP A slowly migrated<br />
downcoast, which is reflected in rip current velocities<br />
at PUV6 that initially flowed upcoast turned and<br />
flowed downcoast.<br />
During the apex <strong>of</strong> the storm on yearday 122,<br />
PUV9 located within the southern rip channel<br />
registered maximum <strong>of</strong>fshore flows <strong>of</strong> ~1 m/s,<br />
whereas PUV6 and PUV10 reached a maximum <strong>of</strong><br />
~1 m/s and ~0.5 m/s. The rip channels were visually<br />
apparent owing to the waves breaking on the transverse<br />
bar and not within the rip channel (Fig. 6).<br />
During the storm <strong>of</strong> yearday 122, wave heights<br />
exceeded 3 m producing significant wave breaking<br />
within the rip channel and the identification <strong>of</strong> rip<br />
channels was obscured. However, the measurements<br />
indicated that the <strong>of</strong>fshore flow within the rip<br />
channels was still significant (Fig. 8).<br />
The mean rip current velocities were O (30 cm/s)<br />
during the experiment for a wide range <strong>of</strong> wave<br />
conditions (Fig. 2), with maximum mean rip current<br />
velocities approaching 1 m/s. Rip currents have been<br />
observed to pulsate on wave group temporal scales<br />
(Shepard and Inman, 1950; Sonu, 1972; Brander and<br />
Short, 2001; MacMahan et al., 2004a,b). Infragravity<br />
rip current pulsations increase the instantaneous rip<br />
current maximum flow to over 1 m/s over a period <strong>of</strong><br />
25–250 s. Furthermore, the tide can also vary the flow<br />
velocity significantly over the course <strong>of</strong> a few hours.<br />
However, the overall mean flow field was typically on<br />
the O (30 cm/s).<br />
4.2. Distribution <strong>of</strong> sediment within a rip current<br />
system<br />
Sediment distributions are related to the morphodynamics<br />
and spatial variations in the flow field for a<br />
rip current system (Figs. 8–10). Cumulative size<br />
distributions <strong>of</strong> surface (b8 cm deep) sediment<br />
samples were determined using sieve analysis. D 50
J.H. MacMahan et al. / Marine Geology 218 (2005) 113–134 123<br />
% occurrence<br />
% occurrence<br />
% occurrence<br />
50<br />
40<br />
30<br />
20<br />
10<br />
0<br />
-1<br />
50<br />
40<br />
30<br />
20<br />
10<br />
0<br />
-1<br />
50<br />
40<br />
30<br />
P(U≤0)=0.89<br />
PUV1(bar)<br />
P(U≥0)=0.92<br />
PUV6(rip)<br />
P(U≥0)=0.82<br />
PUV11(rip)<br />
0 1<br />
U(m/s)<br />
0 1<br />
U(m/s)<br />
20<br />
10<br />
0<br />
-1<br />
0 1<br />
U(m/s)<br />
50<br />
50<br />
P(U≤0)=0.84<br />
P(U≤0)=0.88<br />
40<br />
40<br />
PUV5(bar)<br />
PUV2(bar)<br />
30<br />
30<br />
20<br />
20<br />
10<br />
10<br />
0<br />
-1 0 1<br />
0<br />
-1<br />
0 1<br />
U(m/s)<br />
U(m/s)<br />
50<br />
50<br />
P(U≥0)=0.93<br />
P(U≥0)=0.94<br />
40<br />
40<br />
PUV10(rip)<br />
PUV9(rip)<br />
30<br />
30<br />
20<br />
20<br />
10<br />
10<br />
0<br />
-1<br />
0 1<br />
0<br />
-1<br />
0 1<br />
U(m/s)<br />
U(m/s)<br />
Fig. 9. Histograms <strong>of</strong> 90 min mean cross-shore velocities for yeardays 107–140. Positive U is <strong>of</strong>fshore.<br />
was linearly interpolated from the cumulative distribution.<br />
The spatial sediment distribution <strong>of</strong> D 50<br />
(Fig. 11) indicates that the beachface was composed<br />
<strong>of</strong> a course sediment (D 50 : 0.66–0.72 mm), which<br />
was reflected in the steep pr<strong>of</strong>ile. The top <strong>of</strong> the<br />
beachface, located at the toe <strong>of</strong> the foredune, had<br />
finer sediments (D 50 : 0.47–0.54 mm) associated with<br />
wind-driven processes and erosion <strong>of</strong> the foredune.<br />
The sediment sizes were also finer (D 50 : 0.34–0.37<br />
mm) at the base <strong>of</strong> the beachface, where the pr<strong>of</strong>ile<br />
became milder. The sediment sizes were reasonably<br />
uniform across the transverse bar to its outer edge<br />
(D 50 : 0.32–0.43 mm), at which point the pr<strong>of</strong>ile<br />
began to steepen and D 50 increased to 0.47 mm. At<br />
the low tide swash break, there was a narrow region<br />
occupied by larger sediments (D 50 : 0.61 mm) created<br />
by the swash backwash, located at the shoreward<br />
extent <strong>of</strong> the rip channel. Sediments were generally<br />
coarser within the rip channels (D 50 : 0.40–0.48 mm),<br />
decreasing in size closer towards the transverse bars<br />
(D 50 : 0.34–0.38 mm).<br />
The spatial distribution <strong>of</strong> D 50 can be explained<br />
by the cellular circulation associated with rip<br />
current cells, which was a persistent background<br />
flow (Fig. 8). The rip current transports sediments<br />
through the rip channel with coarser sediments<br />
deposited at the rip channel, while finer sediments<br />
are transported <strong>of</strong>fshore. Owing to the cellular<br />
nature <strong>of</strong> the rip currents, the fine sediments are<br />
re-deposited on the seaward side <strong>of</strong> the transverse<br />
bars. Finer sediments are then transported onto the<br />
transverse bar. The spatial distribution <strong>of</strong> surface<br />
sediment sizes reflects the hydrodynamics <strong>of</strong> the rip<br />
morphology, consistent with Bowman et al.<br />
(1988a,b). The cellular circulation is also supported<br />
by the predominant onshore ripple migration
124<br />
J.H. MacMahan et al. / Marine Geology 218 (2005) 113–134<br />
% occurrence<br />
% occurrence<br />
% occurrence<br />
50<br />
40<br />
30<br />
20<br />
10<br />
0<br />
-1<br />
50<br />
40<br />
30<br />
20<br />
10<br />
0<br />
-1<br />
50<br />
40<br />
30<br />
P(V≥0)=0.81<br />
PUV1(bar)<br />
P(V≥0)=0.48<br />
PUV6(rip)<br />
P(V≥0)=0.20<br />
PUV11(rip)<br />
0 1<br />
V(m/s)<br />
0 1<br />
V(m/s)<br />
20<br />
10<br />
0<br />
-1<br />
0 1<br />
V(m/s)<br />
50<br />
P(V≥0)=0.77<br />
40<br />
PUV5(bar)<br />
30<br />
20<br />
10<br />
0<br />
-1<br />
50<br />
40<br />
30<br />
P(V≥0)=0.40<br />
PUV10(rip)<br />
0 1<br />
V(m/s)<br />
20<br />
10<br />
0<br />
-1<br />
0 1<br />
V(m/s)<br />
50<br />
P(V≥0)=0.44<br />
40<br />
PUV2(bar)<br />
30<br />
20<br />
10<br />
0<br />
-1<br />
50<br />
40<br />
30<br />
P(V≥0)=0.88<br />
PUV9(rip)<br />
0 1<br />
V(m/s)<br />
20<br />
10<br />
0<br />
-1<br />
0 1<br />
V(m/s)<br />
Fig. 10. Histograms <strong>of</strong> 90 min mean alongshore velocities for yeardays 107–140. Positive V is north.<br />
observed hourly on the transverse bar near the<br />
location <strong>of</strong> the MAST (Weltmer, 2003).<br />
4.3. Vertical velocity pr<strong>of</strong>iles<br />
It has been assumed throughout that the em current<br />
meters at a single elevation represents the depthaveraged<br />
flow <strong>of</strong> the cellular circulation within the surf<br />
zone. A vertical em current meter array (Fig. 1—<br />
referred to as MAST) and a portable vertical pr<strong>of</strong>iling<br />
ADCP are used to evaluate this assumption. The<br />
portable ACDP was deployed within the rip channel at<br />
various times throughout the experiment. The single<br />
point em current meters were located approximately<br />
25–30 cm <strong>of</strong>f the sea bed, similar to the first bin <strong>of</strong> the<br />
ADCP. The mean minimum depth <strong>of</strong> water for all <strong>of</strong><br />
the ADCP deployments was 1.25 m at low tide. The<br />
first bin <strong>of</strong> the ADCP was approximately 25 cm <strong>of</strong>f <strong>of</strong><br />
the bed. The lowest em current meter for the tower was<br />
approximately 10 cm <strong>of</strong>f <strong>of</strong> the bed, which is<br />
influenced by the bottom boundary layer. Velocity<br />
pr<strong>of</strong>iles were time-averaged (60 min) and depthaveraged,<br />
U ¼ 1<br />
hT<br />
Z T<br />
0<br />
Z h<br />
0<br />
uz; ð tÞdzdt: ð1Þ<br />
The depth-averaged cross (U)- and alongshore (V)<br />
velocity components are compared with the hourly<br />
averaged lowest em current meter and lowest ADCP<br />
bin (Fig. 12). The lowest bin <strong>of</strong> the ADCP is<br />
significantly correlated with the U and V with<br />
minimal bias. The lowest em current meter is also<br />
significantly correlated with V, but is less significantly<br />
correlated with U, owing to the influences <strong>of</strong> the<br />
bottom boundary layer <strong>of</strong> the dominant normally-
J.H. MacMahan et al. / Marine Geology 218 (2005) 113–134 125<br />
Fig. 11. Spatial distribution () <strong>of</strong>D 50 overlayed on top <strong>of</strong> the bathymetric contours (color scale on the right) in the background.<br />
incident waves. The assumption that the single-point<br />
em current meters is a valid representation <strong>of</strong> the<br />
depth-averaged flow appears reasonable.<br />
Vertical velocity pr<strong>of</strong>iles were measured with a<br />
vertical array <strong>of</strong> 8 em current meters on the<br />
transverse bar. The flow on the transverse bar was<br />
shoreward over the water column and tidally<br />
modulated, with maximum shoreward currents<br />
occurring during low tides and during larger wave<br />
energy (Fig. 13). There was no seaward-directed<br />
return flow over the transverse bar, also referred to<br />
as undertow (Svendsen, 1984b) or bed return flow<br />
(Short, 1999), which is commonly observed for<br />
alongshore uniform beach pr<strong>of</strong>iles (Garcez Faria et<br />
al., 2000). The transverse bar flow is dominated by<br />
shoreward and alongshore currents, similar to the<br />
single-point measurements (Figs. 8–10). Zero mean<br />
flow occurred around high tides or during low wave<br />
energy. At high tides, waves generally break on the<br />
steep beachface inducing minimal alongshore variations<br />
in wave breaking. The rip channels drain the<br />
surf zone more efficiently due to a greater hydraulic<br />
radius <strong>of</strong> the rip channels compared with the<br />
transverse bars, where hydraulic radius is defined<br />
as the cross-sectional area divided by wetted<br />
perimeter <strong>of</strong> the channel (or transverse bar).<br />
Svendsen et al. (2000) found from model simulations<br />
that rip current circulation is a localized flow<br />
pattern and that if the rip spacing (k rip )N(4–8)w r<br />
(where w r is the rip channel width) the neighboring<br />
rip currents are not influenced by each other. They<br />
also found that the two-dimensional bar return flow<br />
(undertow) was a function <strong>of</strong> rip channel spacing.<br />
For <strong>RIPEX</strong>, k rip /w r was less than or equal to two,<br />
indicating that the rip currents are influenced by<br />
each other.<br />
The vertical velocity pr<strong>of</strong>ile within the rip<br />
channel was measured with the portable ADCP<br />
deployed on yeardays 101–102 (Fig. 14). Haas and<br />
Svendsen (2002) found in the laboratory that<br />
vertical velocity pr<strong>of</strong>iles were essentially uniform<br />
below the wave trough along the axis <strong>of</strong> a rip<br />
channel within the surf zone. Kennedy and Thomas<br />
(2004) used surface drifters in the same laboratory
126<br />
J.H. MacMahan et al. / Marine Geology 218 (2005) 113–134<br />
U mean (m/s) lowest em current meter<br />
V mean (m/s) lowest em current meter<br />
0.5<br />
0<br />
r 2 =0.77<br />
m=1.21<br />
-0.5<br />
-0.5<br />
0 0.5<br />
Depth Integrated U mean (m/s)<br />
0.5<br />
0<br />
r 2 =0.90<br />
m=0.99<br />
U mean (m/s) lowest bin<br />
V mean (m/s) lowest bin<br />
- 0.5<br />
- 0.5 0 0.5<br />
Depth Integrated U mean (m/s)<br />
- 0.5<br />
-0.5<br />
-0.5 0 0.5 - 0.5 0 0.5<br />
Depth Integrated V mean (m/s)<br />
Depth Integrated V mean (m/s)<br />
0.5<br />
0<br />
0.5<br />
0<br />
r 2 =0.98<br />
m=0.99<br />
r 2 =0.98<br />
m=0.99<br />
Fig. 12. Depth-averaged cross-shore (top) and alongshore (bottom) velocity measurements correlated with the lowest em current meter from<br />
the tower (left) and lowest bin from the aquadopp (right). The dashed line represents unity. m is the slope <strong>of</strong> line determined by the linear<br />
regression.<br />
setting and their measurements suggest significant<br />
onshore flow contribution above the trough within<br />
the rip current owing to Stokes drift and the roller.<br />
This suggests significant shear over the vertical, in<br />
particular near the trough. The ADCP can measure<br />
velocities over the vertical including the cresttrough<br />
region. In an Eulerian measurement, the<br />
averaged-hourly flow decreases towards the surface<br />
as the bins within the trough to crest region are<br />
increasingly out <strong>of</strong> the water. In the absence <strong>of</strong><br />
waves, the velocity pr<strong>of</strong>ile would uniformly extend<br />
to the MSL, z/h =1. In the Eulerian reference<br />
frame, the presence <strong>of</strong> waves induces an onshore<br />
Stokes drift counter to the rip current at the surface,<br />
which results in a significant vertical shear in the<br />
crest-trough region (Fig. 15). The normalized<br />
E<br />
Stokes drift,<br />
qC 2 H rms<br />
g0:1, is similar to the measured<br />
deficit at MSL. Therefore, the surface flow<br />
field is different than the underlying flow field,<br />
supported by drifter observations in the laboratory<br />
(Kennedy and Thomas, 2004) and field (Schmidt et<br />
al., 2003).<br />
4.4. Tidal modulation<br />
Changes in tidal elevation have been shown to<br />
modify the strength <strong>of</strong> rip current flow with the rip<br />
currents increasing to a relative maximum at low<br />
tidal elevations (Sonu, 1972; Aagaard et al., 1997;<br />
Brander, 1999; Brander and Short, 2001). Mean<br />
velocity magnitudes (over 90 min) were computed<br />
for two sensors (PUV9, PUV6) located within two<br />
different rip current channels (Fig. 1). The rip current<br />
velocities have a strong tidal modulation, with
J.H. MacMahan et al. / Marine Geology 218 (2005) 113–134 127<br />
2<br />
1.5<br />
H mo<br />
(m)<br />
1<br />
0.5<br />
0<br />
107 108 109 110 111 112 113 114 115 116 117<br />
z(m)<br />
z(m)<br />
2<br />
1.5<br />
1<br />
0.5<br />
0<br />
-0.5<br />
2<br />
1.5<br />
1<br />
0.5<br />
0<br />
-0.5<br />
107 108 109 110 111 112 113 114 115 116 117<br />
107 108 109 110 111 112 113 114 115 116 117<br />
time(yearday)<br />
-0.1<br />
-0.2<br />
-0.3<br />
-0.4<br />
-0.5<br />
0.5<br />
0<br />
-0.5<br />
U(m/s)<br />
V(m/s)<br />
Fig. 13. (top) H mo provided for comparison (middle) hourly mean cross-shore pr<strong>of</strong>iles (color scale on right) with depth-averaged velocities<br />
plotted beneath (Positive U is <strong>of</strong>fshore), (bottom) hourly alongshore pr<strong>of</strong>iles (color scale on right) with depth integrated velocities plotted<br />
beneath (Positive V is north). The position <strong>of</strong> the tower is at the location <strong>of</strong> the MAST on Fig. 1.<br />
increasing speeds occurring with decreasing tidal<br />
elevation (Fig. 16), consistent with previous p field<br />
observations. Velocity magnitudes U r ¼ ffiffiffiffiffiffiffiffiffiffiffiffiffiffi <br />
u 2 þ v 2<br />
were computed as the sensors were relatively close<br />
to the feeder channels and the flow direction was<br />
not necessarily oriented <strong>of</strong>fshore. The slight<br />
decrease in mean flow maxima at low tide are a<br />
result <strong>of</strong> the em currents being influenced by Stokes<br />
drift.<br />
4.5. Dimensionless relationship<br />
Rip current velocities increase with increase in<br />
wave heights, which can occur during high tide<br />
<strong>of</strong>fsetting the effects <strong>of</strong> tidal modulation (Fig. 14).<br />
Thus, tidal elevation and wave forcing both are<br />
important factors that determine the flow speed within<br />
a rip channel. The rip current velocities increase with<br />
increasing sea-swell energy similar to observations by<br />
Shepard and Inman (1950).<br />
Haller et al. (2002) and Dronen et al. (2002) in<br />
laboratory settings, computed the dimensionless rip<br />
current velocity (Froude Number) and found a<br />
relationship between dimensionless rip current velocity<br />
and normalized wave height,<br />
U r<br />
pffiffiffiffiffi<br />
gh<br />
f H o<br />
h ;<br />
ð2Þ<br />
where U r is the mean return flow, H o is the deep<br />
water, significant wave height, and h is the local
128<br />
J.H. MacMahan et al. / Marine Geology 218 (2005) 113–134<br />
z(m) above sensor head<br />
3<br />
2<br />
1<br />
0<br />
101.5 101.6 101.7 101.8 101.9 102 102.1 102.2 102.3 102.4<br />
- 0.1<br />
- 0.2<br />
- 0.3<br />
- 0.4<br />
- 0.5<br />
U(m/s)<br />
z(m) above sensor head<br />
3<br />
2<br />
1<br />
0<br />
101.5 101.6 101.7 101.8 101.9 102 102.1 102.2 102.3 102.4<br />
0.5<br />
0<br />
- 0.5<br />
V(m/s)<br />
1.5<br />
H mo<br />
(m)<br />
1<br />
0.5<br />
0<br />
101.5 101.6 101.7 101.8 101.9 102 102.1 102.2 102.3 102.4<br />
yearday<br />
Fig. 14. Vertical distributions <strong>of</strong> cross-shore (top) and alongshore (middle) velocities within the rip current (color scale on right). Mean water<br />
level is indicated by the heavy line. (bottom) Significant wave height (H mo ) measured at the ADCP.<br />
water depth over the transverse bar crest. Evaluating<br />
pffiffiffiffiffiffiffiffiffiffiffiffiffiffi<br />
these parameters for 90 min mean speeds<br />
u 2 þ v 2 for sensors (PUV4, 6, 9, 10) within the<br />
rip channel, an approximate linear relationship is<br />
found for H o /h bar b1, which is significantly correlated<br />
at the 95% confidence level (Fig. 17). For H o /h bar N1,<br />
the dimensionless return flow approaches a relative<br />
(qualitative) maximum. For (H o /h bar )N1, the waves<br />
on the transverse bar become saturated (wave height<br />
is depth-limited due to wave breaking, H/h g 0.6),<br />
which infers that pressure gradients and wave mass<br />
transport should not change. The relationship performs<br />
better for sensors located within the center <strong>of</strong><br />
rip channel and farther <strong>of</strong>fshore, which were influenced<br />
less by the feeder channels.<br />
PUV10 was originally located within the rip<br />
channel, but as the rip channels slowly migrated<br />
downcoast, it became part <strong>of</strong> the transverse bar/feeder<br />
current system. PUV10 has the lowest apparent upper<br />
limit, due its proximity to the shoreline. This<br />
indicates that the velocity here achieves a maximum<br />
before sensors located deeper within the rip channels.<br />
PUV6 and PUV9 were located in nearly the same<br />
depth, though in different rip channels, and have a<br />
similar upper limit. PUV11 has a lower upper<br />
dimensionless return flow limit, as it was located<br />
slightly farther inshore than PUV6 and was less<br />
centered within the rip channel. The results for<br />
Dronen et al. (2002), indicate that their data began<br />
to approach an upper limit with a dimensionless<br />
return flow velocity <strong>of</strong> 0.6 in the proximity <strong>of</strong> H o /<br />
h bar = 1. The dataset <strong>of</strong> Haller et al. (2002) does not<br />
appear to reach an upper limit, even though measurements<br />
occur at H o /h bar are approximately 3, which<br />
may be associated with the alongshore sloping basin<br />
(Haas et al., 2003).
J.H. MacMahan et al. / Marine Geology 218 (2005) 113–134 129<br />
1.5<br />
1.5<br />
z/h – thin line, H rms /h – thick line<br />
1<br />
0.5<br />
z/h – thin line, H rms /h – thick line<br />
1<br />
0.5<br />
0<br />
0<br />
-0.15 -0.1 -0.05 0 0.05 -0.2<br />
U/√(gh)<br />
0.1 0 0.1 0.2<br />
V/√(gh)<br />
Fig. 15. Vertical distributions <strong>of</strong> cross-shore (left) and alongshore (right) velocities within the rip current. The mean water level is located at<br />
z/h =1. H rms is indicated by the bold vertical line, representing the range <strong>of</strong> values, and indicates that most <strong>of</strong> the shear is in the crest-trough<br />
region.<br />
The asymptotic limit will vary for different geometrical<br />
configurations, wave climate, and tidal<br />
elevation. Currently, there are not enough measurements<br />
<strong>of</strong> rip current flows under extreme conditions to<br />
accurately predict the asymptotic limit for a rip current<br />
system at various depths.<br />
4.6. Wave-induced transport on a rip channel beach<br />
Munk (1949) originally suggested that rip currents<br />
were formed by onshore wave mass transport and that<br />
this water piled up against the beach, which provided a<br />
hydraulic head for an <strong>of</strong>fshore return flow (rip current).<br />
Aagaard et al. (1997) and Brander and Short (2001)<br />
used this simple kinematic (conceptual) model to<br />
explain observed velocities in the rip channel based<br />
on the continuity equation, in which the discharge out<br />
( Q out ) <strong>of</strong> the rip channel is equal to incoming waveinduced<br />
transport over the transverse bar ( Q in ),<br />
computed by<br />
Q out ¼ Q in ¼ ðQ Stokes þ Q roller Þk rip ; ð3Þ<br />
where<br />
Q Stokes ¼ gH2<br />
8C ;<br />
ð4Þ<br />
Q roller ¼ 0:9H 2<br />
; ð5Þ<br />
T<br />
where Q Stokes is the second order Stokes drift, Q roller is<br />
the transport due to the broken wave bore (Svendsen,<br />
1984a,b), g is the gravitational acceleration, C is the<br />
wave phase speed, and k rip is rip channel spacing, and<br />
Q out ¼ U r A r ;<br />
ð6Þ<br />
where U r is the rip current velocity and A r is the crosssectional<br />
area, which was tidally modified. Aagaard et<br />
al. (1997) and Brander and Short (2001) found good<br />
agreement. However, for the measurements presented<br />
here based on the alongshore array, Q out is biased high<br />
relative to Q in (Eq. (3)) (Fig. 18). PUV6, 9, 10 were<br />
located relatively in the center <strong>of</strong> the channel (Fig. 1),
130<br />
J.H. MacMahan et al. / Marine Geology 218 (2005) 113–134<br />
0.7<br />
0.6<br />
0.5<br />
U r<br />
(m/s)<br />
0.4<br />
0.3<br />
0.2<br />
0.1<br />
0<br />
127 127.5 128 128.5 129 129.5 130<br />
time(yearday)<br />
1.5<br />
tidal elevation(m)<br />
1<br />
0.5<br />
0<br />
- 0.5<br />
-1<br />
127 127.5 128 128.5 129 129.5 130<br />
time(yearday)<br />
Fig. 16. (top) Tidal modulation <strong>of</strong> rip currents speeds (90 min averages) recorded within two different rip current channels for several days<br />
where the wave conditions were relatively constant; dashed line represents velocity magnitudes at PUV9, solid line at PUV6 within the rip<br />
channel. (bottom) Concurrent tidal elevation measured at PUV6 relative to MSL.<br />
and since there was not a dense array across the<br />
channel, it is assumed that the velocity measurements<br />
are representative <strong>of</strong> the mean flow.<br />
An inherent problem with applying the continuity<br />
equation equation expressed by Eq. (3) is that as the<br />
spacing <strong>of</strong> the rip channels become large, the rip<br />
current velocity can approach infinity (Kennedy and<br />
Thomas, 2004). Svendsen et al. (2000) determined<br />
that the mass transport returns as a two-dimensional<br />
bar return flow for increasing bar length and found<br />
that the total volume flux is independent <strong>of</strong> the bar<br />
length.<br />
The configuration <strong>of</strong> <strong>RIPEX</strong> system has rip current<br />
circulation cells (Fig. 8) that are close together<br />
(k rip =125 m). In this case, the continuity Eq. (3)<br />
does not explain the seaward-directed flow within the<br />
rip channel, resulting in predictions that are biased<br />
high.<br />
The continuity equation describes the kinematics,<br />
but not the dynamics. Additional flow contributions<br />
need to be included that are associated with<br />
nearshore radiation stress gradients due to differential<br />
breaking wave patterns, which have been<br />
neglected. In an Eulerian frame <strong>of</strong> reference, the<br />
shoreward Stokes mass transport occurs between<br />
the trough and crest region, and an additional flow<br />
contribution was measured below the trough (Eq.<br />
(1)) (Fig. 9). Therefore, Q in is modified to include<br />
Q Eulerian ,<br />
Q in ¼ ðQ Eulerian þ Q Stokes þ Q roller Þk rip ; ð7Þ<br />
and<br />
Q out ¼ U r A r Q Stokes ; ð8Þ
J.H. MacMahan et al. / Marine Geology 218 (2005) 113–134 131<br />
0.45<br />
0.4<br />
0.35<br />
r 2 (TOTAL)=0.37<br />
r 2 (PUV6)=0.55<br />
r 2 (PUV9)=0.42<br />
r 2 (PUV10)=0.34<br />
r 2 (PUV11)=0.15<br />
0.3<br />
U r<br />
/ √(gh)<br />
0.25<br />
0.2<br />
0.15<br />
0.1<br />
0.05<br />
PUV6<br />
PUV9<br />
PUV10<br />
PUV11<br />
0<br />
0 0.5 1 1.5 2 2.5 3 3.5 4 4.5 5<br />
H o<br />
/h shoal<br />
Fig. 17. Dimensionless return flow, U r , as function <strong>of</strong> H o /h bar for 90 min mean rip current flows measured at PUV6,9,10,11 for yeardays 107–<br />
140. Solid line represents least-squares linear fit for all sensors, total and individual sensor r 2 are presented for H o /h bar V1.<br />
where Q Eulerian =U bar h bar k bar and U bar is the measured<br />
transverse bar velocity (PUV1, 2). Including the<br />
Eulerian transport increases the total discharge over<br />
the transverse bar to approximately the same order <strong>of</strong><br />
magnitude as Q out (Fig. 18). There still is significant<br />
scatter amongst the data associated with using single<br />
point velocity measurements to represent the volume<br />
flux. Though the relationships are statistically significant<br />
for both conceptual models, including the<br />
Q Eulerian reduces the bias.<br />
5. Summary<br />
Rip current kinematics and beach morphodynamics<br />
were measured for 44 days at Sand City,<br />
Monterey Bay, CA obtained from 15 instruments<br />
composed <strong>of</strong> co-located velocity and pressure<br />
sensors, acoustic Doppler current pr<strong>of</strong>ilers, and<br />
rapid kinematic GPS bathymetric mappings. The<br />
morphology consisted <strong>of</strong> a low-tide terrace incised<br />
with quasi-periodic rip channels, transverse bars<br />
system (Wright and Short, 1984). Offshore (17 m)<br />
wave heights and periods ranged 0.20–4.0 m and<br />
5–20 s. The mean wave direction was consistently<br />
near 08 resulting in persistent rip channels, which<br />
evolved in response to the changing wave characteristics.<br />
Video images are found to be a good<br />
proxy for the rip channel bathymetry for wave<br />
heights less than 2 m. When the wave heights<br />
exceed 2 m, the rip channels are obscured by wave<br />
breaking, but flow measurements indicate strong, O<br />
(1m/s), rip currents were still present. It was found<br />
that there was an inverse relationship between
132<br />
J.H. MacMahan et al. / Marine Geology 218 (2005) 113–134<br />
70<br />
60<br />
Hourly Means<br />
70<br />
60<br />
Hourly Means<br />
PUV9<br />
PUV10<br />
PUV6<br />
50<br />
50<br />
Q out<br />
40<br />
30<br />
Q out<br />
40<br />
30<br />
20<br />
20<br />
10<br />
r 2 =0.13<br />
0<br />
0 20 40 60<br />
Q in<br />
=Q Stokes<br />
+Q roller<br />
10<br />
r 2 =0.16<br />
0<br />
0 20 40 60<br />
Q in<br />
=Q Eulerian<br />
+Q Stokes<br />
+Q roller<br />
Fig. 18. Daily estimates <strong>of</strong> transverse bar ( Q in ) and rip channel discharge ( Q out ), which are both significantly correlated based on the large<br />
number <strong>of</strong> points.<br />
erosional and accretional trends between the rip<br />
channels and the neighboring transverse bars, once<br />
the system reached equilibrium. The spatial distribution<br />
<strong>of</strong> sediments reflects the background rip<br />
current flow field.<br />
The cellular circulation <strong>of</strong> rip currents was a<br />
persistent background flow, with predominantly<br />
shoreward flow on the transverse bars P<br />
(U(V0)g0.90) and seaward flow within the rip<br />
channels ( P (U z0)g0.90). The alongshore flows<br />
were equally-distributed or directionally-biased<br />
owing to the instrument location relative to the<br />
continuously evolving rip morphology. Vertical<br />
pr<strong>of</strong>iles illustrate that no seaward two dimensional<br />
return flow (undertow) was present on the transverse<br />
bar. Vertical pr<strong>of</strong>iles within the rip channel<br />
found large, near surface, vertical shear owing to<br />
the <strong>of</strong>fshore flowing rip current encountering the<br />
onshore flowing Stokes drift. Single point measurements<br />
reasonably represented the depth averaged<br />
flow from bottom to MSL calculated from the<br />
vertical pr<strong>of</strong>iles within the surf zone. Temporal<br />
variations in mean rip current velocities were<br />
correlated with <strong>of</strong>fshore sea-swell conditions and<br />
inversely related to tidalpelevation. ffiffiffiffiffiffiffiffiffi Non-dimensional<br />
rip current flows U r = ðghÞ<br />
were significantly<br />
correlated with H o /h bar b1 resulting in an r 2 ~0.37<br />
for various instruments in the nearshore, similar to<br />
relationships found in laboratory measurement.<br />
However, an upper limit was found in the field<br />
measurements. Observations show that the onshore<br />
Eulerian transport over the bar and the onshore<br />
transport <strong>of</strong> waves within the rip channel should be<br />
accounted for in the continuity equation that were<br />
not previously included.<br />
Acknowledgements<br />
We extend our appreciation to the many folks who<br />
assisted in obtaining a great data set: Loraine Chial,<br />
Ron Cowen, Jason Engle, James Joyner, Gregory<br />
Miller, Tom Lippmann, Denis Morichon, Bruce<br />
Morris, Mark Orzech, Jennifer Short, Sidney Sch<strong>of</strong>ield,<br />
Jim Stockel, Charlotte Webb, Rob Wyland and<br />
volunteers from the Hopkins Marine Station (Stanford<br />
University) led by Mark Denny. We thank Tom<br />
Herbers and Paul Jessen for providing <strong>of</strong>fshore buoy<br />
data. A special thanks to Edie Gallagher for leading the<br />
survey work. We thank Nathaniel Plant for the video<br />
rectification. The Steep Beach Experiment was funded<br />
by the Office <strong>of</strong> <strong>Naval</strong> Research (ONR), Coastal<br />
Sciences Program under contract N0001402WR20188<br />
and data analysis by the National Science Foundation<br />
under contract OCE-01366882 and ONR. JM held a<br />
National Research Council-<strong>NPS</strong> Research Associate-
J.H. MacMahan et al. / Marine Geology 218 (2005) 113–134 133<br />
ship funded by the National Science Foundation<br />
under contract OCE-01366882 and ONR contract<br />
N0001402WR20188. Additional funding was provied<br />
to JM by the Florida Sea Grant Program. AR<br />
held a National Research Council-<strong>NPS</strong> Research<br />
Associateship funded by ONR. Additional funding<br />
for AR was provided by the Dutch National Science<br />
Foundation, contract DCB.5856. We appreciate the<br />
discussions with Graham Symonds. We thank the<br />
reviewers for their comments, which has improved<br />
the quality <strong>of</strong> the paper.<br />
References<br />
Aagaard, T., Greenwood, B., Nielsen, J., 1997. Mean currents and<br />
sediment transport in a rip channel. Mar. Geol. 140, 24–45.<br />
Bowen, A.J., 1969. Rip currents: 1. Theoretical investigations.<br />
J. Geophys. Res. 74, 5467–5478.<br />
Bowman, D., Arad, D., Rosen, D.S., Kit, E., Golbery, R., Slavicz,<br />
A., 1988a. Flow characteristics along the rip current system<br />
under low-energy conditions. Mar. Geol. 82, 149–167.<br />
Bowman, D., Rosen, D.S., Kit, E., Arad, D., Slavicz, A., 1988b.<br />
Flow characteristics at the rip current neck under low-energy<br />
conditions. Mar. Geol. 79, 41–54.<br />
Brander, R.W., 1999. Field observations on the morphodynamic<br />
evolution <strong>of</strong> low wave energy rip current system. Mar. Geol.<br />
157, 199–217.<br />
Brander, R.W., Short, A.D., 2000. Morphodynamics <strong>of</strong> a large-scale<br />
rip current system at Muriwai Beach, New Zealand. Mar. Geol.<br />
165, 27–39.<br />
Brander, R.W., Short, A.D., 2001. Flow kinematics <strong>of</strong> low-energy<br />
rip current systems. J. Coast. Res. 17:2, 468–481.<br />
Cooke, D.O., 1970. The occurrence and geologic work <strong>of</strong> rip<br />
currents <strong>of</strong>f southern California. Mar. Geol. 9, 173–186.<br />
Dalrymple, R.A., 1978. Rip currents and their genesis. Summaries,<br />
16th International Conference on Coastal Engineering, Conference<br />
Paper No 140.<br />
Dronen, N., Karunarathna, H., Fredsoe, J., Sumer, B.M., Deigaard,<br />
R., 2002. An experimental study <strong>of</strong> rip channel flow. Coast.<br />
Eng. 45 (3–4), 223–238.<br />
Engle, J., MacMahan, J., Thieke, R.J., Hanes, D.M., Dean, R.G.,<br />
2002. Formulation <strong>of</strong> a rip current predictive index using rescue<br />
data. Florida Shore and Beach Preservation Association<br />
National Conference.<br />
Garcez Faria, A.F., Thornton, E.B., Lippmann, T.C., Stanton, T.P.,<br />
2000. Undertow over a barred beach. J. Geophys. Res. 105,<br />
16999, 17010.<br />
Haas, K.A., Svendsen, I.A., 2002. Laboratory measurements<br />
<strong>of</strong> the vertical structure <strong>of</strong> rip currents. J. Geophys. Res.,<br />
107.<br />
Haas, K.A., Svendsen, I.A., Haller, M.C., Zhao, G., 2003. Quasithree-dimensional<br />
modeling <strong>of</strong> rip current system. J. Geophys.<br />
Res., 108.<br />
Haller, M.C., Dalrymple, R.A., Svendsen, I.A., 2002. Experimental<br />
study <strong>of</strong> nearshore dynamics on a barred beach with rip<br />
channels. J. Geophys. Res. 107 (14), 1 – 21.<br />
Holt, R., 2003, MS thesis, <strong>Naval</strong> <strong>Postgraduate</strong> School.<br />
Kennedy, A.B., Thomas, D., 2004. Drifter measurements in a<br />
laboratory rip current. J. Geophys. Res. 109, C08005.<br />
Komar, P.D., 1971. Nearshore cell circulation <strong>of</strong> the formation <strong>of</strong><br />
giant cusps. Geol. Soc. Amer. Bull. 82, 2643–2650.<br />
Komar, P.D., 1998. Beach Processes and Sedimentation. Prentice<br />
Hall, London. 544 pp.<br />
Lascody, R.L., 1998. East central Florida rip current program.<br />
National Weather Service In-House Report, p. 10.<br />
Lippmann, T.C., Holman, R.A., 1990. The spatial and temporal<br />
variability <strong>of</strong> sand bar morphology. J. Geophys. Res. 95 (7),<br />
11575–11590.<br />
Luschine, J.B., 1991. A study <strong>of</strong> rip current drownings and weather<br />
related factors. Natl. Weather Dig., 13–19.<br />
MacMahan, J., 2001. Hydrographic surveying from a personal<br />
watercraft. J. Surv. Eng. 127 (1).<br />
MacMahan, J., Reniers, A.J.H.M., Thornton, E.B., Stanton, T.,<br />
2004. Infragravity rip current pulsations. J. Geophys. Res. 109,<br />
C01033.<br />
MacMahan, J.H., Reniers, A.J.H.M., Thornton, E.B., Stanton, T.P.,<br />
2004. Surf zone eddies coupled with rip current morphology.<br />
J. Geophys. Res. 109, C07004.<br />
Miller, G., 2001, MS thesis, University <strong>of</strong> Florida.<br />
Munk, W.H., 1949. The solitary wave theory and application to surf<br />
problems. Ann. N.Y. Acad. Sci. 51 (3), 376–424.<br />
Schmidt, W., Woodward, B., Millikan, K., Guza, R., Raubenheimer,<br />
B., Elgar, S., 2003. A GPS-tracked surf zone drifter. J. Atmos.<br />
Ocean. Technol. 20 (97), 1069–1075.<br />
Shepard, F.P., Inman, D.L., 1950. Nearshore water circulation<br />
related to bottom topography and refraction. Trans.-Am. Geophys.<br />
Union 31, 196–212.<br />
Sherman, D.J., Short, A.D., Takeda, I., 1993. Sediment mixing<br />
depth and bedform migration in rip channels. J. Coast. Res. 15,<br />
39–48 (special issue).<br />
Short, A.D., 1985. Rip current type, spacing and persistence,<br />
Narrabeen beach, Australia. Mar. Geol. 65, 47–71.<br />
Short, A.D., 1999. Handbook <strong>of</strong> Beach and Shoreface Morphodynamics.<br />
John Wiley and Sons, p. 379.<br />
Short, A.D., Hesp, P.A., 1982. Wave, beach and dune interactions in<br />
southwest Australia. Mar. Geol. 48, 259–284.<br />
Short, A.D., Hogan, C.L., 1994. Rip currents and beach hazards,<br />
thier impact on public safety and implications for coastal<br />
mangement. In: Finkl, C.W. (Ed.), Coastal Hazards, Journal <strong>of</strong><br />
Coastal Research, Special Issue, vol. 12, pp. 197–209.<br />
Sonu, C.J., 1972. Field observations <strong>of</strong> nearshore circulation and<br />
meandering currents. J. Geophys. Res. 77, 3232–3247.<br />
Svendsen, I.A., 1984a. Wave heights and set-up in a surf zone,<br />
Coast. Eng., 8, 303, 329.<br />
Svendsen, I.A., 1984b. Mass flux and undertow in a surf zone,<br />
Coast. Eng. 8, 347, 365.<br />
Svendsen, I.A., Haas, K.A., Zhao, Q., 2000. Analysis <strong>of</strong> rip current<br />
systems. In: Edge, B.L. (Ed.), Coastal Engineering 2000.<br />
Proceedings <strong>of</strong> 27th International Conference. Am. Soc. Civ.<br />
Eng., New York, pp. 1127–1140.
134<br />
J.H. MacMahan et al. / Marine Geology 218 (2005) 113–134<br />
Thornton, E.B., Swayne, J.L., Dingler, J.R., 1998. Small-scale<br />
morphologyrealted to waves and currents across the surf zone.<br />
Mar. Geol. 145, 173–196.<br />
Weltmer, M., 2003. Bedform evolution and sediment transport<br />
under breaking waves, MS thesis, <strong>Naval</strong> <strong>Postgraduate</strong> School,<br />
p. 86.<br />
Wright, L.D., Short, A.D., 1984. Morhodynamic variability <strong>of</strong> surf<br />
zones and beaches: a synthesis. Mar. Geol. 70, 251–285.<br />
Wright, L.D., Guza, R.T., Short, A.D., 1982. Dynamics <strong>of</strong> a high<br />
energy dissipative surf zone. Mar. Geol. 45, 41–62.