Annual report: Period Ended 31 December 2012 - Invesco Perpetual
Annual report: Period Ended 31 December 2012 - Invesco Perpetual
Annual report: Period Ended 31 December 2012 - Invesco Perpetual

Create successful ePaper yourself
Turn your PDF publications into a flip-book with our unique Google optimized e-Paper software.
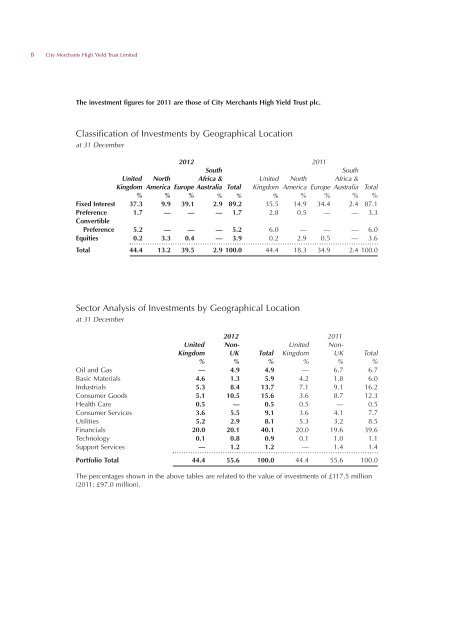
8 City Merchants High Yield Trust Limited<br />
The investment figures for 2011 are those of City Merchants High Yield Trust plc.<br />
Classification of Investments by Geographical Location<br />
at <strong>31</strong> <strong>December</strong><br />
<strong>2012</strong> 2011<br />
South<br />
South<br />
United North Africa & United North Africa &<br />
Kingdom America Europe Australia Total Kingdom America Europe Australia Total<br />
% % % % % % % % % %<br />
Fixed Interest 37.3 9.9 39.1 2.9 89.2 35.5 14.9 34.4 2.4 87.1<br />
Preference 1.7 — — — 1.7 2.8 0.5 — — 3.3<br />
Convertible<br />
Preference 5.2 — — — 5.2 6.0 — — — 6.0<br />
Equities 0.2 3.3 0.4 — 3.9 0.2 2.9 0.5 — 3.6<br />
Total 44.4 13.2 39.5 2.9 100.0 44.4 18.3 34.9 2.4 100.0<br />
Sector Analysis of Investments by Geographical Location<br />
at <strong>31</strong> <strong>December</strong><br />
<strong>2012</strong> 2011<br />
United Non- United Non-<br />
Kingdom UK Total Kingdom UK Total<br />
% % % % % %<br />
Oil and Gas — 4.9 4.9 — 6.7 6.7<br />
Basic Materials 4.6 1.3 5.9 4.2 1.8 6.0<br />
Industrials 5.3 8.4 13.7 7.1 9.1 16.2<br />
Consumer Goods 5.1 10.5 15.6 3.6 8.7 12.3<br />
Health Care 0.5 — 0.5 0.5 — 0.5<br />
Consumer Services 3.6 5.5 9.1 3.6 4.1 7.7<br />
Utilities 5.2 2.9 8.1 5.3 3.2 8.5<br />
Financials 20.0 20.1 40.1 20.0 19.6 39.6<br />
Technology 0.1 0.8 0.9 0.1 1.0 1.1<br />
Support Services — 1.2 1.2 — 1.4 1.4<br />
Portfolio Total 44.4 55.6 100.0 44.4 55.6 100.0<br />
The percentages shown in the above tables are related to the value of investments of £117.5 million<br />
(2011: £97.0 million).