156: EDA Public Works in RI, 1996-2000 - State of Rhode Island ...
156: EDA Public Works in RI, 1996-2000 - State of Rhode Island ...
156: EDA Public Works in RI, 1996-2000 - State of Rhode Island ...

Create successful ePaper yourself
Turn your PDF publications into a flip-book with our unique Google optimized e-Paper software.
STATEWIDE PLANNING PROGRAM<br />
TECHNICAL PAPER<br />
Number: <strong>156</strong><br />
Date: September 2004<br />
<strong>EDA</strong> PUBLIC WORKS IN<br />
RHODE ISLAND, <strong>1996</strong>-<strong>2000</strong><br />
STATEWIDE PLANNING PROGRAM<br />
<strong>Rhode</strong> <strong>Island</strong> Department <strong>of</strong> Adm<strong>in</strong>istration<br />
One Capitol Hill<br />
Providence, <strong>Rhode</strong> <strong>Island</strong> 02908-5870<br />
www.plann<strong>in</strong>g.ri.gov
The <strong>State</strong>wide Plann<strong>in</strong>g Program, <strong>Rhode</strong> <strong>Island</strong> Department <strong>of</strong> Adm<strong>in</strong>istration, is<br />
established by Chapter 42-11 <strong>of</strong> the General Laws as the central plann<strong>in</strong>g agency for state<br />
government. The work <strong>of</strong> the Program is guided by the <strong>State</strong> Plann<strong>in</strong>g Council, comprised <strong>of</strong><br />
state, local, and public representatives and federal and other advisors.<br />
The objectives <strong>of</strong> the Program are: (1) to prepare strategic and systems plans for the<br />
state; (2) to coord<strong>in</strong>ate activities <strong>of</strong> the public and private sectors with<strong>in</strong> this framework <strong>of</strong><br />
policies and programs; (3) to assist local governments <strong>in</strong> management, f<strong>in</strong>ance, and plann<strong>in</strong>g;<br />
and (4) to advise the Governor and others concerned on physical, social, and economic topics.<br />
This Technical Paper is one <strong>of</strong> a series prepared by the <strong>State</strong>wide Plann<strong>in</strong>g Program.<br />
They all present <strong>in</strong>formation developed through plann<strong>in</strong>g activities to state and federal agencies,<br />
local governments and the public.<br />
Activities <strong>of</strong> the Program are supported by state appropriations and federal grants. The<br />
contents <strong>of</strong> this report reflect the views <strong>of</strong> the <strong>State</strong>wide Plann<strong>in</strong>g Program which is responsible<br />
for the accuracy <strong>of</strong> the facts and data presented here<strong>in</strong>. The contents do not necessarily reflect<br />
the <strong>of</strong>ficial views or policies <strong>of</strong> other sponsor<strong>in</strong>g agencies. This publication is based upon<br />
publicly supported research and may not be copyrighted. It may be repr<strong>in</strong>ted, <strong>in</strong> part or full, with<br />
the customary credit<strong>in</strong>g <strong>of</strong> the source.<br />
Contact the <strong>State</strong>wide Plann<strong>in</strong>g Program, One Capitol Hill, Providence, <strong>RI</strong> (401) 222-<br />
7901. Copies <strong>of</strong> this report are also available on the web at www.plann<strong>in</strong>g.ri.gov. Copies may<br />
also be made available as an electronic file.
ABSTRACT<br />
TITLE: <strong>EDA</strong> <strong>Public</strong> <strong>Works</strong> <strong>in</strong> <strong>Rhode</strong> <strong>Island</strong>, <strong>1996</strong>-<strong>2000</strong><br />
SUBJECT:<br />
A performance assessment <strong>of</strong> projects funded by the U.S.<br />
Department <strong>of</strong> Commerce, Economic Development<br />
Adm<strong>in</strong>istration (<strong>EDA</strong>)<br />
DATE: September 2004<br />
AGENCY <strong>State</strong>wide Plann<strong>in</strong>g Program<br />
AND<br />
<strong>Rhode</strong> <strong>Island</strong> Department <strong>of</strong> Adm<strong>in</strong>istration<br />
SOURCE OF One Capitol Hill<br />
COPIES: Providence, <strong>RI</strong> 02908<br />
SE<strong>RI</strong>ES NO.: Technical Paper <strong>156</strong><br />
NO. OF PAGES:<br />
ABSTRACT:<br />
41, plus two appendices<br />
This technical report presents the results <strong>of</strong> a survey <strong>of</strong> n<strong>in</strong>e<br />
<strong>EDA</strong>-funded projects that were priority listed <strong>in</strong> <strong>Rhode</strong><br />
<strong>Island</strong>’s Overall Economic Development Program (OEDP) or<br />
the Comprehensive Economic Development Strategy<br />
(CEDS). Exam<strong>in</strong>ed are the impacts <strong>of</strong> the projects on job<br />
generation, wages, and promotion <strong>of</strong> other development, as<br />
well as process-related issues such as selection criteria,<br />
grant awards, project location, and commitment from the<br />
private sector. Changes <strong>in</strong> the CEDS application process<br />
are suggested to enhance performance <strong>in</strong> both process and<br />
results.<br />
i
PREFACE<br />
In 1971, the <strong>State</strong> Plann<strong>in</strong>g Council assumed responsibility as the <strong>State</strong> <strong>of</strong><br />
<strong>Rhode</strong> <strong>Island</strong>’s Overall Economic Development Program (OEDP) Committee.<br />
Four years later the first annual report appeared that established a priority<br />
rank<strong>in</strong>g system to screen projects be<strong>in</strong>g proposed for fund<strong>in</strong>g by the U.S.<br />
Economic Development Adm<strong>in</strong>istration (<strong>EDA</strong>). Each project would atta<strong>in</strong> po<strong>in</strong>ts<br />
based on criteria measur<strong>in</strong>g job development potential, area <strong>of</strong> <strong>in</strong>fluence,<br />
environmental considerations, completion <strong>of</strong> necessary studies, availability <strong>of</strong><br />
non-federal match<strong>in</strong>g funds, and recent fluctuations <strong>in</strong> employment levels. The<br />
scores obta<strong>in</strong>ed would be the basis <strong>of</strong> a project’s priority rank<strong>in</strong>g, the highest<br />
scores atta<strong>in</strong><strong>in</strong>g the highest priority.<br />
This system is still the basis <strong>of</strong> project selection <strong>in</strong> <strong>Rhode</strong> <strong>Island</strong>.<br />
Remarkably, while categories with<strong>in</strong> the criteria are periodically revised to reflect<br />
chang<strong>in</strong>g conditions or to enhance their effectiveness <strong>in</strong> choos<strong>in</strong>g the best<br />
projects, the criteria at their core have rema<strong>in</strong>ed the same. However, while<br />
<strong>Rhode</strong> <strong>Island</strong> has nearly thirty years <strong>of</strong> practice select<strong>in</strong>g projects for priority<br />
list<strong>in</strong>g, there has not been a performance evaluation to see how well, or how<br />
poorly, the projects meet their economic development objectives once funded<br />
and implemented. That is the purpose <strong>of</strong> this technical paper.<br />
<strong>EDA</strong> <strong>Public</strong> <strong>Works</strong> <strong>in</strong> <strong>Rhode</strong> <strong>Island</strong>, <strong>1996</strong>-<strong>2000</strong> is a survey that beg<strong>in</strong>s<br />
with the OEDP project solicitation <strong>of</strong> 1995, ends with the Comprehensive<br />
Economic Development Strategy (CEDS) solicitation <strong>of</strong> 1999, and assesses the<br />
impact <strong>of</strong> the projects on employment, wages and economic sp<strong>in</strong>-<strong>of</strong>f through<br />
2003.<br />
This technical paper was written by Bruce F. Vild, Supervis<strong>in</strong>g Planner,<br />
and Joyce S. Karger, Pr<strong>in</strong>cipal Planner, <strong>of</strong> the Economic Development Plann<strong>in</strong>g<br />
Section <strong>of</strong> the <strong>State</strong>wide Plann<strong>in</strong>g Program. It was prepared for publication<br />
under Task 2101, as described <strong>in</strong> the Work Program for the <strong>State</strong>wide Plann<strong>in</strong>g<br />
Program for state fiscal year 2004. <strong>State</strong> appropriations and a grant from the<br />
<strong>EDA</strong> under Section 203 <strong>of</strong> the <strong>Public</strong> <strong>Works</strong> and Economic Development Act <strong>of</strong><br />
1965, as amended, supported this work.<br />
The authors <strong>of</strong> this paper would like to thank the follow<strong>in</strong>g <strong>in</strong>dividuals who<br />
were will<strong>in</strong>g to provide <strong>in</strong>formation about the projects undertaken by their<br />
communities, agencies or nonpr<strong>of</strong>its: Kathryn Callan, Providence Perform<strong>in</strong>g<br />
Arts Center; Nancy Carrott, R.I. Economic Development Corporation; Alan<br />
Goodw<strong>in</strong>, City <strong>of</strong> Newport; Roberta Bell Hourigan, Heritage Harbor Museum;<br />
Michael Lepore, City <strong>of</strong> Providence; David Maher and Michael DeLuca, City <strong>of</strong><br />
Cranston; Joel Mathews, City <strong>of</strong> Woonsocket; and L<strong>in</strong>da Soderberg, R.I.<br />
Department <strong>of</strong> Labor and Tra<strong>in</strong><strong>in</strong>g.<br />
ii
We also acknowledge the assistance <strong>of</strong> Stephen Grady and Cassandra<br />
Lighty from the Philadelphia Office <strong>of</strong> the <strong>EDA</strong> <strong>in</strong> obta<strong>in</strong><strong>in</strong>g <strong>in</strong>formation about<br />
<strong>EDA</strong> grant awards and non-federal match<strong>in</strong>g funds for the period surveyed.<br />
This paper <strong>in</strong>corporates a system whereby notes and references are cited<br />
by a number <strong>in</strong> double parentheses. These numbers correspond to the citations<br />
<strong>in</strong> the Notes and References beg<strong>in</strong>n<strong>in</strong>g on page 33. Under this system, quoted<br />
or paraphrased material from the n<strong>in</strong>th reference would be cited ((9)).<br />
iii
TABLE OF CONTENTS<br />
Abstract<br />
Preface<br />
List <strong>of</strong> Tables<br />
List <strong>of</strong> Figures<br />
Page<br />
i<br />
ii<br />
v<br />
v<br />
Part One: INTRODUCTION 1<br />
<strong>State</strong>wide Plann<strong>in</strong>g’s review and need for follow-up 2<br />
Focus <strong>of</strong> our research 3<br />
Part Two: SELECTION OF PROJECTS FOR REVIEW 5<br />
Part Three: ASSESSMENT OF THE OEDP/CEDS PROCESS 7<br />
Question 1: How high did the projects funded by the <strong>EDA</strong> score relative 8<br />
to other OEDP or CEDS proposals that year?<br />
Question 2: On what criteria did the projects score the most po<strong>in</strong>ts? 8<br />
Question 3: How did the <strong>EDA</strong> funds awarded actually compare with the 9<br />
amount on the OEDP or CEDS application?<br />
Question 4: How many projects had a share <strong>of</strong> the match from private 11<br />
sources?<br />
Question 5: Where were the projects located? 12<br />
Assessment 13<br />
Part Four: PROJECT PERFORMANCE, ONCE FUNDED AND IMPLEMENTED 14<br />
Did community employment figures improve? What was the contribution 14<br />
<strong>of</strong> each project?<br />
How do the actual job generation figures compare with those anticipated 16<br />
from the OEDP and CEDS applications?<br />
What was the impact <strong>of</strong> the project on wages? 19<br />
Have the projects promoted other development? 20<br />
Assessment 26<br />
Part Five: RECOMMENDED CHANGES IN THE CEDS APPLICATION PROCESS 30<br />
F<strong>in</strong>d<strong>in</strong>gs: Job generation 31<br />
F<strong>in</strong>d<strong>in</strong>gs: Wages 32<br />
Other f<strong>in</strong>d<strong>in</strong>gs 32<br />
iv
NOTES AND REFERENCES 33<br />
Appendix A: SUMMARY OF OEDP/CEDS P<strong>RI</strong>O<strong>RI</strong>TY SYSTEM FOR RANKING A-1<br />
PROJECTS<br />
Appendix B: APPLYING MULTIPLIERS: A SAMPLE CALCULATION B-1<br />
LIST OF TABLES<br />
Table<br />
Page<br />
1 OEDP/CEDS Projects <strong>in</strong> <strong>Rhode</strong> <strong>Island</strong> Funded by the <strong>EDA</strong>, <strong>1996</strong>-<strong>2000</strong> 10<br />
2 <strong>EDA</strong> Funds: Comparison <strong>of</strong> OEDP/CEDS Applications and <strong>EDA</strong> Grant 11<br />
Awards<br />
3 Location <strong>of</strong> <strong>EDA</strong>-funded Projects 12<br />
4 Annual Average Resident Employment <strong>in</strong> Host Communities 15<br />
5 Annual Average Establishment Employment <strong>in</strong> Host Communities 17<br />
6 Direct Employment Generated by <strong>EDA</strong>-funded Projects, <strong>1996</strong>-<strong>2000</strong> 18<br />
7 Average Employment and Wages <strong>in</strong> Affected Industries, 1995-2002 21<br />
8 Employment Multiplier Effects <strong>of</strong> <strong>EDA</strong>-funded Projects, <strong>1996</strong>-<strong>2000</strong> 24<br />
9 Construction Multiplier Effects <strong>of</strong> <strong>EDA</strong>-funded Projects, <strong>1996</strong>-<strong>2000</strong> 25<br />
10 Project Rank<strong>in</strong>g and Performance 27<br />
LIST OF FIGURES<br />
Figure<br />
Page<br />
1 Average Annual Wages <strong>in</strong> Affected Industries 22<br />
v
Part One:<br />
INTRODUCTION<br />
Under a plann<strong>in</strong>g grant obta<strong>in</strong>ed from the U.S. Department <strong>of</strong> Commerce,<br />
Economic Development Adm<strong>in</strong>istration (<strong>EDA</strong>), the <strong>State</strong>wide Plann<strong>in</strong>g Program<br />
prepares and ma<strong>in</strong>ta<strong>in</strong>s <strong>Rhode</strong> <strong>Island</strong>’s Comprehensive Economic Development<br />
Strategy (CEDS). The CEDS is <strong>in</strong>tended to l<strong>in</strong>k state and federal policy with<br />
local economic development. The CEDS consists <strong>of</strong> goals and implementation<br />
mechanisms based on the primary economic development element <strong>in</strong> the <strong>State</strong><br />
Guide Plan, the Economic Development Policies and Plan. The <strong>EDA</strong> takes an<br />
active role support<strong>in</strong>g <strong>Rhode</strong> <strong>Island</strong>’s CEDS, not only by provid<strong>in</strong>g f<strong>in</strong>ancial<br />
assistance through the grant, but by review<strong>in</strong>g and approv<strong>in</strong>g annual reports,<br />
evaluations, and program updates connected with the CEDS.<br />
Central to the CEDS is the project solicitation <strong>State</strong>wide Plann<strong>in</strong>g<br />
conducts each year to develop the Priority Project List. The proposals received<br />
are reviewed and scored accord<strong>in</strong>g to several specific criteria ((1)). These<br />
criteria are designed to select proposals that will help implement the Economic<br />
Development Policies and Plan as well as meet basic <strong>EDA</strong> eligibility<br />
requirements. Those that score well are placed on the Priority Project List.<br />
<strong>State</strong>wide Plann<strong>in</strong>g considers the proposals chosen for the list to be good<br />
candidates for the <strong>EDA</strong>’s public works grants or other types <strong>of</strong> assistance.<br />
Hav<strong>in</strong>g a proposal placed on the Priority Project List is only provisional<br />
approval. An <strong>EDA</strong>-mandated CEDS Committee must review, confirm and<br />
endorse the list. In <strong>Rhode</strong> <strong>Island</strong>, the CEDS Committee has three tiers: the <strong>State</strong><br />
Plann<strong>in</strong>g Council, its Technical Committee, and a CEDS Subcommittee drawn<br />
from members <strong>of</strong> the Technical Committee and local economic development<br />
practitioners. When the Priority Project List is presented to the <strong>EDA</strong> <strong>in</strong> the CEDS<br />
annual report, the approval <strong>of</strong> the CEDS Committee must be documented. Such<br />
approval <strong>in</strong>dicates to the <strong>EDA</strong> that the projects have been endorsed at the state<br />
level and are consistent with the CEDS.<br />
Approval is still “provisional” or “conditional” at this po<strong>in</strong>t, and project<br />
proponents must request fund<strong>in</strong>g from the <strong>EDA</strong> and be <strong>in</strong>vited to apply.<br />
However, placement on the Priority Project List is key to further action by the<br />
<strong>EDA</strong>. For the <strong>EDA</strong>, the list represents an important “first cut” <strong>in</strong> the grant<br />
approval process. Mak<strong>in</strong>g the list is, <strong>in</strong> practice, the first step <strong>in</strong> submitt<strong>in</strong>g a<br />
successful application to the <strong>EDA</strong>.<br />
As the <strong>EDA</strong> will subject each proposal to a rigorous review beyond what is<br />
required under the CEDS, not every project on the Priority Project List will<br />
ultimately w<strong>in</strong> <strong>EDA</strong> fund<strong>in</strong>g, but every project w<strong>in</strong>n<strong>in</strong>g that fund<strong>in</strong>g will have been<br />
on the list.<br />
1
<strong>State</strong>wide Plann<strong>in</strong>g’s review and the need for follow-up<br />
At the end <strong>of</strong> the CEDS project solicitation period, <strong>State</strong>wide Plann<strong>in</strong>g<br />
reviews the proposals to make sure they satisfy certa<strong>in</strong> threshold requirements<br />
such as consistency with the <strong>State</strong> Guide Plan. Then the projects are scored,<br />
giv<strong>in</strong>g proposals additional credit for generat<strong>in</strong>g well-pay<strong>in</strong>g jobs, be<strong>in</strong>g located <strong>in</strong><br />
areas <strong>of</strong> economic distress, and hav<strong>in</strong>g solid commitments <strong>of</strong> match<strong>in</strong>g funds<br />
and private <strong>in</strong>vestment. This conforms to basic eligibility requirements ((2)),<br />
<strong>in</strong>vestment guidel<strong>in</strong>es and other means the <strong>EDA</strong> uses to screen the proposals it<br />
receives for fund<strong>in</strong>g.<br />
Until now there has not been a review <strong>of</strong> the program spann<strong>in</strong>g several<br />
years to gauge the success <strong>of</strong> <strong>Rhode</strong> <strong>Island</strong>’s CEDS <strong>in</strong> select<strong>in</strong>g projects that<br />
ultimately will prove attractive to the <strong>EDA</strong>. While we frequently revisit the scor<strong>in</strong>g<br />
criteria to keep them <strong>in</strong> l<strong>in</strong>e with state and federal policy, <strong>Rhode</strong> <strong>Island</strong>’s<br />
experience has been that, <strong>of</strong> the twenty or more proposals mak<strong>in</strong>g the Priority<br />
Project List each year, only two or three <strong>of</strong> them at most get funded. What are<br />
the reasons for this?<br />
Some successful CEDS applicants do not carry their proposals to the next<br />
step, a request for fund<strong>in</strong>g from the <strong>EDA</strong>. They may have not secured<br />
anticipated match<strong>in</strong>g funds, been unable to acquire clear title to property,<br />
required further study, or had other reasons to postpone their request. We have<br />
tried to address this issue by disallow<strong>in</strong>g these proposals from be<strong>in</strong>g submitted<br />
aga<strong>in</strong>, unless some contact has been made with the <strong>EDA</strong> to advance the<br />
proposal. This policy went <strong>in</strong>to effect with the 2003 project solicitation.<br />
Others unsuccessful <strong>in</strong> obta<strong>in</strong><strong>in</strong>g fund<strong>in</strong>g may have submitted concept<br />
papers to the <strong>EDA</strong> describ<strong>in</strong>g their projects, only to be <strong>in</strong>formed that they failed to<br />
meet eligibility requirements ((3)). Still others may have had their projects judged<br />
less “competitive” for the limited <strong>EDA</strong> fund<strong>in</strong>g than other projects <strong>in</strong> other parts <strong>of</strong><br />
the country. These outcomes are discourag<strong>in</strong>g not only for the applicants, but for<br />
the staff oversee<strong>in</strong>g the CEDS. Understand<strong>in</strong>g that the CEDS serves as the<br />
<strong>in</strong>itial screen for fund<strong>in</strong>g eligibility, we need to exam<strong>in</strong>e whether the CEDS<br />
scor<strong>in</strong>g criteria are up to the job <strong>of</strong> select<strong>in</strong>g good (i.e., fundable) projects – and,<br />
more fundamentally, whether the state’s goals <strong>in</strong> the CEDS are eclips<strong>in</strong>g or<br />
conflict<strong>in</strong>g with what the <strong>EDA</strong> is emphasiz<strong>in</strong>g dur<strong>in</strong>g a given grant period.<br />
Follow-up<br />
Another issue is the “disconnect” once the priority list is f<strong>in</strong>alized and sent<br />
to the <strong>EDA</strong>. At that po<strong>in</strong>t <strong>State</strong>wide Plann<strong>in</strong>g essentially leaves the process,<br />
except if contacted by project proponents for assistance <strong>in</strong> putt<strong>in</strong>g together their<br />
applications to the <strong>EDA</strong>. Projects are funded, completed and open for bus<strong>in</strong>ess<br />
with little or no follow-up either with or by <strong>State</strong>wide Plann<strong>in</strong>g. The evidence we<br />
2
glean <strong>of</strong> economic benefit from the projects is largely anecdotal, or <strong>in</strong>ferred from<br />
employment statistics from the R.I. Department <strong>of</strong> Labor and Tra<strong>in</strong><strong>in</strong>g (DLT).<br />
Without a reliable read<strong>in</strong>g <strong>of</strong> project outcomes important to the <strong>EDA</strong>,<br />
particularly job creation, we may be miss<strong>in</strong>g <strong>in</strong>sights that could lead to<br />
improvements <strong>in</strong> the CEDS – <strong>in</strong> the strategy itself, and <strong>in</strong> the criteria we use to<br />
score projects. This <strong>in</strong>cludes fashion<strong>in</strong>g priority lists with more competitive<br />
projects (from the <strong>EDA</strong>’s standpo<strong>in</strong>t), and gett<strong>in</strong>g more projects funded as a<br />
result. The relatively small number <strong>of</strong> projects that get funded from our priority<br />
lists may be speak<strong>in</strong>g to this problem.<br />
This is not considered a criticism per se <strong>of</strong> the project proponents, the<br />
<strong>EDA</strong>, or for that matter <strong>State</strong>wide Plann<strong>in</strong>g. In h<strong>in</strong>dsight, this agency should<br />
have pursued this <strong>in</strong>formation more actively. We have done so now with the<br />
hope that it will <strong>in</strong>dicate what we have done right with the CEDS, and what needs<br />
improvement.<br />
Focus <strong>of</strong> our research<br />
In 2002, the <strong>Rhode</strong> <strong>Island</strong> College Center for <strong>Public</strong> Policy applied for a<br />
capacity build<strong>in</strong>g grant from the <strong>EDA</strong> to conduct a comprehensive review <strong>of</strong> all<br />
<strong>EDA</strong>-funded projects <strong>in</strong> <strong>Rhode</strong> <strong>Island</strong>, from 1965 to 2001. The <strong>in</strong>tention was to<br />
determ<strong>in</strong>e how well the projects performed <strong>in</strong> terms <strong>of</strong> job creation, economic<br />
partnership creation, leverag<strong>in</strong>g additional fund<strong>in</strong>g, and other <strong>in</strong>dicators <strong>of</strong><br />
success. One product <strong>of</strong> this research was to be a performance measures<br />
handbook for guid<strong>in</strong>g future projects and scor<strong>in</strong>g criteria under the CEDS.<br />
<strong>State</strong>wide Plann<strong>in</strong>g was to contribute to this effort, provid<strong>in</strong>g access to files and<br />
reports, advice, <strong>in</strong>stitutional memory, and other assistance <strong>in</strong>clud<strong>in</strong>g review as<br />
requested by the Center. That project, unfortunately, was not funded by the<br />
<strong>EDA</strong>, and the answers we anticipated from it were not forthcom<strong>in</strong>g.<br />
The aim <strong>of</strong> this technical paper is to <strong>in</strong>itiate and complete what was to be<br />
the Center for <strong>Public</strong> Policy’s task, though more modestly. We wanted to<br />
determ<strong>in</strong>e whether the economic benefit anticipated from <strong>EDA</strong>-funded projects<br />
was actually obta<strong>in</strong>ed – employment at decent wages <strong>in</strong> economically distressed<br />
areas, with a strong commitment from local <strong>of</strong>ficials and the private sector. We<br />
also wanted to see how well the process worked <strong>in</strong> solicit<strong>in</strong>g and select<strong>in</strong>g<br />
projects likely to be funded by the <strong>EDA</strong>. Our methods <strong>in</strong>cluded exam<strong>in</strong>ation <strong>of</strong><br />
data from the DLT, conversations with project proponents, and a review <strong>of</strong> past<br />
project solicitations to see how well the funded projects scored relative to other<br />
proposals. If this research shows that improvements <strong>in</strong> the program are needed,<br />
the <strong>in</strong>tention will be to concentrate that effort on the aspect most obvious to<br />
applicants and reviewers, the CEDS Priority Project Rat<strong>in</strong>g System that <strong>in</strong>cludes<br />
the scor<strong>in</strong>g criteria.<br />
3
Reference is made <strong>in</strong> this report to the OEDP (Overall Economic<br />
Development Program). This was the predecessor <strong>of</strong> the CEDS, the name<br />
change effective from 1999. Most <strong>of</strong> the projects <strong>in</strong> our survey began as OEDP<br />
applications, subject to threshold and scor<strong>in</strong>g criteria <strong>in</strong> the same manner as<br />
more recent CEDS projects. For the purposes <strong>of</strong> this paper, the acronyms<br />
OEDP and CEDS are <strong>in</strong>terchangeable.<br />
4
Part Two:<br />
SELECTION OF PROJECTS FOR REVIEW<br />
Unlike the Center for <strong>Public</strong> Policy, we limited our project review to the<br />
five-year period <strong>1996</strong> to <strong>2000</strong>. The years <strong>1996</strong> to <strong>2000</strong> were selected to allow for<br />
project completion and measurable results, <strong>in</strong>clud<strong>in</strong>g the commitment <strong>of</strong> funds<br />
from non-federal sources (<strong>in</strong>clud<strong>in</strong>g private funds), job generation, and sp<strong>in</strong>-<strong>of</strong>f<br />
activity. The period perta<strong>in</strong>s to federal fiscal years, not calendar years; i.e.,<br />
“<strong>1996</strong>” for the purposes <strong>of</strong> our discussion runs from October 1, 1995 to<br />
September 30, <strong>1996</strong>, “1997” from October 1, <strong>1996</strong> to September 30, 1997, etc.<br />
Dur<strong>in</strong>g that time, the <strong>EDA</strong> awarded grants to the follow<strong>in</strong>g projects <strong>in</strong><br />
<strong>Rhode</strong> <strong>Island</strong>:<br />
• Providence Perform<strong>in</strong>g Arts Center Expansion, Providence (<strong>1996</strong>)<br />
• Heritage Harbor (<strong>Rhode</strong> <strong>Island</strong> Heritage Museum), Providence (1997)<br />
• Bulkhead Replacement, Port <strong>of</strong> Davisville, North K<strong>in</strong>gstown (1997)<br />
• Halsey Street Industrial Park Expansion, Newport (1998)<br />
• Gorham Site Redevelopment, Providence (1998)<br />
• Cranston Street Armory, Providence (1999)<br />
• Pier 2 Structural Repairs, Port <strong>of</strong> Davisville, North K<strong>in</strong>gstown (1999)<br />
• Ladd Center Infrastructure, Exeter (1999)<br />
• Narragansett Brewery Redevelopment, Cranston (<strong>2000</strong>)<br />
• Stadium Theater Restoration, Woonsocket (<strong>2000</strong>)<br />
The Cranston Street Armory was excluded from this review. Although the<br />
work funded by the <strong>EDA</strong> grant was completed, the build<strong>in</strong>g will now be placed <strong>in</strong><br />
a different use than was orig<strong>in</strong>ally proposed. It is not yet occupied, so a direct<br />
economic impact (specifically job generation) cannot be demonstrated. Reuse<br />
plans are still under discussion, and may eventually be expanded to <strong>in</strong>clude<br />
neighborhood groups seek<strong>in</strong>g a space for their activities. On the other hand, all<br />
<strong>of</strong> the other projects have created or reta<strong>in</strong>ed jobs, the number <strong>of</strong> which has<br />
been documented by the applicants or developers.<br />
The applicants sponsor<strong>in</strong>g these projects <strong>in</strong>cluded the City <strong>of</strong> Providence<br />
(Perform<strong>in</strong>g Arts Center Expansion, Heritage Harbor, and Gorham Site<br />
Redevelopment), the City <strong>of</strong> Newport (Halsey Street Industrial Park Expansion),<br />
the City <strong>of</strong> Cranston (Narragansett Brewery Redevelopment), and the City <strong>of</strong><br />
Woonsocket (Stadium Theater Restoration). The R.I. Economic Development<br />
Corporation proposed the Davisville Bulkhead Replacement, Pier 2 Structural<br />
Repairs, and, as partners with the Central <strong>Rhode</strong> <strong>Island</strong> Development<br />
Corporation, the Ladd Center Infrastructure project ((4)).<br />
We contacted the applicants for <strong>in</strong>formation regard<strong>in</strong>g new and reta<strong>in</strong>ed<br />
jobs. The rema<strong>in</strong>der <strong>of</strong> the data on economic impact was obta<strong>in</strong>ed from the R.I.<br />
5
Department <strong>of</strong> Labor and Tra<strong>in</strong><strong>in</strong>g, from the orig<strong>in</strong>al CEDS and OEDP files, and<br />
from the <strong>Public</strong> <strong>Works</strong> Division at the <strong>EDA</strong>. These sources are credited as<br />
appropriate throughout this report.<br />
6
Part Three:<br />
ASSESSMENT OF THE OEDP/CEDS PROCESS<br />
The primary economic development element <strong>of</strong> the <strong>State</strong> Guide Plan, the<br />
Economic Development Policies and Plan, lays the groundwork for actions that<br />
address the development <strong>of</strong> <strong>in</strong>dustries with high potential, employment<br />
enhancement and job tra<strong>in</strong><strong>in</strong>g, public and private <strong>in</strong>vestment, <strong>in</strong>dustrial sites and<br />
<strong>in</strong>frastructure, economic and cultural diversity, and many other topics. First<br />
through <strong>Rhode</strong> <strong>Island</strong>’s OEDP and then the CEDS, planners and practitioners <strong>in</strong><br />
the public and private non-pr<strong>of</strong>it sectors – at the state, regional, and local levels –<br />
are encouraged to submit creative project proposals that implement their own<br />
economic development strategies, as well as the Plan’s long-term objectives.<br />
The criteria developed for the CEDS Priority Project Rat<strong>in</strong>g System<br />
address specific needs identified <strong>in</strong> the Economic Development Policies and Plan<br />
as well as issues that must be addressed to ensure consistency with other<br />
elements <strong>of</strong> the <strong>State</strong> Guide Plan. The <strong>State</strong> Plann<strong>in</strong>g Council and Technical<br />
Committee must approve any changes to the criteria proposed by the CEDS<br />
Subcommittee before they can be applied <strong>in</strong> the next project solicitation.<br />
We require that CEDS applicants identify a specific objective or policy<br />
from the Policies and Plan that their project proposals will help implement. Then,<br />
we use the Priority Project Rat<strong>in</strong>g System to award po<strong>in</strong>ts based on where we<br />
want to focus development, on the projects’ impacts on employment and wealth<br />
generation, on the commitment <strong>of</strong> other fund<strong>in</strong>g sources to the projects, and on<br />
the economic programs we hope to tap. For example, one criterion <strong>in</strong> the Rat<strong>in</strong>g<br />
System assesses how many permanent, non-construction jobs are to be<br />
generated per <strong>EDA</strong> dollar <strong>in</strong>vested – and what the anticipated wages will be.<br />
Another determ<strong>in</strong>es the amount and source <strong>of</strong> non-federal support the applicants<br />
are committ<strong>in</strong>g to the project and awards po<strong>in</strong>ts accord<strong>in</strong>gly.<br />
The CEDS Committee cont<strong>in</strong>uously ref<strong>in</strong>es and revises the Rat<strong>in</strong>g System<br />
criteria so that projects selected for the Priority List reflect and effectively<br />
implement the state’s economic development objectives as outl<strong>in</strong>ed <strong>in</strong> the CEDS<br />
5 Year Update and the Annual Reports.<br />
The jobs created as a result <strong>of</strong> <strong>EDA</strong>’s <strong>in</strong>vestments should provide higherthan-average<br />
wages <strong>in</strong> distressed communities and should promote regional<br />
prosperity. Applicants should commit a high level <strong>of</strong> non-federal match<strong>in</strong>g funds,<br />
<strong>in</strong>clud<strong>in</strong>g private <strong>in</strong>vestment. This will <strong>in</strong>dicate a higher level <strong>of</strong> commitment to<br />
successful completion by the public sector and higher market-based credibility by<br />
the private sector.<br />
This study seeks to determ<strong>in</strong>e whether the economic benefit anticipated<br />
from <strong>EDA</strong>-funded projects was actually obta<strong>in</strong>ed: employment at decent wages <strong>in</strong><br />
7
economically distressed areas, with a strong commitment from local <strong>of</strong>ficials and<br />
the private sector. We also wanted to determ<strong>in</strong>e how well the CEDS process is<br />
work<strong>in</strong>g <strong>in</strong> solicit<strong>in</strong>g and select<strong>in</strong>g projects likely to be funded by the <strong>EDA</strong>.<br />
Based on what we learn from this study, we may determ<strong>in</strong>e that the<br />
Priority Project Rat<strong>in</strong>g System requires further revision. This could mean<br />
adjust<strong>in</strong>g the po<strong>in</strong>t scales for the criteria, add<strong>in</strong>g new criteria, or elim<strong>in</strong>at<strong>in</strong>g<br />
criteria that did not prove effective. The follow<strong>in</strong>g questions were posed.<br />
Question 1: How high did the projects funded by the <strong>EDA</strong> score relative to<br />
other OEDP or CEDS proposals that year?<br />
Of the n<strong>in</strong>e projects under analysis, three scored <strong>in</strong> the top ten percent <strong>in</strong><br />
their respective years. The Stadium Theater Restoration project <strong>in</strong> Woonsocket<br />
placed first among 30 project proposals submitted <strong>in</strong> 1999. In 1998, the<br />
<strong>RI</strong>EDC/C<strong>RI</strong>DCO/Ladd Center project placed second among 36 proposals. In<br />
1997, the Providence Gorham Site Redevelopment project placed fourth among<br />
41 proposals.<br />
Stand<strong>in</strong>gs with<strong>in</strong> the top ten percent were not consistent <strong>in</strong> other projects<br />
that won <strong>EDA</strong> fund<strong>in</strong>g, however. The <strong>RI</strong>EDC/Bulkhead Replacement project was<br />
eleventh out <strong>of</strong> 81 projects proposed <strong>in</strong> <strong>1996</strong>, plac<strong>in</strong>g it <strong>in</strong> the top 20 percent for<br />
that year. Also <strong>in</strong> <strong>1996</strong>, the Providence Heritage Harbor Museum project ranked<br />
thirty-second, only with<strong>in</strong> the top 40 percent.<br />
In 1998, the <strong>RI</strong>EDC/Pier 2 Structural Repairs project was eighth among 36<br />
proposals, plac<strong>in</strong>g it <strong>in</strong> the upper 25 percent for that year. In 1995, the<br />
Providence/PPAC project (the only proposal funded that year) was twenty-third<br />
among 67 proposals, or <strong>in</strong> the upper 35 percent.<br />
The lowest rank<strong>in</strong>g project was the Newport/Halsey Street Industrial Park<br />
Expansion, which was seventeenth among 41 proposals, plac<strong>in</strong>g it only as high<br />
as the top 42 percent for 1997 ((5)). (See Table 1.)<br />
Question 2: On what criteria did the projects score the most po<strong>in</strong>ts?<br />
Some projects received the maximum scores for more than one criterion<br />
<strong>in</strong> the Priority Project Rat<strong>in</strong>g System. Others may have received less than the<br />
maximum scores, but had their high scores (where they received the most<br />
po<strong>in</strong>ts) distributed among two or three criteria. The three criteria giv<strong>in</strong>g most <strong>of</strong><br />
the projects <strong>in</strong> our survey their highest number <strong>of</strong> po<strong>in</strong>ts were jobs, funds, and<br />
<strong>in</strong>come.<br />
8
The jobs criterion score was based on the number <strong>of</strong> long-range jobs<br />
anticipated from the project. Also <strong>in</strong>cluded <strong>in</strong> the score were areas where po<strong>in</strong>ts<br />
were deducted: if the estimate <strong>of</strong> job stimulation was not documented, or if the<br />
applicant <strong>in</strong>dicated that the project would not be <strong>in</strong>itiated with<strong>in</strong> two years.<br />
The fund<strong>in</strong>g criterion measured the f<strong>in</strong>ancial commitment (<strong>in</strong> non-federal<br />
funds, i.e., local, state or private) to the project. It is an <strong>in</strong>dicator <strong>of</strong> the<br />
applicant’s ability to <strong>in</strong>itiate the project <strong>in</strong> a timely manner and the ability <strong>of</strong> the<br />
project to leverage additional <strong>in</strong>vestment. It also awarded additional po<strong>in</strong>ts to<br />
applicants able to commit non-federal funds greater than fifty percent (50%) <strong>of</strong><br />
total project costs.<br />
The <strong>in</strong>come criterion was based on median family <strong>in</strong>come with<strong>in</strong> the host<br />
municipality, favor<strong>in</strong>g those communities with the lowest medians ((6)).<br />
Six projects received high scores under the jobs criterion:<br />
<strong>RI</strong>EDC/Bulkhead Replacement, Newport/Halsey Street Industrial Park<br />
Expansion, Providence/Gorham Site Redevelopment, <strong>RI</strong>EDC/Pier 2 Structural<br />
Repairs, <strong>RI</strong>EDC/C<strong>RI</strong>DCO/Ladd Center, and Cranston/Narragansett Brewery<br />
Redevelopment.<br />
Five projects received high scores under the fund<strong>in</strong>g criterion:<br />
Providence/Heritage Harbor Museum, Newport/Halsey Street Industrial Park<br />
Expansion, Providence/Gorham Site Redevelopment, Cranston/Narragansett<br />
Brewery Redevelopment, and Woonsocket/Stadium Theater Restoration.<br />
Four projects received high scores for the <strong>in</strong>come criterion: Providence/<br />
PPAC, Providence/Heritage Harbor Museum, and Newport/ Halsey Street<br />
Industrial Park Expansion and Providence/Gorham Site Redevelopment. (See<br />
Table 1.)<br />
Question 3: How did the <strong>EDA</strong> funds awarded actually compare with the<br />
amount on the OEDP or CEDS application?<br />
Only one <strong>of</strong> the n<strong>in</strong>e projects <strong>in</strong> this study, Cranston/Narragansett Brewery<br />
Redevelopment, received the exact amount <strong>of</strong> <strong>EDA</strong> fund<strong>in</strong>g proposed <strong>in</strong> its<br />
CEDS or OEDP application. Other projects, with the exception <strong>of</strong><br />
<strong>RI</strong>EDC/C<strong>RI</strong>DCO/Ladd Center and Woonsocket/Stadium Theater Restoration,<br />
received considerably less.<br />
In descend<strong>in</strong>g order, Newport/Halsey Street Industrial Park Expansion,<br />
received 56 percent <strong>of</strong> the amount <strong>in</strong> its OEDP application, Providence/Gorham<br />
Site Redevelopment received 43 percent, and <strong>RI</strong>EDC/Pier 2 Structural Repairs<br />
received 40 percent, followed by Providence/PPAC, Providence/Heritage Harbor<br />
Museum and <strong>RI</strong>EDC/Bulkhead Replacement, each receiv<strong>in</strong>g 33 percent.<br />
9
Table 1<br />
OEDP/CEDS PROJECTS IN RHODE ISLAND FUNDED BY THE <strong>EDA</strong>, <strong>1996</strong>-<strong>2000</strong><br />
Applicant/Project<br />
OEDP/CEDS<br />
Scor<strong>in</strong>g criteria Sources <strong>of</strong> Med. family % state med.<br />
rank w/highest scores non-federal $ <strong>in</strong>come, $* family <strong>in</strong>come<br />
Providence/PPAC #23/67 area/<strong>in</strong>come private 28,342 72.4<br />
Providence/Heritage Harbor Museum #32/81 <strong>in</strong>come/funds state, private 28,342 72.4<br />
<strong>RI</strong>EDC/Bulkhead Replacement #11/81 jobs/env. state 46,736 119.3<br />
Newport/Halsey St. Ind. Park Expansion #17/41 jobs/<strong>in</strong>come/funds private 37,427 95.5<br />
Providence/Gorham Site Redev. #4/41 funds/jobs/<strong>in</strong>come local, private 28,342 72.4<br />
<strong>RI</strong>EDC/Pier 2 Structural Repairs #8/36 jobs/area state 46,736 119.3<br />
<strong>RI</strong>EDC/C<strong>RI</strong>DCO/Ladd Center #2/36 jobs/area state, private 40,853 104.3<br />
Cranston/Narragansett Brewery Redev. #8/30 jobs/funds/env. state, local, private 41,896 106.9<br />
Woonsocket/Stadium Theater Restor. #1/30 funds/env./studies local, private 31,659 80.8<br />
* 1990 Census, collected 1989. <strong>State</strong> median = $39,172<br />
Source: Overall Economic Development Program (OEDP) and Comprehensive Economic<br />
Development Strategy (CEDS) applications
The Ladd Center project was awarded $2,000,000 from the <strong>EDA</strong>, an<br />
<strong>in</strong>crease <strong>of</strong> 67 percent over its OEDP request. Woonsocket’s Stadium Theater<br />
Restoration was awarded $450,000, an <strong>in</strong>crease <strong>of</strong> 29 percent over its CEDS<br />
request. (See Table 2.)<br />
Table 2<br />
<strong>EDA</strong> FUNDS:<br />
COMPA<strong>RI</strong>SON OF OEDP/CEDS APPLICATIONS AND <strong>EDA</strong> GRANT AWARDS<br />
Applicant/Project<br />
<strong>EDA</strong> $, OEDP or<br />
CEDS request<br />
<strong>EDA</strong> $<br />
awarded<br />
Providence/PPAC 3,000,000 1,000,000<br />
Providence/Heritage Harbor<br />
Museum<br />
3,000,000 1,000,000<br />
<strong>RI</strong>EDC/Bulkhead Replacement 2,446,000 800,000<br />
Newport/Halsey St. Ind. Park<br />
Expansion<br />
250,000 140,500<br />
Providence/Gorham Site Redev. 2,000,000 864,900<br />
<strong>RI</strong>EDC/Pier 2 Structural Repairs 2,472,000 1,000,000<br />
<strong>RI</strong>EDC/C<strong>RI</strong>DCO/Ladd Center 1,200,000 2,000,000<br />
Cranston/Narragansett Brewery<br />
Redev.<br />
Woonsocket/Stadium Theater<br />
Restor.<br />
1,000,000 1,000,000<br />
350,000 450,000<br />
Total 15,718,000 8,255,400<br />
Source: Overall Economic Development Program (OEDP) and Comprehensive Economic<br />
Development Strategy (CEDS) applications, 1995-1999, and U.S. Dept. <strong>of</strong> Commerce, Economic<br />
Development Adm<strong>in</strong>istration, <strong>Public</strong> <strong>Works</strong> Division<br />
Question 4: How many projects had a share <strong>of</strong> the match from private<br />
sources?<br />
Seven out <strong>of</strong> the n<strong>in</strong>e projects under study (78 percent) had fund<strong>in</strong>g<br />
committed from private sources. They were Providence/PPAC, Providence/<br />
Heritage Harbor Museum, Newport/Halsey Street Industrial Park Expansion,<br />
Providence/Gorham Site Redevelopment, <strong>RI</strong>EDC/C<strong>RI</strong>DCO/Ladd Center,<br />
11
Cranston/Narragansett Brewery Redevelopment, and Woonsocket/Stadium<br />
Theater. (See Table 1.)<br />
Question 5: Where were the projects located?<br />
The projects under review were located <strong>in</strong> Providence, Cranston, North<br />
K<strong>in</strong>gstown, Exeter, Newport and Woonsocket, and were <strong>in</strong> an Enterprise Zone or<br />
an area <strong>of</strong> low median family <strong>in</strong>come, or with<strong>in</strong> the “built environment” <strong>in</strong> these<br />
communities. (See Table 3.)<br />
Table 3<br />
LOCATION OF <strong>EDA</strong>-FUNDED PROJECTS<br />
Municipality Applicant/Project Location<br />
Providence Providence/PPAC Enterprise Zone, low <strong>in</strong>come, built<br />
environment<br />
Providence Providence/Heritage Harbor Museum Enterprise Zone, low <strong>in</strong>come, built<br />
environment (former power house)<br />
North K<strong>in</strong>gstown <strong>RI</strong>EDC/Bulkhead Replacement Built environment (Quonset<br />
Davisville)<br />
Newport<br />
Newport/Halsey St. Ind. Park<br />
Expansion<br />
Low <strong>in</strong>come, built environment<br />
Providence Providence/Gorham Site Redev. Enterprise Zone, low <strong>in</strong>come, built<br />
environment (former factory site)<br />
North K<strong>in</strong>gstown <strong>RI</strong>EDC/Pier 2 Structural Repairs Built environment (Quonset<br />
Davisville)<br />
Exeter <strong>RI</strong>EDC/C<strong>RI</strong>DCO/Ladd Center Built environment (former Ladd<br />
School site)<br />
Cranston<br />
Cranston/Narragansett Brewery<br />
Redev.<br />
Enterprise Zone, low <strong>in</strong>come, built<br />
environment (former brewery site)<br />
Woonsocket Woonsocket/Stadium Theater Restor. Enterprise Zone, low <strong>in</strong>come, built<br />
environment<br />
Source: OEDP/CEDS applications, 1995-1999<br />
12
Three <strong>of</strong> the funded projects were located <strong>in</strong> Providence:<br />
Providence/PPAC, Providence/Heritage Harbor Museum, and Providence/<br />
Gorham Site Redevelopment.<br />
Two <strong>of</strong> the projects were located <strong>in</strong> North K<strong>in</strong>gstown: <strong>RI</strong>EDC/Bulkhead<br />
Replacement and <strong>RI</strong>EDC/Pier 2 Structural Repairs.<br />
One project each was located <strong>in</strong> Newport (Newport/Halsey Street<br />
Industrial Park Redevelopment), Exeter (<strong>RI</strong>EDC/C<strong>RI</strong>DCO/Ladd Center),<br />
Cranston (Cranston/Narragansett Brewery Redevelopment), and Woonsocket<br />
(Woonsocket/Stadium Theater).<br />
Assessment<br />
The overall project score obta<strong>in</strong>ed from the Priority Project Rat<strong>in</strong>g System<br />
is largely irrelevant <strong>in</strong> predict<strong>in</strong>g which projects will be funded by the <strong>EDA</strong>. While<br />
the score is important <strong>in</strong> determ<strong>in</strong><strong>in</strong>g whether a project will be on the Priority<br />
Project List (it must atta<strong>in</strong> the median score among all project proposals or<br />
better), our survey shows that a project may be funded if it is at the very top <strong>of</strong><br />
the priority list, or if it scores only with<strong>in</strong> the top 40 percent <strong>of</strong> all the projects<br />
submitted.<br />
However, certa<strong>in</strong> scor<strong>in</strong>g criteria used <strong>in</strong> the <strong>Rhode</strong> <strong>Island</strong> CEDS and<br />
OEDP seem important to the <strong>EDA</strong>, as evidenced by high scores under the<br />
follow<strong>in</strong>g criteria be<strong>in</strong>g common to many <strong>of</strong> the projects ga<strong>in</strong><strong>in</strong>g fund<strong>in</strong>g: jobs,<br />
funds, and <strong>in</strong>come.<br />
The amount <strong>of</strong> funds sought from the <strong>EDA</strong> <strong>in</strong> the OEDP and CEDS<br />
applications generally runs significantly higher than what is eventually granted.<br />
With only one exception, <strong>EDA</strong> fund<strong>in</strong>g appeared capped at $1,000,000.<br />
Evidence <strong>of</strong> match<strong>in</strong>g funds drawn at least partly from private sources also<br />
is important to the <strong>EDA</strong>. Only two projects <strong>in</strong> our survey did not have private<br />
sector <strong>in</strong>vestment; both were located at the state-owned Port <strong>of</strong> Davisville, and<br />
the match came solely from the state.<br />
The Priority Project Rat<strong>in</strong>g System’s locational criteria, which are <strong>in</strong>tended<br />
to direct development toward economically distressed areas, seem to select<br />
projects well. All projects <strong>in</strong> our survey were located with<strong>in</strong> the built environment,<br />
much <strong>of</strong> which has suffered from dis<strong>in</strong>vestment as manufactur<strong>in</strong>g and other jobs<br />
moved overseas. Six <strong>of</strong> the n<strong>in</strong>e projects were located <strong>in</strong> areas with low median<br />
family <strong>in</strong>comes relative to the rest <strong>of</strong> the state, five <strong>in</strong> Enterprise Zones, and three<br />
<strong>in</strong> areas designed to be regional centers (Quonset Davisville and Ladd Center).<br />
13
Part Four:<br />
PROJECT PERFORMANCE, ONCE FUNDED AND IMPLEMENTED<br />
After receiv<strong>in</strong>g <strong>EDA</strong> fund<strong>in</strong>g and be<strong>in</strong>g implemented, how well did the<br />
projects <strong>in</strong> our survey perform? The CEDS staff contacted project proponents<br />
and consulted community employment and wage data from the R.I. Department<br />
<strong>of</strong> Labor and Tra<strong>in</strong><strong>in</strong>g (DLT). We needed to know:<br />
• Did community (i.e., municipal) employment figures improve?<br />
• What was the contribution <strong>of</strong> each project?<br />
• How does this compare with figures anticipated from the OEDP and CEDS<br />
applications?<br />
• What was the impact <strong>of</strong> the project on wages?<br />
• Has the project promoted other development?<br />
Answers to these questions along with the trends we observed <strong>in</strong> Part<br />
Three would answer questions about the CEDS itself. Does the program select<br />
projects that reasonably fulfill their job generation goals? Does the program,<br />
through the projects it selects, contribute to a general rise <strong>in</strong> employment and<br />
wage levels? Do these projects perform up to expectations once they are<br />
implemented? Are changes needed <strong>in</strong> the program?<br />
Did community employment figures improve?<br />
What was the contribution <strong>of</strong> each project?<br />
To ga<strong>in</strong> some measure <strong>of</strong> the impact <strong>of</strong> each project on local employment,<br />
the staff compared the number <strong>of</strong> jobs reported by the projects’ proponents to<br />
resident employment data for the correspond<strong>in</strong>g years collected by the DLT.<br />
We tracked changes <strong>in</strong> employment from the year <strong>of</strong> each project’s<br />
fund<strong>in</strong>g (“project <strong>in</strong>ception”) to 2003, presum<strong>in</strong>g that, with adm<strong>in</strong>istrative and<br />
construction schedules, a project would not be completed and would not beg<strong>in</strong><br />
generat<strong>in</strong>g long-term jobs until at least the year follow<strong>in</strong>g fund<strong>in</strong>g ((7)). Under<br />
this assumption, the project that was first <strong>in</strong> our survey chronologically – the<br />
Providence Perform<strong>in</strong>g Arts Center Expansion – would beg<strong>in</strong> hir<strong>in</strong>g <strong>in</strong> 1997; the<br />
last <strong>in</strong> our survey, the Narragansett Brewery Redevelopment and the Stadium<br />
Theater Restoration, would beg<strong>in</strong> <strong>in</strong> 2001.<br />
We found that resident employment grew <strong>in</strong> the host communities from<br />
1997 through 2003. This cont<strong>in</strong>ued an upward trend dat<strong>in</strong>g back at least to<br />
1995. (See Table 4.) Growth directly attributable to the projects ranged from<br />
very modest to significant – eight jobs <strong>in</strong> Woonsocket for one, to more than 400<br />
jobs <strong>in</strong> Cranston for another. In North K<strong>in</strong>gstown, employment from two<br />
14
Table 4<br />
ANNUAL AVERAGE RESIDENT EMPLOYMENT IN HOST COMMUNITIES<br />
Municipality Change from # jobs reported<br />
1995 <strong>1996</strong> 1997 1998 1999 <strong>2000</strong> 2001 2002 2003 project <strong>in</strong>ception from projects<br />
Cranston 34,875 36,238 36,985 37,565 38,483 38,459 38,396 38,802 40,089 1,630 415<br />
Exeter 2,876 3,038 3,<strong>156</strong> 3,109 3,230 3,027 3,038 3,090 3,192 -38 0<br />
N. K<strong>in</strong>gstown 12,808 13,525 14,032 14,278 17,650 13,859 13,826 13,992 14,456 424 246<br />
Newport 10,543 11,214 11,801 11,539 12,<strong>156</strong> 13,250 13,419 13,469 13,990 2,451 0<br />
Providence 64,460 66,804 68,102 67,770 69,067 75,580 75,188 75,575 78,082 11,278 339<br />
Woonsocket 18,583 19,273 19,502 19,698 20,082 19,806 19,716 19,841 20,500 694 8<br />
<strong>State</strong> <strong>of</strong> <strong>RI</strong> 470,985 491,551 503,885 505,132 519,216 520,253 520,337 525,157 542,798 51,247 1,008<br />
Source: <strong>RI</strong>DLT, Annual Average Labor Force Statistics for Sub-state Areas, not seasonally adjusted, http://www.dlt.ri.gov/lmi/laus/town/town.htm
projects <strong>in</strong> the Quonset Davisville <strong>in</strong>dustrial park may have helped <strong>of</strong>fset resident<br />
job losses from 1999 to 2001.<br />
Altogether, the projects we surveyed generated 1,008 direct jobs from<br />
1997, the year the first project would have begun hir<strong>in</strong>g, to 2003, compared to a<br />
statewide growth <strong>in</strong> resident employment <strong>of</strong> 51,247.<br />
Establishment employment<br />
While the projects no doubt employed local residents, the staff<br />
acknowledged that employment opportunities at project sites were not limited to<br />
workers from the host city or town. We concluded that establishment<br />
employment data might give a more accurate impression <strong>of</strong> a project’s economic<br />
impact. The staff exam<strong>in</strong>ed establishment employment data with the same<br />
comparisons and assumptions used for resident employment. The source <strong>of</strong><br />
these data aga<strong>in</strong> was the DLT, although <strong>in</strong> this <strong>in</strong>stance data were available only<br />
through 2002 and <strong>in</strong>cluded only private sector employment. The latter was<br />
presumed not to be a problem, as the jobs reported by the projects’ proponents<br />
were limited to the private sector.<br />
The data show that two communities – Providence and Woonsocket –<br />
registered citywide losses <strong>in</strong> establishment employment at the time the<br />
OEDP/CEDS projects were be<strong>in</strong>g implemented. North K<strong>in</strong>gstown, which<br />
registered losses <strong>in</strong> resident employment from 1999 to 2001, experienced a<br />
growth <strong>in</strong> establishment employment from <strong>1996</strong> through 2002. The two<br />
Davisville projects funded dur<strong>in</strong>g this period contributed 246 jobs to the town’s<br />
total growth, 3,068, or about eight percent. (See Tables 5 and 6.)<br />
<strong>State</strong>wide, establishment employment grew by 23,244 from 1997 to 2002.<br />
The 1,008 jobs contributed by the projects amount to 4.3 percent <strong>of</strong> this total.<br />
How do the actual job generation figures compare with those anticipated<br />
from the OEDP and CEDS applications?<br />
In all but one case the number <strong>of</strong> jobs generated by the projects surveyed<br />
were lower than the OEDP or CEDS estimates. (See Table 6, second page<br />
follow<strong>in</strong>g.) However, <strong>in</strong> spite <strong>of</strong> the grants be<strong>in</strong>g <strong>of</strong>ficially concluded, many <strong>of</strong> the<br />
projects are still <strong>in</strong> various stages <strong>of</strong> development so the results are <strong>in</strong>complete.<br />
For example:<br />
• The Gorham Site Redevelopment is expected to add 140 jobs when the<br />
new Providence YMCA is completed and staffed ((8)).<br />
• Expansion <strong>of</strong> the new Kather<strong>in</strong>e Gibbs School located at the site <strong>of</strong> the<br />
16
Table 5<br />
ANNUAL AVERAGE ESTABLISHMENT EMPLOYMENT IN HOST COMMUNITIES<br />
Municipality Change from # jobs reported<br />
1995 <strong>1996</strong> 1997 1998 1999 <strong>2000</strong> 2001 2002 project <strong>in</strong>ception from projects<br />
Cranston 25,188 25,666 26,710 26,651 27,578 28,343 28,224 28,416 73 415<br />
Exeter 676 727 723 729 757 786 767 836 79 0<br />
N. K<strong>in</strong>gstown 9,093 8,344 8,691 9,435 9,785 9,941 10,362 11,412 2,721 246<br />
Newport 11,657 12,145 12,189 11,975 11,950 12,397 13,084 12,674 699 0<br />
Providence 99,863 99,400 99,227 99,490 99,792 102,111 101,026 97,381 -2,019 339<br />
Woonsocket 13,345 13,588 13,413 13,725 13,290 13,155 13,363 13,254 99 8<br />
<strong>State</strong> <strong>of</strong> <strong>RI</strong> 373,962 374,685 380,835 387,796 395,670 404,720 405,051 404,079 29,394 1,008<br />
Source: <strong>RI</strong>DLT, Annual Average Private Sector Employment by City & Town, A Decade <strong>of</strong> Change <strong>in</strong> <strong>Rhode</strong> <strong>Island</strong>: An Analysis <strong>of</strong> Private<br />
Sector Employment <strong>in</strong> the Ocean <strong>State</strong>, 1992-2002
Table 6<br />
DIRECT EMPLOYMENT GENERATED BY <strong>EDA</strong>-FUNDED PROJECTS, <strong>1996</strong>-<strong>2000</strong><br />
Applicant/Project <strong>EDA</strong> funds # jobs # jobs <strong>EDA</strong> $/job Notes<br />
awarded, $ expected generated<br />
Providence/PPAC 1,000,000 20 127 7,874 56 additional <strong>in</strong>direct/<strong>in</strong>duced jobs confirmed by <strong>in</strong>dependent study<br />
Providence/Heritage Harbor Museum 1,000,000 500 19 52,632 Museum not yet open; jobs adm<strong>in</strong>istrative<br />
<strong>RI</strong>EDC/Bulkhead Replacement 800,000 300 123 6,504 With Pier 2 project, considers total Davisville employment <strong>of</strong> 269<br />
Newport/Halsey St. Ind. Park Expansion 140,500 60 0 N/A No new jobs as result <strong>of</strong> project, but 256 jobs reta<strong>in</strong>ed at park<br />
Providence/Gorham Site Redev. 864,900 2,000 193 4,481 YMCA to be built on site expected to add 140 jobs<br />
<strong>RI</strong>EDC/Pier 2 Structural Repairs 1,000,000 350 123 8,130 With bulkhead project, considers total Davisville employment <strong>of</strong> 269<br />
<strong>RI</strong>EDC/C<strong>RI</strong>DCO/Ladd Center 2,000,000 500 0 N/A 100-105 employees expected at Job Corps site, only tenant so far<br />
Cranston/Narragansett Brewery Redev. 1,000,000 1,000 415 2,410 Further development <strong>of</strong> site anticipated<br />
Woonsocket/Stadium Theater Restor. 450,000 17 8 56,250 One (1) additional job reta<strong>in</strong>ed as result <strong>of</strong> project<br />
Total 8,255,400 4,747 1,008 8,190<br />
All employment figures current to 2003. Jobs expected or generated do not <strong>in</strong>clude <strong>in</strong>direct and <strong>in</strong>duced employment (multiplier effects).<br />
Sources: Kathryn Calnan, Providence Perform<strong>in</strong>g Arts Center; Roberta Bell Hourigan, Heritage Harbor Museum; Nancy Carrott, <strong>RI</strong>EDC; Alan Goodw<strong>in</strong>, City <strong>of</strong> Newport;<br />
Michael Lepore, City <strong>of</strong> Providence; L<strong>in</strong>da Soderberg, <strong>RI</strong> Dept. <strong>of</strong> Labor & Tra<strong>in</strong><strong>in</strong>g; David Maher, City <strong>of</strong> Cranston; Joel Mathews, City <strong>of</strong> Woonsocket
Narragansett Brewery Redevelopment will add adm<strong>in</strong>istrative and<br />
pr<strong>of</strong>essional employment. The school currently accounts for about 25<br />
percent <strong>of</strong> the 415 jobs associated with the redevelopment. That site also<br />
<strong>in</strong>cludes a former trolley barn with renovation and reuse potential,<br />
although to date noth<strong>in</strong>g def<strong>in</strong>ite has been proposed ((9)).<br />
• The Ladd Center’s redevelopment has proceeded as far as the<br />
construction <strong>of</strong> a Jobs Corps tra<strong>in</strong><strong>in</strong>g facility that will support 100 to 105<br />
full-time positions (<strong>in</strong>structors and adm<strong>in</strong>istrative staff), accord<strong>in</strong>g to the<br />
latest estimates. The facility will open <strong>in</strong> the fall <strong>of</strong> 2004 ((10)).<br />
• The Heritage Harbor Museum completed the exterior repairs covered <strong>in</strong><br />
their work program under the grant. The Museum, however, has not yet<br />
opened to the public, though it has sponsored travel<strong>in</strong>g exhibits with<br />
others, such as the Smithsonian Institution. Current employment at the<br />
Museum consists <strong>of</strong> a relatively small crew <strong>of</strong> adm<strong>in</strong>istrative personnel<br />
((11)).<br />
• The Halsey Street Industrial Park Expansion project led to the construction<br />
<strong>of</strong> a new road provid<strong>in</strong>g access to what was essentially a stranded piece<br />
<strong>of</strong> property that the City <strong>of</strong> Newport was, and still is, look<strong>in</strong>g to develop.<br />
The anticipated expansion <strong>of</strong> the <strong>in</strong>dustrial park, the Tradesmen Center,<br />
onto that property did not occur, however, so no new jobs could be<br />
reported to the <strong>EDA</strong>. On the other hand, the project did result <strong>in</strong> improved<br />
highway access for the Tradesmen Center and a re-direct<strong>in</strong>g <strong>of</strong><br />
commercial traffic away from a residential area, arguably ensur<strong>in</strong>g the<br />
survival <strong>of</strong> the Tradesmen Center as an <strong>in</strong>dustrial park and the retention <strong>of</strong><br />
256 jobs there ((12)).<br />
A total <strong>of</strong> $8,255,400 <strong>of</strong> <strong>EDA</strong> fund<strong>in</strong>g was awarded to the n<strong>in</strong>e projects we<br />
reviewed ((13)). Of the 4,747 jobs anticipated <strong>in</strong> the CEDS applications, as <strong>of</strong><br />
2003 the projects had generated only 1,008 jobs. This is an average <strong>of</strong> $8,190<br />
per job ((14)). (See Table 6.)<br />
What was the impact <strong>of</strong> the projects on wages?<br />
Review <strong>of</strong> average private-sector wages <strong>in</strong> <strong>Rhode</strong> <strong>Island</strong> from 1995 to<br />
2002 shows a significant trend upward — from $25,269 to $33,226, an <strong>in</strong>crease<br />
<strong>of</strong> 31.5% ((15)).<br />
To determ<strong>in</strong>e whether the projects had an impact on the statewide all<strong>in</strong>dustry<br />
average from the employment and wages they supported, the staff<br />
identified the affected <strong>in</strong>dustries by Standard Industrial Classification (SIC) code<br />
and tabulated wages reported by the DLT for those codes. It was presumed that<br />
19
the wages generated by the projects were equivalent to the average wages<br />
reported <strong>in</strong> these <strong>in</strong>dustries, ignor<strong>in</strong>g the likelihood that new workers would be<br />
paid start<strong>in</strong>g wages for that <strong>in</strong>dustry. (Those rates were not available.)<br />
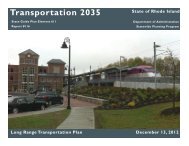
Table 7 shows employment and wages by SIC code over the eight-year<br />
period. These data are plotted <strong>in</strong> Figure 1, second page follow<strong>in</strong>g. The wage<br />
numbers were not adjusted for <strong>in</strong>flation.<br />
The data show that most <strong>of</strong> the SIC categories connected with the projects<br />
paid wages that were lower than the average for private-sector wages <strong>in</strong> <strong>Rhode</strong><br />
<strong>Island</strong> (the “all-<strong>in</strong>dustry” average). Employment derived from the projects might<br />
therefore be expected to depress the all-<strong>in</strong>dustry average, the decrease be<strong>in</strong>g<br />
noticed <strong>in</strong> the sample period.<br />
From 1995 to 2002, however, the all-<strong>in</strong>dustry average tracked consistently<br />
upward, virtually <strong>in</strong> a straight l<strong>in</strong>e, the slope <strong>of</strong> that l<strong>in</strong>e apparently unaffected as<br />
the projects began hir<strong>in</strong>g (Figure 1). This <strong>in</strong>dicated that the overall impact <strong>of</strong><br />
project-generated wages on the all-<strong>in</strong>dustry average wage was negligible,<br />
certa<strong>in</strong>ly never sufficient to cause a decrease <strong>in</strong> that average.<br />
Apparently wages <strong>in</strong> all the affected SIC categories tended upward. Some<br />
<strong>in</strong>dustries showed more dramatic wage growth than others. Some <strong>in</strong>dustries<br />
tracked consistently upward, like the all-<strong>in</strong>dustry average, while others had<br />
<strong>in</strong>stances <strong>of</strong> growth and decl<strong>in</strong>e. The decl<strong>in</strong>es and “flat spots” did not affect the<br />
long-term trend <strong>of</strong> the all-<strong>in</strong>dustry average.<br />
None <strong>of</strong> these trends could be correlated with the <strong>in</strong>ception and<br />
implementation <strong>of</strong> any <strong>of</strong> the n<strong>in</strong>e projects <strong>in</strong> our survey.<br />
Have the projects promoted other development?<br />
Economic multipliers have been ignored to this po<strong>in</strong>t. Practitioners<br />
rout<strong>in</strong>ely use multipliers to determ<strong>in</strong>e the full impact <strong>of</strong> a project on the state’s<br />
economic output, household earn<strong>in</strong>gs and employment. This is one means <strong>of</strong><br />
estimat<strong>in</strong>g the extent to which the project will promote other development.<br />
The multipliers derived from the Department <strong>of</strong> Commerce’s Regional<br />
Input-Output Model<strong>in</strong>g System (<strong>RI</strong>MS) are specific to each state, and to each<br />
<strong>in</strong>dustrial group represented <strong>in</strong> the state. Many <strong>Rhode</strong> <strong>Island</strong> practitioners are<br />
familiar with the <strong>RI</strong>MS model and use it for economic analysis. One set <strong>of</strong> <strong>RI</strong>MS<br />
multipliers can be used to determ<strong>in</strong>e the <strong>in</strong>direct and <strong>in</strong>duced employment<br />
result<strong>in</strong>g from jobs established at a project site (direct effect); another set will<br />
calculate additions to household earn<strong>in</strong>gs and employment from the cost <strong>of</strong> the<br />
project <strong>in</strong> dollars (f<strong>in</strong>al demand) ((16)).<br />
20
Table 7<br />
AVERAGE EMPLOYMENT AND WAGES IN AFFECTED INDUST<strong>RI</strong>ES, 1995-2002<br />
Year SIC code Description Employment Avg. ann. wage Projects funded (w/related SIC)<br />
1995 Total All private sector <strong>in</strong>dustries 373,963 $25,269<br />
17 Special trade contractors 8,490 $28,750<br />
449 Services <strong>in</strong>cidental to water transportation 438 $26,050<br />
59 Miscellaneous retail 13,063 $20,226<br />
792 Theatrical producers, bands… 501 $14,303<br />
824 Vocational schools 315 $20,298<br />
841 Museums and art galleries 438 $13,568<br />
<strong>1996</strong> Total All private sector <strong>in</strong>dustries 374,685 $26,124<br />
17 Special trade contractors 8,750 $29,722<br />
449 Services <strong>in</strong>cidental to water transportation 465 $26,826<br />
59 Miscellaneous retail 13,000 $21,117<br />
792 Theatrical producers, bands… 513 $14,519 Expansion <strong>of</strong> PPAC<br />
824 Vocational schools 321 $22,248<br />
841 Museums and art galleries 444 $13,749<br />
1997 Total All private sector <strong>in</strong>dustries 380,835 $27,473<br />
17 Special trade contractors 9,451 $31,537<br />
449 Services <strong>in</strong>cidental to water transportation 489 $28,221 Bulkhead Replacement<br />
59 Miscellaneous retail 13,507 $21,744<br />
792 Theatrical producers, bands… 568 $15,117<br />
824 Vocational schools 345 $22,270<br />
841 Museums and art galleries 458 $14,461 Heritage Harbor Museum<br />
1998 Total All private sector <strong>in</strong>dustries 387,791 $28,948<br />
17 Special trade contractors 10,238 $32,988 Halsey St. Ind. Park Expansion<br />
449 Services <strong>in</strong>cidental to water transportation 521 $26,891<br />
59 Miscellaneous retail 13,907 $23,329 Gorham Site Redevelopment<br />
824 Vocational schools 343 $24,397<br />
792 Theatrical producers, bands… 574 $16,620<br />
841 Museums and art galleries 487 $14,938<br />
1999 Total All private sector <strong>in</strong>dustries 395,670 $29,902<br />
17 Special trade contractors 11,684 $35,721<br />
449 Services <strong>in</strong>cidental to water transportation 510 $28,025 Pier 2 Structural Repairs<br />
59 Miscellaneous retail 15,118 $24,788<br />
792 Theatrical producers, bands… 673 $15,410<br />
824 Vocational schools 366 $27,016<br />
841 Museums and art galleries 594 $15,849<br />
<strong>2000</strong> Total All private sector <strong>in</strong>dustries 404,720 $31,209<br />
17 Special trade contractors 12,277 $37,934<br />
449 Services <strong>in</strong>cidental to water transportation 567 $27,405<br />
59 Miscellaneous retail 16,041 $30,173 Narragansett Brewery Redev.<br />
792 Theatrical producers, bands… 748 $15,955 Stadium Theater Restoration<br />
824 Vocational schools 387 $29,514 Narragansett Brewery Redev.<br />
841 Museums and art galleries 614 $17,325<br />
2001 Total All private sector <strong>in</strong>dustries 404,970 $32,186<br />
17 Special trade contractors 12,576 $39,180<br />
449 Services <strong>in</strong>cidental to water transportation 597 $29,532<br />
59 Miscellaneous retail 16,488 $28,124<br />
792 Theatrical producers, bands… 764 $16,408<br />
824 Vocational schools 388 $30,144<br />
841 Museums and art galleries 690 $17,122<br />
2002 Total All private sector <strong>in</strong>dustries 404,079 $33,226<br />
17 Special trade contractors 12,591 $39,855<br />
449 Services <strong>in</strong>cidental to water transportation 616 $30,819<br />
59 Miscellaneous retail 16,390 $27,073<br />
792 Theatrical producers, bands… 844 $17,434<br />
824 Vocational schools 358 $30,122<br />
841 Museums and art galleries 652 $18,889<br />
Source: <strong>RI</strong>DLT, Quarterly Census <strong>of</strong> Employment and Wages (ES-202),<br />
http://www.dlt.ri.gov/lmi/es202.sicdata.htm<br />
21
Figure 1<br />
AVERAGE ANNUAL WAGES IN AFFECTED INDUST<strong>RI</strong>ES<br />
$45,000<br />
$40,000<br />
$35,000<br />
Avg. annual wages<br />
$30,000<br />
$25,000<br />
$20,000<br />
$15,000<br />
All <strong>in</strong>dustries<br />
Special trade contractors<br />
Misc. retail<br />
Water transp. services<br />
Theatrical producers<br />
Vocational schools<br />
Museums & art galleries<br />
$10,000<br />
$5,000<br />
$0<br />
1995 <strong>1996</strong> 1997 1998 1999 <strong>2000</strong> 2001 2002<br />
Year<br />
Source: <strong>RI</strong>DLT, http://www.dlt.ri.gov
Multiplier effects: Cumulative impact<br />
The <strong>EDA</strong> has been advised that, overall, the multiplier associated with its<br />
public works projects is about 1.5 ((17)). In other words, for every two direct jobs<br />
created by public works funds another <strong>in</strong>direct or <strong>in</strong>duced job is created. That<br />
would mean that the 1,008 direct jobs generated by <strong>Rhode</strong> <strong>Island</strong> projects<br />
funded from <strong>1996</strong> to <strong>2000</strong> resulted <strong>in</strong> 504 additional (<strong>in</strong>direct or <strong>in</strong>duced) jobs:<br />
1,008 direct jobs x 1.5 = 1,512 total R.I. jobs<br />
1,512 total jobs – 1,008 direct jobs = 504 <strong>in</strong>direct and <strong>in</strong>duced jobs<br />
The qualifier “overall” <strong>in</strong>dicates that this multiplier is a national average.<br />
We concluded that the estimate might understate the impact <strong>in</strong> <strong>Rhode</strong> <strong>Island</strong>. To<br />
test this, we applied the <strong>RI</strong>MS direct-effect employment multipliers to each <strong>of</strong> the<br />
projects the <strong>EDA</strong> funded, identify<strong>in</strong>g their <strong>in</strong>dustrial groups and direct<br />
employment first and then calculat<strong>in</strong>g the total number <strong>of</strong> jobs generated. The<br />
results are shown <strong>in</strong> Table 8. We found that the <strong>EDA</strong>’s estimate compared quite<br />
favorably with our own, which showed the 1,008 direct jobs result<strong>in</strong>g <strong>in</strong> 573<br />
<strong>in</strong>direct and <strong>in</strong>duced jobs, for a total <strong>of</strong> 1,581 <strong>Rhode</strong> <strong>Island</strong> jobs.<br />
These 1,581 jobs are all post-construction. Construction-related<br />
employment was calculated us<strong>in</strong>g the <strong>RI</strong>MS f<strong>in</strong>al-demand multiplier for “new<br />
construction” or “ma<strong>in</strong>tenance and repair construction,” depend<strong>in</strong>g on the project<br />
(see Table 9, second page follow<strong>in</strong>g). We found a total <strong>of</strong> 729 jobs supported as<br />
these n<strong>in</strong>e projects were be<strong>in</strong>g built, for a grand total <strong>of</strong> 2,310 direct, <strong>in</strong>direct and<br />
<strong>in</strong>duced jobs, construction and post-construction.<br />
Multiplier effects: A case study<br />
One local study us<strong>in</strong>g the <strong>RI</strong>MS model exhaustively explored what<br />
ultimately became an OEDP/<strong>EDA</strong> project – the Providence Perform<strong>in</strong>g Arts<br />
Center Expansion. The CEDS staff used it <strong>in</strong> this report to document job<br />
generation from this project.<br />
Renovations to the Perform<strong>in</strong>g Arts Center were deemed necessary to<br />
restore PPAC, the centerpiece <strong>of</strong> Providence’s nascent “Arts District,” and to<br />
draw bus<strong>in</strong>ess and activity to an otherwise depressed downtown area. To keep<br />
the theater vital, the project’s proponents concluded it would need to be<br />
expanded to be able to handle popular Broadway shows such as Miss Saigon<br />
and Phantom <strong>of</strong> the Opera. The Perform<strong>in</strong>g Arts Center commissioned the<br />
Corporate Economics Department <strong>of</strong> Fleet F<strong>in</strong>ancial Group to do an economic<br />
analysis <strong>of</strong> br<strong>in</strong>g<strong>in</strong>g such a show to Providence ((18)).<br />
23
Table 8<br />
EMPLOYMENT MULTIPLIER EFFECTS OF <strong>EDA</strong>-FUNDED PROJECTS, <strong>1996</strong>-<strong>2000</strong><br />
Applicant/Project # direct jobs Industry group Direct-effect Total # jobs<br />
generated empl. Multiplier generated<br />
Providence/PPAC 127 Amusements 1.4410 183<br />
Providence/Heritage Harbor Museum 19 Misc. services 1.5828 30<br />
<strong>RI</strong>EDC/Bulkhead Replacement 123 Transportation 1.7528 216<br />
Newport/Halsey St. Ind. Park Expansion 0 New construction 2.3568 0<br />
Providence/Gorham Site Redev. 193 Retail trade 1.4900 288<br />
<strong>RI</strong>EDC/Pier 2 Structural Repairs 123 Transportation 1.7528 216<br />
<strong>RI</strong>EDC/C<strong>RI</strong>DCO/Ladd Center 0 Bus<strong>in</strong>ess services 1.6785 0<br />
Cranston/Narragansett Brewery Redev. 311 Retail trade 1.4900 463<br />
104 Bus<strong>in</strong>ess services 1.6785 175<br />
Woonsocket/Stadium Theater Restor. 8 Amusements 1.4410 12<br />
Total 1,008 1,581<br />
All employment figures current to 2003.<br />
Source: U.S. Dept. <strong>of</strong> Commerce, Regional Multipliers: A User Handbook for the Regional Input-Output Model<strong>in</strong>g System<br />
(<strong>RI</strong>MS II) (1992)
Table 9<br />
CONSTRUCTION MULTIPLIER EFFECTS OF <strong>EDA</strong>-FUNDED PROJECTS, <strong>1996</strong>-<strong>2000</strong><br />
Applicant/Project <strong>EDA</strong> funds Non-federal Total project Industry group F<strong>in</strong>al-demand Total # jobs<br />
awarded, $ match, $ cost, $ empl. multiplier generated<br />
(per $1,000,000)<br />
Providence/PPAC 1,000,000 1,971,538 2,971,538 New construction 30.1 89<br />
Providence/Heritage Harbor Museum 1,000,000 2,780,000 3,780,000 Ma<strong>in</strong>tenance/repair 31.3 118<br />
<strong>RI</strong>EDC/Bulkhead Replacement 800,000 476,830 1,276,830 Ma<strong>in</strong>tenance/repair 31.3 40<br />
Newport/Halsey St. Ind. Park Expansion 140,500 162,500 303,000 New construction 30.1 9<br />
Providence/Gorham Site Redev. 864,900 834,807 1,699,707 New construction 30.1 51<br />
<strong>RI</strong>EDC/Pier 2 Structural Repairs 1,000,000 1,006,000 2,006,000 Ma<strong>in</strong>tenance/repair 31.3 63<br />
<strong>RI</strong>EDC/C<strong>RI</strong>DCO/Ladd Center 2,000,000 2,800,000 4,800,000 New construction 30.1 144<br />
Cranston/Narragansett Brewery Redev. 1,000,000 1,000,000 1,500,000 New construction 30.1 45<br />
500,000 New construction 30.1 15<br />
Woonsocket/Stadium Theater Restor. 450,000 4,450,000 4,900,000 Ma<strong>in</strong>tenance/repair 31.3 153<br />
Total 8,255,400 15,481,675 23,737,075 729<br />
All employment figures current to 2003.<br />
Source: U.S. Dept. <strong>of</strong> Commerce, Regional Multipliers: A User Handbook for the Regional Input-Output Model<strong>in</strong>g System (<strong>RI</strong>MS II) (1992)
Two studies were performed, <strong>in</strong> 1992 (years before the theater’s<br />
expansion occurred) and <strong>1996</strong>. The first study considered a hypothetical sevenweek<br />
run <strong>of</strong> Phantom. It predicted a total impact <strong>of</strong> $7,641,782 from ticket<br />
revenues, performers’ and patrons’ expenses, and local employment. Accord<strong>in</strong>g<br />
to the multipliers generated by the <strong>RI</strong>MS model, this translates to 312 direct,<br />
<strong>in</strong>direct and <strong>in</strong>duced jobs ((19)).<br />
The second study assessed actual sales and attendance figures when<br />
Phantom played PPAC for six weeks, the number <strong>of</strong> performers <strong>in</strong> the company,<br />
and records <strong>of</strong> spend<strong>in</strong>g by the company. The total impact was $4,493,131<br />
((20)), or 183 direct, <strong>in</strong>direct and <strong>in</strong>duced jobs by the <strong>RI</strong>MS multipliers.<br />
To calculate direct jobs only, the number from the second study was<br />
divided by the <strong>RI</strong>MS direct-effect employment multiplier. The result was 127<br />
jobs. These may be considered new jobs as they result from the stag<strong>in</strong>g <strong>of</strong><br />
Phantom, which would not have been possible without the theater’s expansion.<br />
This compares to the PPAC estimate <strong>in</strong> its <strong>EDA</strong> application <strong>of</strong> 95 jobs reta<strong>in</strong>ed<br />
plus 75 jobs added by the expansion, and the orig<strong>in</strong>al CEDS estimate from the<br />
City <strong>of</strong> Providence <strong>of</strong> 20 jobs “stimulated.” In this one case, the completed<br />
project outperformed the CEDS estimate by more than 600 percent.<br />
Assessment<br />
Project solicitations over the years have attracted different numbers <strong>of</strong><br />
proposals. Dur<strong>in</strong>g the survey period, the range was 30 (<strong>in</strong> 1999) to 81 (<strong>in</strong> <strong>1996</strong>).<br />
Every year, the staff determ<strong>in</strong>ed the median score among the proposals and<br />
used it as a cut<strong>of</strong>f for that year’s priority list. However, as Part Three <strong>of</strong> this<br />
paper shows, the projects that were funded by the <strong>EDA</strong> did not necessarily have<br />
the highest CEDS scores on the list. Moreover, the projects with the highest<br />
CEDS scores did not necessarily turn out to be the highest perform<strong>in</strong>g <strong>in</strong> terms <strong>of</strong><br />
jobs and wages. This is shown on Table 10.<br />
Job generation<br />
The numbers <strong>of</strong> jobs generated from the n<strong>in</strong>e projects <strong>in</strong> our survey were<br />
lower than expected, given the estimates submitted with the OEDP and CEDS<br />
applications. One explanation may be that most <strong>of</strong> the applications – six out <strong>of</strong><br />
the n<strong>in</strong>e – did not back up their job estimates with documentation. At least one<br />
applicant based his estimate on the anticipated floor space the project would<br />
occupy and a correspond<strong>in</strong>g “<strong>in</strong>dustry standard” for the number <strong>of</strong> employees per<br />
square foot. The actual project footpr<strong>in</strong>t turned out smaller than envisioned and<br />
the job estimate exaggerated.<br />
26
Table 10<br />
PROJECT RANKING AND PERFORMANCE<br />
Year <strong>in</strong> OEDP Year <strong>EDA</strong> funded Applicant/Project Scor<strong>in</strong>g rank # direct jobs Avg. ann. wage<br />
or CEDS <strong>in</strong> OEDP/CEDS generated <strong>in</strong> SIC, 2002*<br />
1995 <strong>1996</strong> Providence/PPAC #23/67 projects 127 $17,434<br />
<strong>1996</strong> 1997 Providence/Heritage Harbor Museum #32/81 projects 19 $18,889<br />
<strong>1996</strong> 1997 <strong>RI</strong>EDC/Bulkhead Replacement #11/81 projects 123 $30,819<br />
1997 1998 Newport/Halsey St. Ind. Park Expansion #17/41 projects 0** $39,855<br />
1997 1998 Providence/Gorham Site Redev. #4/41 projects 193 $27,073<br />
1998 1999 <strong>RI</strong>EDC/Pier 2 Structural Repairs #8/36 projects 123 $30,819<br />
1998 1999 <strong>RI</strong>EDC/C<strong>RI</strong>DCO/Ladd Center #2/36 projects 0*** $30,122<br />
1999 <strong>2000</strong> Cranston/Narragansett Brewery Redev. #8/30 projects 311 retail $27,073<br />
104 voc. ed. $30,122<br />
1999 <strong>2000</strong> Woonsocket/Stadium Theater Restor. #1/30 projects 8 $17,434<br />
* Annual all-<strong>in</strong>dustry private sector average, 2002, was $33,226<br />
** No new jobs, but 256 jobs reta<strong>in</strong>ed <strong>in</strong> area<br />
*** 100-105 jobs anticipated at Job Corps Center by fall 2004
However, three <strong>of</strong> the n<strong>in</strong>e projects did provide documentation <strong>in</strong> the form<br />
<strong>of</strong> a study, consultant’s report or master plan. These estimates were arguably<br />
the most reasonable, or best possible, at the time. In such cases it is difficult to<br />
fault the applicants for job estimates that later proved <strong>in</strong>accurate. Also, we<br />
observed that many <strong>of</strong> these projects are still <strong>in</strong> the process <strong>of</strong> be<strong>in</strong>g<br />
implemented (<strong>in</strong> other words, still hir<strong>in</strong>g). Review <strong>of</strong> these projects at a later date<br />
may be worthwhile to see if the anticipated numbers are reached.<br />
While the employment ga<strong>in</strong>s were less than expected, <strong>in</strong> at least one city<br />
they apparently helped cushion significant losses <strong>in</strong> establishment employment.<br />
In Providence, the restoration <strong>of</strong> the Providence Perform<strong>in</strong>g Arts Center, the<br />
establishment <strong>of</strong> the Heritage Harbor Museum and the redevelopment <strong>of</strong> the<br />
Gorham site together added 339 direct jobs from <strong>1996</strong> to 2002. Dur<strong>in</strong>g this<br />
period Providence as a whole lost 2,019 jobs. Without the benefit <strong>of</strong> these<br />
projects, the loss would have been more than 2,350 jobs – about 14 percent<br />
higher – not consider<strong>in</strong>g the additional jobs generated by multiplier effects.<br />
In another city, Cranston, a project contributed enough to establishment<br />
employment to turn a citywide loss <strong>of</strong> jobs <strong>in</strong>to a small ga<strong>in</strong>. The redevelopment<br />
<strong>of</strong> the Narragansett Brewery site added more than 400 direct jobs at a time when<br />
Cranston as a whole ga<strong>in</strong>ed only 73 jobs.<br />
Wages<br />
The n<strong>in</strong>e projects did not seem to affect trends <strong>in</strong> average wages <strong>in</strong> <strong>Rhode</strong><br />
<strong>Island</strong>. In h<strong>in</strong>dsight, negligible impact at so gross a scale as the all-<strong>in</strong>dustry<br />
average is logical, given the projects account for 1,008 jobs and the all-<strong>in</strong>dustry<br />
average was based on more than 404,000 <strong>in</strong> 2002.<br />
The wage question appears to be better handled qualitatively – that is,<br />
whether wages generated by OEDP or CEDS projects fall above or below the all<strong>in</strong>dustry<br />
average. As mentioned above, the jobs stimulated by the projects<br />
funded <strong>in</strong> <strong>Rhode</strong> <strong>Island</strong> from <strong>1996</strong> to <strong>2000</strong> were concentrated <strong>in</strong> SIC codes<br />
typically pay<strong>in</strong>g below that average.<br />
The exception is the project that resulted <strong>in</strong> the extension <strong>of</strong> Halsey Street<br />
<strong>in</strong> Newport. While no new jobs were reported for that project, the exist<strong>in</strong>g jobs at<br />
the Tradesmen’s Center reside <strong>in</strong> an SIC category (special trade contractors)<br />
with wages that were not only consistently higher than the all-<strong>in</strong>dustry average,<br />
but grew at a greater rate from 1995 to 2002. If we presume that the survival <strong>of</strong><br />
the Tradesmen’s Center was attributable to the Halsey Street project, this f<strong>in</strong>d<strong>in</strong>g<br />
is a far more desirable outcome than generat<strong>in</strong>g jobs that pay below the all<strong>in</strong>dustry<br />
average.
In the years subsequent to our survey, the CEDS Subcommittee added a<br />
category to the jobs criterion that awarded po<strong>in</strong>ts for projects that would result <strong>in</strong><br />
wage scales at least 150 percent higher than the state’s m<strong>in</strong>imum wage. A more<br />
str<strong>in</strong>gent standard could be substituted for m<strong>in</strong>imum wage, for example the<br />
<strong>Rhode</strong> <strong>Island</strong> all-<strong>in</strong>dustry average for the most recent year for which data are<br />
available. In 2002, accord<strong>in</strong>g to the DLT, the state’s average wage for covered<br />
employment was $34,781; m<strong>in</strong>imum wage was $12,792.<br />
Promot<strong>in</strong>g other development<br />
The CEDS staff relies on economic multipliers to gauge project impact and<br />
<strong>in</strong> recent years has asked CEDS applicants to consider multiplier effects <strong>in</strong> their<br />
job estimates. A table <strong>of</strong> <strong>RI</strong>MS multipliers is now supplied <strong>in</strong> every application<br />
package so that every project can be compared by the same model.<br />
The job numbers reported <strong>in</strong> this paper are direct employment only,<br />
except where we explicitly state multiplier effects. The sp<strong>in</strong>-<strong>of</strong>f we report<br />
corresponds closely with <strong>EDA</strong>’s catchall public works multiplier, 1.5 – i.e., one<br />
additional job for every two generated directly by the projects. This suggests<br />
satisfactory but average performance <strong>in</strong> promot<strong>in</strong>g other development. In total,<br />
the projects were directly responsible for 1,008 <strong>Rhode</strong> <strong>Island</strong> jobs, plus 573 that<br />
were <strong>in</strong>direct or <strong>in</strong>duced (“other development”). This does not count employment<br />
generation dur<strong>in</strong>g construction, which our numbers show is significant (another<br />
729 jobs).
Part Five:<br />
RECOMMENDED CHANGES IN THE CEDS APPLICATION PROCESS<br />
As part <strong>of</strong> our cont<strong>in</strong>uous plann<strong>in</strong>g process, the CEDS Committee<br />
cont<strong>in</strong>uously ref<strong>in</strong>es and revises the project proposal screen<strong>in</strong>g criteria so that<br />
the projects selected for the Priority List reflect and effectively implement the<br />
state’s economic development objectives as outl<strong>in</strong>ed <strong>in</strong> the CEDS 5 Year Update<br />
and the annual reports.<br />
S<strong>in</strong>ce 1999, the po<strong>in</strong>t-based CEDS Priority Project Rat<strong>in</strong>g System has<br />
been revised to promote smart growth, focus on redevelop<strong>in</strong>g brownfields and<br />
idled <strong>in</strong>dustry facilities, recruit residents <strong>of</strong> Enterprise Zones to the workforce,<br />
and concentrate on areas with low per capita <strong>in</strong>come. The system also gives<br />
credit to projects that use technologies that reduce consumption <strong>of</strong> natural<br />
resources or waste streams, or that locate <strong>in</strong> a national or state historic district or<br />
on a property <strong>in</strong>dividually listed on the national or state historic register. Po<strong>in</strong>ts<br />
will be given if an applicant has contacted the <strong>EDA</strong> and has been <strong>in</strong>vited to<br />
submit a pre-application, or partnered with other eligible applicants.<br />
In addition, the range <strong>of</strong> po<strong>in</strong>t awards has been reduced under the <strong>in</strong>come<br />
criterion, so that credit is only given for per capita <strong>in</strong>come levels with<strong>in</strong> the <strong>EDA</strong>’s<br />
threshold requirements. In recognition <strong>of</strong> the <strong>EDA</strong>’s Investment Policy<br />
Guidel<strong>in</strong>es and our own economic development objectives, po<strong>in</strong>ts are awarded to<br />
projects that result <strong>in</strong> wages well above the state m<strong>in</strong>imum and that build<br />
<strong>in</strong>dustrial clusters.<br />
Applicants are no longer required to assign a priority if they submit more<br />
than one project, and, as a requirement to participate <strong>in</strong> the CEDS, the<br />
community <strong>in</strong> which a project is located now must have an approved<br />
Comprehensive Plan.<br />
The question rema<strong>in</strong>s whether the economic benefit anticipated from<br />
<strong>EDA</strong>-funded projects is obta<strong>in</strong>ed – employment at decent wages <strong>in</strong> economically<br />
distressed areas, with a strong commitment from local <strong>of</strong>ficials and the private<br />
sector – <strong>in</strong> the projects the CEDS selects. We also need to cont<strong>in</strong>ue evaluat<strong>in</strong>g<br />
how well the CEDS process is work<strong>in</strong>g <strong>in</strong> solicit<strong>in</strong>g and select<strong>in</strong>g projects likely to<br />
be funded by the <strong>EDA</strong>.<br />
F<strong>in</strong>d<strong>in</strong>gs: Funded projects<br />
N<strong>in</strong>e projects were funded between <strong>1996</strong> and <strong>2000</strong>, which is about 1.8<br />
projects a year. <strong>Rhode</strong> <strong>Island</strong>’s experience cont<strong>in</strong>ues to be that, <strong>of</strong> the twenty or<br />
more proposals mak<strong>in</strong>g the Priority Project List each year, only two or three at<br />
most are funded. It is unclear if this disappo<strong>in</strong>t<strong>in</strong>g number is due to an <strong>EDA</strong>
fund<strong>in</strong>g allocation formula for the amount <strong>of</strong> money available for <strong>Rhode</strong> <strong>Island</strong>, or<br />
if the projects on the priority list not receiv<strong>in</strong>g fund<strong>in</strong>g fail to address <strong>EDA</strong>’s<br />
Investment Policy Guidel<strong>in</strong>es to <strong>EDA</strong>’s satisfaction, or if there is some other<br />
reason, yet to be determ<strong>in</strong>ed. Only one project <strong>in</strong> our survey received all <strong>of</strong> the<br />
funds orig<strong>in</strong>ally requested; most received considerably less.<br />
Recommendations<br />
1. Determ<strong>in</strong>e, to the extent possible, if there is a conflict between the<br />
<strong>EDA</strong>’s fund<strong>in</strong>g selection criteria and the state’s screen<strong>in</strong>g criteria.<br />
2. Explore chang<strong>in</strong>g the state’s scor<strong>in</strong>g and screen<strong>in</strong>g method from a<br />
numeric, short answer format to one based upon narrative project descriptions as<br />
they relate to the criteria we select for project evaluation.<br />
3. Involve the CEDS Subcommittee <strong>in</strong> the selection <strong>of</strong> projects to be<br />
<strong>in</strong>cluded on the priority list to a greater degree than formerly by hav<strong>in</strong>g the<br />
Subcommittee actually read, compare and evaluate projects pre-selected by staff<br />
and then decide, us<strong>in</strong>g pr<strong>of</strong>essional judgment, which <strong>of</strong> the pre-selected projects<br />
should be submitted to <strong>EDA</strong> as the priority list.<br />
4. Encourage regional partner<strong>in</strong>g <strong>in</strong>itiatives among many applicants to<br />
broaden a project’s scope and quality.<br />
5. Encourage applicants to familiarize themselves with the <strong>EDA</strong>’s<br />
Investment Policy Guidel<strong>in</strong>es before submitt<strong>in</strong>g their applications.<br />
F<strong>in</strong>d<strong>in</strong>gs: Job generation<br />
This study tracked n<strong>in</strong>e projects funded over a five-year period, <strong>1996</strong>-<br />
<strong>2000</strong>. All <strong>of</strong> the projects <strong>in</strong> this study have either created or reta<strong>in</strong>ed jobs but not<br />
to the extent <strong>in</strong>dicated <strong>in</strong> their applications. Some <strong>of</strong> the projects are <strong>in</strong> various<br />
stages <strong>of</strong> development, mak<strong>in</strong>g it difficult to assess their full impacts, especially<br />
<strong>in</strong> the job generation category. Overall, however, the projects have not met the<br />
job generation numbers projected by the applicants.<br />
Recommendations<br />
1. Track the funded projects over a longer period, perhaps 15 years, to<br />
detect impacts that are not evident over a five-year period (too brief?), or do a<br />
follow-up study <strong>of</strong> these n<strong>in</strong>e projects <strong>in</strong> five years.<br />
2. Study the projects on the priority list that did not receive fund<strong>in</strong>g dur<strong>in</strong>g<br />
this five-year study period and determ<strong>in</strong>e whether they have been able to be<br />
completed, and if so, what the employment levels are.
3. Study the projects not mak<strong>in</strong>g the priority list and determ<strong>in</strong>e if they<br />
were completed and what their employment levels are. Compare the results <strong>of</strong><br />
the three studies.<br />
4. Determ<strong>in</strong>e why the applicants are over-estimat<strong>in</strong>g the job generation<br />
numbers and make the necessary adjustments to the CEDS application materials<br />
and requirements.<br />
5. Require applicants to submit applications expect<strong>in</strong>g to generate no<br />
less than 50 jobs.<br />
F<strong>in</strong>d<strong>in</strong>gs: Wages<br />
The jobs stimulated by the projects funded <strong>in</strong> <strong>Rhode</strong> <strong>Island</strong> by the <strong>EDA</strong><br />
typically were concentrated <strong>in</strong> <strong>in</strong>dustries pay<strong>in</strong>g below the all-<strong>in</strong>dustry average.<br />
Recommendations<br />
1. Redef<strong>in</strong>e “well-pay<strong>in</strong>g” jobs by chang<strong>in</strong>g the wage category <strong>in</strong> the jobs<br />
criterion from a m<strong>in</strong>imum wage-based formula to either a state per capita<br />
<strong>in</strong>come-based, or an all-<strong>in</strong>dustry average salary-based, formula.<br />
2. Revise clusters to <strong>in</strong>clude those recommended by the R.I. Economic<br />
Development Corporation provid<strong>in</strong>g high-skill, high-wage jobs, such as health<br />
and life sciences, high-tech progressive manufactur<strong>in</strong>g, creative advertis<strong>in</strong>g and<br />
media, <strong>in</strong>formation technology and telecommunications, build<strong>in</strong>g trades, and<br />
consumer goods.<br />
3. Give applicants additional po<strong>in</strong>ts if the project <strong>in</strong>cludes jobs <strong>in</strong> highskill,<br />
high-wage ($40,000 per year or greater) clusters.<br />
Other f<strong>in</strong>d<strong>in</strong>gs<br />
Although seven <strong>of</strong> the n<strong>in</strong>e funded projects <strong>in</strong> our survey scored high on<br />
the private fund<strong>in</strong>g criterion, this factor did not contribute significantly to the<br />
projects’ ability to generate the promised number <strong>of</strong> jobs pay<strong>in</strong>g good wages. It<br />
probably helped get the projects selected for <strong>EDA</strong> fund<strong>in</strong>g, show<strong>in</strong>g that this<br />
criterion is necessary, but it is <strong>in</strong>sufficient for augment<strong>in</strong>g <strong>Rhode</strong> <strong>Island</strong>’s<br />
economic development efforts as they relate to the CEDS process.
NOTES AND REFERENCES<br />
1. See Appendix A for an explanation <strong>of</strong> the CEDS Priority Project Rat<strong>in</strong>g<br />
System, which sets forth the criteria under which projects are scored.<br />
2. The basic eligibility requirements for the <strong>EDA</strong>’s <strong>Public</strong> <strong>Works</strong> and<br />
Development Facilities Grants are as follows (only one need apply):<br />
(1) An unemployment rate at least one percentage po<strong>in</strong>t greater than<br />
the national average unemployment rate;<br />
(2) Per capita <strong>in</strong>come that is 80 percent or less <strong>of</strong> the national<br />
average per capita <strong>in</strong>come;<br />
(3) A special need, as determ<strong>in</strong>ed by the <strong>EDA</strong>, aris<strong>in</strong>g from actual or<br />
threatened severe unemployment or economic adjustment<br />
problems result<strong>in</strong>g from changes <strong>in</strong> economic conditions such as<br />
a. Substantial outmigration or population loss;<br />
b. Underemployment;<br />
c. Military base closures or realignments, defense contractor<br />
reductions-<strong>in</strong>-force, or Dept. <strong>of</strong> Energy (USDOE) defenserelated<br />
fund<strong>in</strong>g reductions;<br />
d. Natural or other major disasters or emergencies;<br />
e. Extraord<strong>in</strong>ary depletion <strong>of</strong> natural resources;<br />
f. Closure or restructur<strong>in</strong>g <strong>of</strong> <strong>in</strong>dustrial firms, essential to<br />
area economies; or<br />
g. Destructive impacts <strong>of</strong> foreign trade.<br />
<strong>EDA</strong> regulations also allow an area that does not meet any <strong>of</strong> the above<br />
requirements to be eligible for assistance if a substantial direct benefit<br />
(“significant employment opportunities for unemployed, underemployed or<br />
low-<strong>in</strong>come residents”) can be demonstrated to an area that does meet<br />
them.<br />
3. To date, the <strong>Rhode</strong> <strong>Island</strong> CEDS has acknowledged the <strong>EDA</strong>’s eligibility<br />
requirements by favor<strong>in</strong>g, through its scor<strong>in</strong>g criteria, projects located <strong>in</strong><br />
Enterprise Zones (which must meet distress criteria reflect<strong>in</strong>g population<br />
loss, unemployment and dis<strong>in</strong>vestment) and <strong>in</strong> areas with low <strong>in</strong>come.<br />
Projects not meet<strong>in</strong>g these criteria have not been excluded from<br />
participat<strong>in</strong>g <strong>in</strong> the program, however; they have simply achieved lower<br />
scores and may still have qualified for a place on the Priority Project List.<br />
The <strong>EDA</strong>’s eligibility requirements are not to be confused with the<br />
agency’s Investment Policy Guidel<strong>in</strong>es, which speak to partnerships,<br />
cluster development, private sector <strong>in</strong>volvement, and other factors better<br />
termed “enhancements” to the grant rather than thresholds that must be<br />
met first. The CEDS scor<strong>in</strong>g criteria have more correspondence with the
<strong>EDA</strong>’s <strong>in</strong>vestment guidel<strong>in</strong>es than with the eligibility requirements. This<br />
may expla<strong>in</strong> why some high-scor<strong>in</strong>g projects <strong>in</strong> the <strong>Rhode</strong> <strong>Island</strong> CEDS<br />
were later disqualified by the <strong>EDA</strong> for not meet<strong>in</strong>g eligibility requirements.<br />
4. The Ladd Center Infrastructure project was completed but the<br />
development <strong>of</strong> a technology park at the site did not occur as anticipated<br />
<strong>in</strong> both the CEDS and <strong>EDA</strong> applications. However, a Jobs Corps tra<strong>in</strong><strong>in</strong>g<br />
<strong>in</strong>stitute that was to be a tenant <strong>of</strong> the park is under construction there,<br />
consistent with the orig<strong>in</strong>al CEDS proposal, and is expected to open <strong>in</strong> the<br />
summer or fall <strong>of</strong> 2004.<br />
5. The OEDP/CEDS staff did not, and does not provide project scores and<br />
rank<strong>in</strong>gs other than the priority list<strong>in</strong>g to the <strong>EDA</strong>. By ask<strong>in</strong>g this question<br />
we assessed how well our <strong>in</strong>-house selection criteria (the scor<strong>in</strong>g process)<br />
seemed to correspond with the <strong>EDA</strong>’s. “Perfect” correspondence would<br />
result <strong>in</strong> only the top-scor<strong>in</strong>g projects gett<strong>in</strong>g funded (i.e., those at least <strong>in</strong><br />
the top ten percent), presum<strong>in</strong>g all proponents follow up their CEDS<br />
applications with applications to the <strong>EDA</strong>. These results suggest the<br />
correspondence was less than perfect, and variable over the years.<br />
6. The jobs criterion has s<strong>in</strong>ce been revised to add a wage factor. This<br />
considers the average wage <strong>of</strong> the jobs directly supported by the project <strong>in</strong><br />
addition to the number <strong>of</strong> jobs, and how well these wages compare to (i.e.,<br />
exceed) the state’s m<strong>in</strong>imum wage. Projects lead<strong>in</strong>g to direct jobs with<br />
the highest wages are awarded the most po<strong>in</strong>ts, <strong>in</strong> theory promot<strong>in</strong>g a<br />
ga<strong>in</strong> <strong>in</strong> the average <strong>Rhode</strong> <strong>Island</strong> wage, <strong>in</strong>dustry-wide, through the CEDS.<br />
Another revision that occurred <strong>in</strong> the years subsequent to when the<br />
projects <strong>in</strong> our survey were funded changed the <strong>in</strong>come criterion from<br />
median family <strong>in</strong>come to per capita <strong>in</strong>come (PCI), the PCI <strong>of</strong> the U.S.<br />
Census tract <strong>in</strong> which the project is located. The CEDS <strong>in</strong>come criterion<br />
now compares directly to the threshold criterion the <strong>EDA</strong> uses for<br />
screen<strong>in</strong>g applications – an <strong>in</strong>come level equal to 80 percent or less <strong>of</strong> the<br />
national average PCI. In the Priority Project Rat<strong>in</strong>g System, projects<br />
located <strong>in</strong> tracts with the lowest PCIs relative to the national average ga<strong>in</strong><br />
the most po<strong>in</strong>ts. These tracts may be located <strong>in</strong> a municipality that overall<br />
has a median family <strong>in</strong>come higher than the state median. The<br />
neighborhood <strong>in</strong> which the Cranston/Narragansett Brewery<br />
Redevelopment project is located is one example.<br />
7. The number <strong>of</strong> jobs reported was the number <strong>of</strong> new jobs result<strong>in</strong>g from<br />
the projects, and did not <strong>in</strong>clude those generated temporarily dur<strong>in</strong>g<br />
construction or jobs already exist<strong>in</strong>g that were reta<strong>in</strong>ed. Every reference<br />
to “jobs generated” or “employment generated” perta<strong>in</strong>s to new jobs only.
8. Greater Providence Young Men’s Christian Association, “The New<br />
Providence YMCA, the Village <strong>of</strong> Promise on Mashapaug Pond,” 2003<br />
CEDS Submission. The figure is for “year 1” and is based on a YMCA<br />
Operations Team analysis dated March 2003.<br />
9. David Maher and Michael DeLuca, personal communication.<br />
10. L<strong>in</strong>da Soderberg, personal communication.<br />
11. Roberta Bell Hourigan, personal communication.<br />
12. Alan Goodw<strong>in</strong>, personal communication.<br />
13. For the sake <strong>of</strong> comparison, <strong>in</strong> the period June 18-24, 2004, the <strong>EDA</strong><br />
announced $3,660,671 <strong>in</strong> construction grants that were expected to result<br />
<strong>in</strong> 591 new jobs, a cost <strong>of</strong> $6,194 per job. These are anticipated jobs, <strong>of</strong><br />
course, and actual job generation once the projects are completed may be<br />
lower as we found <strong>in</strong> our research.<br />
14. Stephen Grady, personal communication.<br />
15. R.I. Department <strong>of</strong> Labor and Tra<strong>in</strong><strong>in</strong>g, A Decade <strong>of</strong> Change <strong>in</strong> <strong>Rhode</strong><br />
<strong>Island</strong>: An Analysis <strong>of</strong> Private Sector Employment <strong>in</strong> the Ocean <strong>State</strong>,<br />
1992-2002 (available on-l<strong>in</strong>e).<br />
16. U.S. Department <strong>of</strong> Commerce, Economics and Statistics Adm<strong>in</strong>istration,<br />
Bureau <strong>of</strong> Economic Analysis, Regional Multipliers: A User Handbook for<br />
the Regional Input-Output Model<strong>in</strong>g System (<strong>RI</strong>MS II) (Wash<strong>in</strong>gton, DC:<br />
U.S. Government Pr<strong>in</strong>t<strong>in</strong>g Office, 1992). See Appendix B for a sample<br />
calculation <strong>of</strong> multiplier effects.<br />
17. Burchell, Robert W., Naveed A. Shad, and William R. Dolph<strong>in</strong>, <strong>Public</strong><br />
<strong>Works</strong> Program Multipliers and Employment-Generat<strong>in</strong>g Effects, <strong>EDA</strong><br />
Project No. 99-06-07415 (Wash<strong>in</strong>gton, DC: Economic Development<br />
Adm<strong>in</strong>istration, U.S. Department <strong>of</strong> Commerce, 1998).<br />
18. Cim<strong>in</strong>aro, Gary L., Fleet F<strong>in</strong>ancial Group, PPAC Economic Impact<br />
Analysis Estimate (Providence, <strong>RI</strong>: Fleet F<strong>in</strong>ancial Group Corporate<br />
Economics Department, 1992).<br />
19. In the case <strong>of</strong> the Providence Perform<strong>in</strong>g Arts Center, direct jobs would<br />
take <strong>in</strong> employment at the theater and <strong>in</strong> the performance company;<br />
<strong>in</strong>direct jobs would <strong>in</strong>clude employment connected with lodg<strong>in</strong>g and meals<br />
for the performers, suppliers <strong>of</strong> lumber and other materials for the sets,<br />
and pr<strong>in</strong>ters <strong>of</strong> tickets, programs, and advertis<strong>in</strong>g; and <strong>in</strong>duced jobs would<br />
<strong>in</strong>clude wait staff at restaurants cater<strong>in</strong>g to theater patrons, park<strong>in</strong>g lot
attendants, convenience store employees, etc. These are all <strong>in</strong>cluded <strong>in</strong><br />
the 312 jobs calculated us<strong>in</strong>g the <strong>RI</strong>MS multipliers for the <strong>in</strong>dustry group<br />
that <strong>in</strong>cludes theaters and live performances – “hotels and lodg<strong>in</strong>g places<br />
and amusements.”<br />
20. Cim<strong>in</strong>aro, Gary L., <strong>in</strong>dependent economic advisory, May 4, <strong>1996</strong>.
Appendix A:<br />
SUMMARY OF OEDP/CEDS P<strong>RI</strong>O<strong>RI</strong>TY SYSTEM FOR RANKING PROJECTS,<br />
1995-1999<br />
A. Total System - Maximum Po<strong>in</strong>ts 170. (Each project rank<strong>in</strong>g criterion is expla<strong>in</strong>ed <strong>in</strong><br />
detail on second page follow<strong>in</strong>g.)<br />
1. Job Development Po<strong>in</strong>ts: 25 maximum<br />
Long range job stimulation costs per job are:<br />
a. $1-$15,000 25<br />
b. $15,001-$30,000 15<br />
c. $30,001-$45,000 10<br />
d. $45,001-$60,000 5<br />
e. $60,001 or more 0<br />
If estimate <strong>of</strong> long range job stimulation is not backed up by a study<br />
or other documentation -- Deduct 5 po<strong>in</strong>ts<br />
If project will not be <strong>in</strong>itiated with<strong>in</strong> two years -- Deduct 5 po<strong>in</strong>ts<br />
2. Area <strong>of</strong> Influence Po<strong>in</strong>ts: 15 maximum<br />
a. <strong>State</strong>wide 15<br />
b. Regional 10<br />
c. Local only 5<br />
3. Environmental Factors Po<strong>in</strong>ts: 40 maximum<br />
a. Project uses a technology that reduces exist<strong>in</strong>g consumption <strong>of</strong> 15<br />
natural resources and/or reduces exist<strong>in</strong>g waste streams <strong>in</strong> the<br />
production <strong>of</strong> a good or service.<br />
b. Project results <strong>in</strong> rehabilitation <strong>of</strong> brownfield sites or reuse <strong>of</strong> 15<br />
certified mill build<strong>in</strong>gs.<br />
c. Project contributes to meet<strong>in</strong>g a specific environmental objective 10<br />
listed <strong>in</strong> an element <strong>of</strong> the <strong>State</strong> Guide Plan.<br />
d. Project results <strong>in</strong> use and/or revitalization <strong>of</strong> exist<strong>in</strong>g built 10<br />
environment or exist<strong>in</strong>g <strong>in</strong>frastructure other than brownfields and<br />
certified mill build<strong>in</strong>gs.
4. Essential Project Studies and Permits Po<strong>in</strong>ts: 25 maximum<br />
a. All permits obta<strong>in</strong>ed, or confirmation obta<strong>in</strong>ed from regulatory 15<br />
agencies that no permits are required.<br />
b. Essential project studies completed. 10<br />
c. Applicant has applied for but not yet obta<strong>in</strong>ed all necessary 5<br />
permits.<br />
d. Applicant has <strong>in</strong>itiated essential project studies. 5<br />
e. Applicant has not applied for permits. 0<br />
f. Applicant has not <strong>in</strong>itiated essential project studies. 0<br />
5. Commitment <strong>of</strong> Non-Federal Funds Po<strong>in</strong>ts: 20 maximum<br />
a. Non-federal funds committed or appropriated 10<br />
b. Non-federal funds from private <strong>in</strong>vestment 5<br />
c. Non-federal funds exceed fifty percent <strong>of</strong> project costs 5<br />
d. Non-federal funds not yet available 0<br />
6. Employment <strong>of</strong> Substate Employment Growth Area Po<strong>in</strong>ts: 10 maximum<br />
a. Decreases <strong>of</strong> 8.0 percent or more per year 10<br />
b. Decreases <strong>of</strong> 6.0-7.9 percent per year 9<br />
c. Decreases <strong>of</strong> 4.0-5.9 percent per year 8<br />
d. Decreases <strong>of</strong> 2.0-3.9 percent per year 7<br />
e. Decreases <strong>of</strong> 0.1-1.9 percent per year 6<br />
f. No change to <strong>in</strong>crease <strong>of</strong> 1.9 percent per year 5<br />
g. Increases <strong>of</strong> 2.0-3.9 percent per year 4<br />
h. Increases <strong>of</strong> 4.0-5.9 percent per year 3<br />
i. Increases <strong>of</strong> 6.0-7.9 percent per year 2<br />
j. Increases <strong>of</strong> 8.0 percent or more per year 1<br />
7. Labor Surplus Area Po<strong>in</strong>ts: 5 maximum<br />
Project is located <strong>in</strong> a designated labor 5<br />
surplus area
8. Enterprise Zone Po<strong>in</strong>ts: 5 maximum<br />
Project is <strong>in</strong> a state-designated enterprise zone 5<br />
9. Income Po<strong>in</strong>ts: 15 maximum<br />
a. Less than $27,000 15<br />
b. $27,000 - $32,999 12<br />
c. $33,000 - $35,999 9<br />
d. $36,000 - $38,999 6<br />
e. $39,000 and above 3<br />
10. Applicant’s Priority Po<strong>in</strong>ts: 5 maximum<br />
a. Priority rank<strong>in</strong>g number 1 5<br />
b. " " " 2 4<br />
c. " " " 3 3<br />
d. " " " 4 2<br />
e. " " " 5 1<br />
f. " " " 6 or below 0<br />
g. No rank<strong>in</strong>g 0<br />
11. Approved Comprehensive Plan Po<strong>in</strong>ts: 5 maximum<br />
a. Project is located <strong>in</strong> a city or town whose comprehensive plan 5<br />
has received state certification.<br />
b. Project is located <strong>in</strong> a city or town whose comprehensive plan 3<br />
has been submitted for state review but not yet received certification.<br />
c. Project located <strong>in</strong> a city or town that has not yet submitted a 0<br />
comprehensive plan for state review.<br />
B. Explanation <strong>of</strong> Project Rank<strong>in</strong>g Criteria<br />
1. Job Development Costs<br />
The eventual number <strong>of</strong> jobs result<strong>in</strong>g from the implementation <strong>of</strong> a proposal is a<br />
prime consideration <strong>in</strong> priority selection. The figures are used to determ<strong>in</strong>e a cost per<br />
job. Cost refers to total project cost. “Long range” jobs are those expected once a<br />
facility or project beg<strong>in</strong>s operation; do not count construction jobs.<br />
Estimates that are not documented <strong>in</strong> a study will be penalized by a deduction <strong>of</strong> 5<br />
po<strong>in</strong>ts under this criterion. Projects not expected to be <strong>in</strong>itiated with<strong>in</strong> two years will<br />
also <strong>in</strong>cur a 5-po<strong>in</strong>t penalty.
2. Area <strong>of</strong> Influence<br />
This criterion is weighted to favor project proposals hav<strong>in</strong>g the broadest geographic<br />
significance for economic development. It is anticipated that few project proposals will<br />
receive the 15-po<strong>in</strong>t maximum for the category s<strong>in</strong>ce the bulk <strong>of</strong> the proposals will be <strong>of</strong><br />
local orig<strong>in</strong> with a relatively low prospect for any statewide significance. In fact,<br />
probably very few state-sponsored projects will have this wide- rang<strong>in</strong>g effect.<br />
Def<strong>in</strong>itions <strong>of</strong> statewide vs. regional significance follow.<br />
Def<strong>in</strong>itions:<br />
<strong>State</strong>wide — Hav<strong>in</strong>g potential for a more geographically universal effect throughout<br />
the entire state and not predom<strong>in</strong>antly affect<strong>in</strong>g only one or a few contiguous<br />
municipalities.<br />
Regional — Hav<strong>in</strong>g multi-community but not statewide significance.<br />
3. Environmental Factors<br />
The rat<strong>in</strong>g method for this criterion rewards applicants whose projects make use <strong>of</strong><br />
<strong>in</strong>novative technologies, such as alternative energy and “closed loop” <strong>in</strong>dustrial parks,<br />
that use raw materials more efficiently, and that can reduce consumption <strong>of</strong> energy,<br />
water, and other natural resources as well as air and water pollution. Of equal weight<br />
under this criterion are those projects that rehabilitate brownfield sites or lead to the<br />
non-residential reuse <strong>of</strong> certified mill build<strong>in</strong>gs.<br />
Po<strong>in</strong>ts are also awarded for revitaliz<strong>in</strong>g other exist<strong>in</strong>g <strong>in</strong>dustrial or commercial space<br />
and its associated <strong>in</strong>frastructure, and for address<strong>in</strong>g the environmental objectives <strong>of</strong> the<br />
<strong>State</strong> Guide Plan.<br />
If credit is claimed under the “brownfields and mill build<strong>in</strong>gs” category, it cannot also<br />
be claimed under the “built environment” category. The “built environment” category is<br />
<strong>in</strong>tended to reward projects not necessarily associated with the R.I. Department <strong>of</strong><br />
Environmental Management’s brownfields program or the Enterprise Zone Council’s<br />
certified mill build<strong>in</strong>g program, but that follow the same pr<strong>in</strong>ciple <strong>of</strong> reus<strong>in</strong>g or better<br />
utiliz<strong>in</strong>g exist<strong>in</strong>g build<strong>in</strong>gs for <strong>in</strong>dustrial or commercial purposes rather than develop<strong>in</strong>g<br />
greenfield sites.<br />
If credit is sought for fulfill<strong>in</strong>g an environmental objective <strong>in</strong> an element <strong>of</strong> the <strong>State</strong><br />
Guide Plan, the specific element and objective/policy must be cited. Refer to the <strong>State</strong><br />
Guide Plan Overview for a synopsis <strong>of</strong> the various elements <strong>of</strong> the <strong>State</strong> Guide Plan.
4. Essential Project Studies and Permits<br />
This criterion rewards applicants who have obta<strong>in</strong>ed the necessary environmental<br />
permits to <strong>in</strong>itiate the project, or who have confirmed from the relevant regulatory<br />
agencies that no permits are necessary for the project. In addition, this criterion awards<br />
po<strong>in</strong>ts to those projects with applications supported by essential studies, which are<br />
taken to mean plann<strong>in</strong>g, eng<strong>in</strong>eer<strong>in</strong>g, or any other studies prerequisite to<br />
implementation, exclud<strong>in</strong>g environmental assessments. Those projects progress<strong>in</strong>g<br />
reasonably toward completion <strong>of</strong> these studies and obta<strong>in</strong><strong>in</strong>g <strong>of</strong> permits are also<br />
awarded po<strong>in</strong>ts <strong>in</strong> this category.<br />
This system recognizes that any project hav<strong>in</strong>g a negative environmental effect that<br />
cannot be reasonably mitigated will probably be elim<strong>in</strong>ated from consideration under the<br />
<strong>State</strong> Guide Plan conformance threshold review, which is part <strong>of</strong> the CEDS process.<br />
Nevertheless, this threshold review does not constitute the <strong>in</strong>-depth regulatory review<br />
required for the grant<strong>in</strong>g <strong>of</strong> environmental permits.<br />
5. Commitment <strong>of</strong> Non-Federal Funds<br />
This criterion measures the f<strong>in</strong>ancial commitment to the project, the ability to <strong>in</strong>itiate<br />
the project <strong>in</strong> a timely manner and the ability <strong>of</strong> the project to leverage additional<br />
<strong>in</strong>vestment.<br />
6. Employment <strong>of</strong> Substate Employment Growth Area<br />
This non-project related criterion is weighted to favor project proposals <strong>in</strong> areas<br />
which are experienc<strong>in</strong>g the poorest job market performance <strong>in</strong> terms <strong>of</strong> employment by<br />
place <strong>of</strong> work. The source for measur<strong>in</strong>g this criterion is the fourth quarter report on<br />
employment by place <strong>of</strong> work, covered by the <strong>Rhode</strong> <strong>Island</strong> Employment Security Act.<br />
Percentages are figured as an <strong>in</strong>crease or decrease <strong>in</strong> each Substate Employment<br />
Growth Area's percentage change over the previous year's equivalent quarter. <strong>Rhode</strong><br />
<strong>Island</strong>'s eight Substate Employment Growth Areas are based upon specific<br />
socioeconomic, cultural and historic relationships as del<strong>in</strong>eated <strong>in</strong> <strong>State</strong> Guide Plan<br />
Element 212: Industrial Land Use Plan.<br />
7. Labor Surplus Area<br />
This criterion gives priority preference to projects <strong>in</strong> those communities that have<br />
been designated as labor surplus areas by the U.S. Department <strong>of</strong> Labor for the most<br />
current federal fiscal year. Designation is based upon consistently high unemployment<br />
rates and/or other specific “exceptional circumstances.”
8. Enterprise Zones<br />
In keep<strong>in</strong>g with both federal and state policy to direct resources to areas designated<br />
as enterprise zones, this criterion provides preference to those projects specifically<br />
located with<strong>in</strong> an <strong>of</strong>ficially designated <strong>Rhode</strong> <strong>Island</strong> enterprise zone.<br />
9. Income<br />
Median family <strong>in</strong>comes obta<strong>in</strong>ed from the 1990 Census (the most recent available)<br />
are divided <strong>in</strong>to five ranges for the cities and towns. Those municipalities with<strong>in</strong> the<br />
lowest ranges receive the highest po<strong>in</strong>t awards under this criterion.<br />
10. Applicant's Priority<br />
This criterion carries a potential for five bonus po<strong>in</strong>ts and allows local discretion and<br />
expertise to be <strong>in</strong>corporated <strong>in</strong> the statewide priority rank<strong>in</strong>g system by favor<strong>in</strong>g<br />
proposals <strong>of</strong> highest local priority as assigned by each submitt<strong>in</strong>g municipality or other<br />
sponsor. All sponsors are requested to rank their <strong>in</strong>dividual submittals <strong>in</strong> priority order.<br />
11. Approved Comprehensive Plan<br />
This criterion rewards cities and towns whose comprehensive plans (and, if<br />
applicable, updated comprehensive plans) have received approval from the Director <strong>of</strong><br />
the R.I. Department <strong>of</strong> Adm<strong>in</strong>istration with the highest number <strong>of</strong> po<strong>in</strong>ts.
Appendix B:<br />
APPLYING MULTIPLIERS: A SAMPLE CALCULATION<br />
The economic multipliers used <strong>in</strong> the <strong>Rhode</strong> <strong>Island</strong> CEDS to determ<strong>in</strong>e the<br />
full impact <strong>of</strong> projects that are candidates for priority list<strong>in</strong>g come from the<br />
Regional Input-Output Model<strong>in</strong>g System (<strong>RI</strong>MS) developed by the U.S.<br />
Department <strong>of</strong> Commerce. They are <strong>of</strong> two types, “direct effect” and “f<strong>in</strong>al<br />
demand.” The follow<strong>in</strong>g discussion shows how to apply them <strong>in</strong> a hypothetical<br />
situation – the construction <strong>of</strong> a new import/export center <strong>in</strong> the Port <strong>of</strong><br />
Providence.<br />
Accord<strong>in</strong>g to the <strong>RI</strong>MS model, the category “new construction” has a<br />
direct-effect employment multiplier <strong>of</strong> 2.3568, and a f<strong>in</strong>al-demand multiplier <strong>of</strong><br />
30.1 jobs for every million dollars <strong>in</strong>vested. So, every s<strong>in</strong>gle job <strong>in</strong> “new<br />
construction” will yield an additional 1.3568 jobs elsewhere <strong>in</strong> the economy<br />
(<strong>in</strong>direct and <strong>in</strong>duced employment). These are the jobs added by suppliers,<br />
distributors, service providers and other producers to meet the <strong>in</strong>creased<br />
demand result<strong>in</strong>g from the project.<br />
If 84 workers are hired to build the import/export center, the follow<strong>in</strong>g<br />
impact would be expected on jobs throughout the <strong>Rhode</strong> <strong>Island</strong> economy:<br />
84 jobs on site x 2.3568 = 198 total R.I. jobs<br />
These 198 jobs would <strong>in</strong>clude the orig<strong>in</strong>al 84 (direct employment), plus 114<br />
additional jobs <strong>in</strong> other sectors <strong>of</strong> the economy (<strong>in</strong>direct and <strong>in</strong>duced<br />
employment).<br />
If the new center cost $6.3 million to build, the impact on employment<br />
dur<strong>in</strong>g the construction period could be calculated by the f<strong>in</strong>al demand method as<br />
follows:<br />
$6.3 million <strong>in</strong> demand x 30.1 jobs/$1 million = 190 total R.I. jobs<br />
Aga<strong>in</strong>, the 190 jobs would <strong>in</strong>clude direct, <strong>in</strong>direct and <strong>in</strong>duced employment. The<br />
discrepancy between the numbers <strong>of</strong> jobs calculated by the two methods is<br />
<strong>in</strong>significant and probably due to round<strong>in</strong>g.<br />
These jobs would be generated until construction was completed. If<br />
planners wanted to estimate direct, <strong>in</strong>direct and <strong>in</strong>duced employment aris<strong>in</strong>g from<br />
the operation <strong>of</strong> the import/export center, i.e., the post-construction, “long-range”<br />
jobs, they would need to estimate the center’s operat<strong>in</strong>g expenses and then<br />
identify the proper f<strong>in</strong>al-demand multiplier (<strong>in</strong> this case, “bus<strong>in</strong>ess services” at<br />
39.7 jobs per $1 million <strong>in</strong>vested).<br />
B-1
If the operat<strong>in</strong>g expenses amounted to $725,000 <strong>in</strong> the first year <strong>of</strong><br />
operation:<br />
$0.725 million <strong>in</strong> demand x 39.7 jobs/$1 million = 29 total R.I. jobs<br />
These are the direct, <strong>in</strong>direct and <strong>in</strong>duced jobs that would be supported by the<br />
center that year. It is important to note that these jobs are separate from those<br />
dur<strong>in</strong>g the construction phase. To estimate the full economic impact <strong>of</strong> a project,<br />
the jobs generated dur<strong>in</strong>g construction and those com<strong>in</strong>g afterward should be<br />
considered together.<br />
Source: U.S. Department <strong>of</strong> Commerce, Economics and Statistics<br />
Adm<strong>in</strong>istration, Bureau <strong>of</strong> Economic Analysis, Regional Multipliers: A User<br />
Handbook for the Regional Input-Output Model<strong>in</strong>g System (<strong>RI</strong>MS II)<br />
(Wash<strong>in</strong>gton, DC: U.S. Government Pr<strong>in</strong>t<strong>in</strong>g Office, 1992).<br />
B-2