The Differential Cell Count - Carden Jennings Publishing
The Differential Cell Count - Carden Jennings Publishing
The Differential Cell Count - Carden Jennings Publishing

You also want an ePaper? Increase the reach of your titles
YUMPU automatically turns print PDFs into web optimized ePapers that Google loves.
ISLH<br />
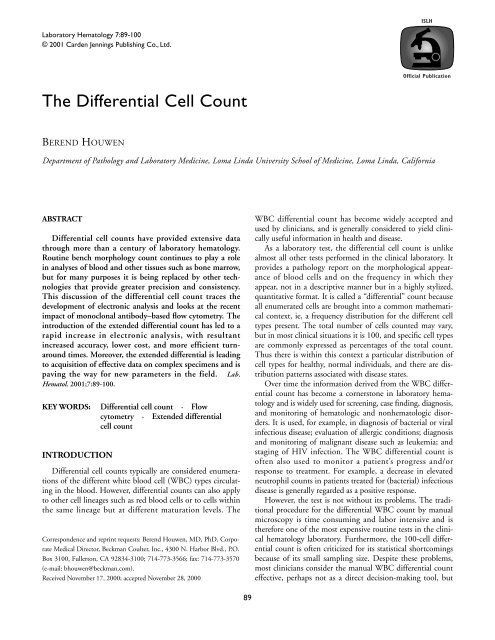
Laboratory Hematology 7:89-100<br />
© 2001 <strong>Carden</strong> <strong>Jennings</strong> <strong>Publishing</strong> Co., Ltd.<br />
Official Publication<br />
<strong>The</strong> <strong>Differential</strong> <strong>Cell</strong> <strong>Count</strong><br />
BEREND HOUWEN<br />
Department of Pathology and Laboratory Medicine, Loma Linda University School of Medicine, Loma Linda, California<br />
ABSTRACT<br />
<strong>Differential</strong> cell counts have provided extensive data<br />
through more than a century of laboratory hematology.<br />
Routine bench morphology count continues to play a role<br />
in analyses of blood and other tissues such as bone marrow,<br />
but for many purposes it is being replaced by other technologies<br />
that provide greater precision and consistency.<br />
This discussion of the differential cell count traces the<br />
development of electronic analysis and looks at the recent<br />
impact of monoclonal antibody–based flow cytometry. <strong>The</strong><br />
introduction of the extended differential count has led to a<br />
rapid increase in electronic analysis, with resultant<br />
increased accuracy, lower cost, and more efficient turnaround<br />
times. Moreover, the extended differential is leading<br />
to acquisition of effective data on complex specimens and is<br />
paving the way for new parameters in the field. Lab.<br />
Hematol. 2001;7:89-100.<br />
KEY WORDS: <strong>Differential</strong> cell count · Flow<br />
cytometry · Extended differential<br />
cell count<br />
INTRODUCTION<br />
<strong>Differential</strong> cell counts typically are considered enumerations<br />
of the different white blood cell (WBC) types circulating<br />
in the blood. However, differential counts can also apply<br />
to other cell lineages such as red blood cells or to cells within<br />
the same lineage but at different maturation levels. <strong>The</strong><br />
Correspondence and reprint requests: Berend Houwen, MD, PhD, Corporate<br />
Medical Director, Beckman Coulter, Inc., 4300 N. Harbor Blvd., P.O.<br />
Box 3100, Fullerton, CA 92834-3100; 714-773-3566; fax: 714-773-3570<br />
(e-mail: bhouwen@beckman.com).<br />
Received November 17, 2000; accepted November 28, 2000<br />
WBC differential count has become widely accepted and<br />
used by clinicians, and is generally considered to yield clinically<br />
useful information in health and disease.<br />
As a laboratory test, the differential cell count is unlike<br />
almost all other tests performed in the clinical laboratory. It<br />
provides a pathology report on the morphological appearance<br />
of blood cells and on the frequency in which they<br />
appear, not in a descriptive manner but in a highly stylized,<br />
quantitative format. It is called a “differential” count because<br />
all enumerated cells are brought into a common mathematical<br />
context, ie, a frequency distribution for the different cell<br />
types present. <strong>The</strong> total number of cells counted may vary,<br />
but in most clinical situations it is 100, and specific cell types<br />
are commonly expressed as percentages of the total count.<br />
Thus there is within this context a particular distribution of<br />
cell types for healthy, normal individuals, and there are distribution<br />
patterns associated with disease states.<br />
Over time the information derived from the WBC differential<br />
count has become a cornerstone in laboratory hematology<br />
and is widely used for screening, case finding, diagnosis,<br />
and monitoring of hematologic and nonhematologic disorders.<br />
It is used, for example, in diagnosis of bacterial or viral<br />
infectious disease; evaluation of allergic conditions; diagnosis<br />
and monitoring of malignant disease such as leukemia; and<br />
staging of HIV infection. <strong>The</strong> WBC differential count is<br />
often also used to monitor a patient’s progress and/or<br />
response to treatment. For example, a decrease in elevated<br />
neutrophil counts in patients treated for (bacterial) infectious<br />
disease is generally regarded as a positive response.<br />
However, the test is not without its problems. <strong>The</strong> traditional<br />
procedure for the differential WBC count by manual<br />
microscopy is time consuming and labor intensive and is<br />
therefore one of the most expensive routine tests in the clinical<br />
hematology laboratory. Furthermore, the 100-cell differential<br />
count is often criticized for its statistical shortcomings<br />
because of its small sampling size. Despite these problems,<br />
most clinicians consider the manual WBC differential count<br />
effective, perhaps not as a direct decision-making tool, but<br />
89
90 B. Houwen<br />
more as a source of collateral information, like taking a<br />
patient’s body temperature. <strong>The</strong> manual differential count<br />
thus shows a combination of poor statistical reliability, high<br />
expense, and definite clinical utility, making it a prime target<br />
for automation and alternate approaches. Those efforts date<br />
back to the 1960s, and to date continue to push the boundaries<br />
of differential cell counting.<br />
Newer technologies have enabled WBC differential<br />
counts to be obtained electronically from automated analyzers,<br />
at much lower cost, with greater statistical reliability,<br />
often with greater overall accuracy, and with faster availability<br />
of results to the clinician. Moreover, these technologies have<br />
enabled laboratorians to measure cellular differentiation and<br />
to quantify cell types other than WBC, with sometimes surprising<br />
clinical utility as outcomes.<br />
THE EVOLUTION OF THE DIFFERENTIAL CELL<br />
COUNT<br />
<strong>The</strong> introduction of aniline dyes in the second half of the<br />
nineteenth century made it possible to study individual<br />
blood cells by microscopy after a small amount of blood had<br />
been placed onto glass slides, dried and fixed, and then<br />
stained. Eosin was the first of these dyes in 1856, followed by<br />
hematoxylin in 1865 and later by the metachromatic<br />
Romanowsky dyes. Amazingly, the practice of manual leukocyte<br />
differential counting essentially has not changed in more<br />
than a century, although a few refinements have been made.<br />
<strong>The</strong>se consist mainly of improvements in dye quality, staining<br />
procedures, and microscopes and automation of slide<br />
preparation and staining.<br />
Image Analysis<br />
Attempts to automate WBC differential counting began in<br />
the 1960s by image analysis using computer-based algorithms<br />
[1,2]. Building automated microscope systems capable of<br />
morphological analysis appeared at the time an attractive<br />
solution for replacing manual differential counting: a consistent<br />
algorithm to replace subjective observer interpretation of<br />
morphology, coupled with automated sample handling to create<br />
a hands off, “walk-away” system. In practice, most image<br />
analysis systems were capable of identifying the majority if<br />
not all blood cells in normal specimens, but failed to do so in<br />
preparations from patients with significant disease. Consequently,<br />
the operator was required to interact with the system<br />
to resolve identification of the remaining, typically difficultto-classify<br />
cells. <strong>The</strong> reality with image analysis systems was<br />
that they were slow, even compared to manual microscopy,<br />
and that they were not truly walk-away systems because of<br />
often poorly executed automation and cell “pattern” recognition<br />
algorithms requiring almost constant operator interaction.<br />
In addition, a number of countries have regulatory<br />
requirements that mandate review of all results before their<br />
release. <strong>The</strong>se factors plus stringent requirements for blood<br />
film preparation and staining, as well as the small number of<br />
cells analyzed and the resultant inherent statistical problems,<br />
have led in most situations to the replacement of image analysis<br />
systems by alternative technologies.<br />
Popularity for image analysis still persists, primarily in<br />
Japan and in certain European countries; but, given the current<br />
sophistication of flow-based analyzers, its role in the<br />
clinical laboratory environment is much reduced. <strong>The</strong> future<br />
development of such systems could become more directed<br />
toward high-quality image capture, storage, and distribution<br />
to other workstations for review.<br />
Flow-Based Analysis Systems<br />
Another altogether different approach to differential<br />
counting was the development of a flow-based system that<br />
could analyze blood cells in suspension [3]. Such a system<br />
requires the use of a combination of a center stream, containing<br />
the sample’s cells, and an outside sheath fluid surrounding<br />
the sample stream. <strong>The</strong> sheath flow narrows the sample<br />
stream and forces the cells into single file, thus enabling passage<br />
of single cells through a sensing zone, optical or otherwise.<br />
<strong>The</strong> next steps were the development of multiparameter<br />
analysis on a cell by combining the signals from several<br />
biosensors, for instance forward and side light scatter, and<br />
the development of fluorescent signals [4] (Figure 1). <strong>The</strong>se<br />
steps led to the development of flow cytometers and later of<br />
fluorescence activated cell sorters (FACS) [5]. <strong>The</strong> earliest<br />
developments in automated flow-based hematology differential<br />
cell counters were based on continuous-flow systems,<br />
where individual samples were separated by air bubbles, similar<br />
to chemistry analyzers then in existence [6]. <strong>The</strong> combination<br />
of continuous flow with sample separation and<br />
enzyme cytochemical treatment of patient samples led to the<br />
first automated 5-cell differential introduced in the mid<br />
1970s [7,8]. Although results showed impressive improvement<br />
in statistical terms over manual WBC differential<br />
counting, it was not practical to operate the analyzer on a<br />
24-hour basis because of prohibitive reagent cost and because<br />
calibration of the continuous flow system proved delicate.<br />
Developments in Automation<br />
Many technological developments have occurred since,<br />
aimed at making differential WBC counting accessible by<br />
automated electronic analysis. <strong>The</strong> primary goal of these<br />
developments has been to provide a differential count of the<br />
5 “normally appearing” WBCs (neutrophils, lymphocytes,<br />
monocytes, eosinophils, and basophils) or, at a minimum, to<br />
provide a screening differential that could eliminate the need<br />
for manual microscopy. In addition to the combination of<br />
continuous flow and enzyme cytochemistry, laboratories<br />
developed systems that analyzed WBC based on light scattering<br />
properties (optical flow systems) or on cell sizing (impedance).<br />
At first these systems yielded partial differential<br />
counts: enumeration of lymphocytes and granulocytes, with
<strong>Differential</strong> <strong>Cell</strong> <strong>Count</strong> 91<br />
FIGURE 1. Schematic drawing of a flow cytometer with detection capability of forward scatter (representing cell volume; laser wavelength);<br />
side scatter (representing cellular contents; laser wavelength); and/or side fluorescence (light emitted by a fluorescent<br />
probe; longer than laser wavelength). Depending on the use of beam splitters (dichroic mirrors) and band filters, emitted light of<br />
different wavelengths can be measured separately. Light sources for flow cytometers are usually lasers, mostly emitting light at<br />
488 nm. Semiconductor lasers, emitting at 633 nm, have recently become used in routine, clinical instruments.<br />
a third population of monocytes, usually mixed in with other<br />
cells [9-11] (Figure 2). Eosinophils and basophils were not enumerated<br />
separately by these systems. <strong>The</strong>se so-called 3-part<br />
differentials were used for screening purposes, typically in<br />
combination with their own flagging systems and review criteria<br />
for selected parameters derived from the blood count.<br />
Such rule-based systems were surprisingly good at predicting<br />
abnormalities in patient specimens requiring manual review<br />
or enumeration (Table 1). In unflagged specimens, the differential<br />
count results would simply consist of the electronic<br />
3-part count, with the inherent assumption that the eosinophil<br />
and basophil count would be normal and therefore should<br />
not require separate reporting. <strong>The</strong> major benefit for the laboratory<br />
was that a significant reduction of 30% to 45% in<br />
manual reviews and differential counts could be obtained<br />
without compromising patient care. <strong>The</strong> results were lower<br />
costs and higher throughput (shorter turn-around times). In<br />
the study cited in Table 1 as well as in other studies, there<br />
was no significant difference in outcome between optical- or<br />
impedance-based systems [12,13].<br />
Development of the 5-<strong>Cell</strong> Method<br />
<strong>The</strong> next development came with further evolution of the<br />
enzyme cytochemical 5-cell method, and with the availability<br />
of other systems capable of 5-cell differentials, using different<br />
forms of analysis and cytochemical treatment [14-20]. <strong>The</strong>se<br />
developments were made possible by the introduction of<br />
reagents that interact with WBC and make these recognizable<br />
on the basis of cell volume and cellular contents. Purely optical<br />
methods and combinations of technologies such as impedance,<br />
radio frequency, and optical sensors have been used for<br />
a variety of analyzers from different manufacturers. For representation<br />
of the data, the histograms used for the mostly singleparameter<br />
3-part differential were largely abandoned and were<br />
replaced by bivariate scatterplots, often in multiple representations<br />
(Figure 3). Over the years major improvements have<br />
been made in the methods that analyze the 5-part differential<br />
multiparameter signals. Adaptable cluster analysis algorithms<br />
have largely displaced the earlier use of fixed discriminators as<br />
boundaries between cell populations. This change was made<br />
possible by huge increases in computing power available at<br />
low cost. <strong>The</strong> development of decision assist systems is seen as<br />
further improvement in the laboratory’s ability to interpret<br />
electronic differential findings.<br />
FIGURE 2. Histogram of a 3-part WBC (white blood cell) differential<br />
with 3 discriminators. <strong>The</strong> first discriminator separates<br />
debris from lymphocytes; the second separates lymphocytes<br />
from a central, mixed-cell population, consisting mostly<br />
of monocytes and eosinophils; and a third discriminator<br />
separates granulocytes from the central population.
92 B. Houwen<br />
TABLE 1. Review Criteria of the 3-Part <strong>Differential</strong> <strong>Cell</strong> <strong>Count</strong>*<br />
Reference Interval<br />
Review Criteria<br />
White blood count, 10 9 /L 4.0-10.0 12.0<br />
Hemoglobin, g/L<br />
Female 120-160 180 g/L<br />
Male 140-180<br />
Mean cell volume, fL 80-100 102 fL<br />
Mean cell hemoglobin concentration, g/L 310-360 360 g/L<br />
Platelets, 10 9 /L 140-440 50<br />
Lymphocytes, % 16-48 48%<br />
Monocytes, % 1-10 15%<br />
Granulocytes, % 35-75 78%<br />
*<strong>The</strong>se review criteria were used to screen for morphological abnormalities<br />
in addition to the analyzer’s own flagging criteria (2194 specimens<br />
tested; 45.6% of specimens were without distributional or morphological<br />
abnormalities). In this study [12], evaluating 3 different instruments, the<br />
false normal rate ranged from 1.5% to 2.1% and the false abnormal rate<br />
ranged from 1.1% to 3.8%. <strong>The</strong> reduction in manual review of blood<br />
specimens using these rules was 30%.<br />
Both 3- and 5-part differential systems are equipped with<br />
flagging algorithms, alerting the user to possible morphological<br />
or other abnormalities that require review of the data or<br />
some other form of intervention such as morphology review.<br />
<strong>The</strong> advantage of 5-part over 3-part systems is a potential for<br />
further reduction in manual review rates. In reality, however,<br />
laboratory adherence to a combination of the 5-part differential,<br />
the analyzer’s own flagging system, and blood count criteria<br />
such as those as set forth in Table 1 often led to an<br />
increased review rate. A more rational approach in analyzers<br />
with a 5-part differential count plus flagging system would<br />
be to discontinue the use of review criteria based on blood<br />
count parameters. Those were developed primarily as a safety<br />
net for 3-part differential systems that generally have rather<br />
primitive differential count flags. Several current electronic<br />
differential counters have flags that are user-adjustable or<br />
that flag at several levels. Thus the user is enabled to adapt<br />
the system to the laboratory’s specific caseloads and needs,<br />
and to decrease further unnecessary morphology reviews.<br />
Extended <strong>Differential</strong> <strong>Count</strong><br />
A logical next step in this evolution is the replacement of<br />
instrument flagging of abnormal cell populations by an actual<br />
count of such cells: the extended differential count (EDC).<br />
<strong>The</strong> EDC includes cell types other than the 5 normally<br />
present in blood (Table 2). A task force, initiated by the<br />
International Society for Laboratory Hematology, with representation<br />
from experts, industry, and regulators, has formulated<br />
an approach that can enable clinical implementation of<br />
the EDC. <strong>The</strong> task force has also made recommendations<br />
that blood cell counts from bone marrow and body fluid<br />
specimens be included in the EDC.<br />
FIGURE 3. Bivariate scattergram of a 5-cell WBC differential<br />
based on an adaptive cluster algorithm. <strong>The</strong>se algorithms have<br />
largely replaced older methods of separating cell populations<br />
by fixed or moving discriminators. This scattergram contains<br />
the following populations: debris; lymphocytes; monocytes;<br />
basophils; neutrophilic granulocytes; and eosinophils. SFL<br />
indicates side fluorescence; SSC, side scatter.<br />
<strong>The</strong> EDC will make immature granulocytes and nucleated<br />
red blood cells an integral part of the electronic differential<br />
and will replace flagging for these frequently observed cell<br />
types. While atypical or variant lymphocytes are also expected<br />
to be part of the EDC, at this moment left shift is not, due to<br />
lack of agreement on the morphology of left-shifted cells.<br />
Other cell types that can be included in the EDC are blast<br />
cells and hematopoietic progenitor cells. Once the EDC is<br />
fully implemented on hematology analyzers, manual review<br />
rates are expected to drop to very low numbers and should be<br />
needed only in highly abnormal specimens, such as those<br />
from patients with hematological malignancies.<br />
An expected problem for EDC is validation of its performance:<br />
many of the cell types represented in the EDC are<br />
often present in blood in low numbers. Yet these low numbers<br />
can constitute the critical decision level which requires<br />
validation of analyzer performance at 1 per 100 WBC or<br />
less. In these situations, it is not possible to use the manual<br />
400-cell reference count for validation because of the enormous<br />
imprecision at such levels (Table 3). Alternative reference<br />
methods, primarily monoclonal antibody based flow<br />
cytometry, will have to be used. 1<br />
Replacement of Morphological Analysis<br />
Although there remains a role for morphological analysis<br />
of blood and other tissues such as bone marrow, for many<br />
1 Manufacturers must validate electronic differential counts by comparison<br />
against a “reference” method or, at minimum, against a predicate device<br />
that was validated earlier; this validation is part of the regulations for use as<br />
a clinical device. Analyzer performance must be equal to or better than the<br />
performance of reference or predicate method, and must be tested in specimens<br />
from normal, healthy individuals as well as in specimens from<br />
patients with diseases.
<strong>Differential</strong> <strong>Cell</strong> <strong>Count</strong> 93<br />
TABLE 2. <strong>Cell</strong> Types Included in the Traditional and the Extended Electronic <strong>Differential</strong> <strong>Count</strong> (Proportional)<br />
Traditional Reference Interval, no. and %* Extended Limit Frequency†<br />
Neutrophils 1.89-5.32 38-68 Left shift Varies NA‡<br />
Lymphocytes 1.39-3.19 22-50 Immature granulocytes >1% 11%<br />
Monocytes 0.30-0.76 5-11.4 Nucleated red blood cells >1% 2%<br />
Eosinophils 0.05-0.35 0.8-5.3 Blasts >1% 0.7%<br />
Basophils 0.01-0.06 0.2-1.0 Atypical lymphocytes >10% 0.3%<br />
Hematopoietic progenitor cells<br />
NA<br />
Other 0.2%<br />
*Based on 328 medical students, male (195) and female (133). Analyzed in the author’s laboratory by Sysmex XE-2100 hematology analyzer (Sysmex<br />
Corp., Kobe, Japan).<br />
†Clinical frequency in patient specimens (n = 24,579) [21].<br />
‡Neither “band” or “stab” cells nor left shifted cells are currently included in the extended differential count, but are included in the neutrophil group.<br />
NA indicates not available.<br />
routine purposes it is gradually being replaced by other<br />
technologies. In most developed countries the traditional<br />
investigation of WBC and red blood cell (RBC) morphology<br />
on a blood film has largely been replaced by some form of<br />
electronic analysis in combination with cytochemical or<br />
enzyme cytochemical treatment of blood cells. Recent developments<br />
in monoclonal antibody–based flow cytometry<br />
have made significant inroads in other areas of traditionally<br />
morphological blood, bone marrow, and lymph node analysis,<br />
particularly for malignancies. <strong>The</strong> degree to which flow<br />
cytometry has replaced morphological analysis varies from<br />
institution to institution, even in a single country, but has<br />
been substantial over the past decade and a half. This trend<br />
has been supported by the development of a wide range of<br />
monoclonal antibodies and an increasingly better understanding<br />
of the cellular physiology of cluster designations<br />
(CDs) and epitopes the antibodies are directed against. Not<br />
only has the diagnostic potential for monoclonal antibodies<br />
grown enormously, but the objectivity of flow-based results<br />
often is preferable over a morphological interpretation colored<br />
by the observer’s own subjectivity. Lastly, the relative<br />
ease of analyzing large numbers of cells gives data obtained<br />
by flow cytometry much greater precision than that<br />
obtained by manual microscopy.<br />
All these factors plus much improved instrumentation<br />
and computer analysis have made flow cytometry a superb<br />
tool for clinical use. Additionally, flow cytometry is capable<br />
of providing information that can offer insights into cellular<br />
physiology, such as cell metabolism, apoptosis and drugresponse,<br />
not available by traditional morphological analysis<br />
[22,23]. Another methodology that is replacing parts of traditional<br />
morphology practices is molecular analysis of tissues<br />
or even of individual cells. Examples include detection of<br />
minimal residual disease, multiple drug resistance detection<br />
by polymerase chain reaction (PCR) and diagnosis of chromosomal<br />
abnormalities in individual cells by fluorescent<br />
in situ hybridization (FISH) techniques [24,25].<br />
As the role for traditional manual microscopy–based<br />
analysis diminishes, electronic cell analysis by hematology<br />
analyzers, flow cytometry using monoclonal antibodies and<br />
other probes and molecular diagnostics will play increasingly<br />
important roles in diagnostic approaches involving blood<br />
cells, whether in blood, bone marrow, or body fluids.<br />
STATISTICAL CONSIDERATIONS<br />
As discussed earlier, low numbers of cells enumerated in a<br />
differential cell count lead to uncertainty about the results<br />
TABLE 3. Statistical Uncertainty of the 100-<strong>Cell</strong> White Blood <strong>Cell</strong> (WBC) <strong>Differential</strong> <strong>Count</strong> and Its Effect on Assumptions of <strong>Cell</strong> Type Distributions*<br />
<strong>Cell</strong> type No.† 100 500 1000 10,000<br />
Basophil 1 0-5.4* 0.3-2.3* 0.5-1.8* 0.8-1.3*<br />
Eosinophil 4 1.1-9.9* 2.5-6.1* 2.9-5.4* 3.6-4.5<br />
Monocyte 9 4.2-16.4* 6.6-11.9* 7.3-10.9 8.4-9.6<br />
Lymphocyte 45 35-55.3* 40.6-49.5 41.9-48.1 44.0-46.0<br />
Neutrophil 60 49.7-69.7* 55.6-64.3 56.9-63.1 59.0-61.0<br />
*Results marked with an asterisk (*) show at least one confidence limit outside reference intervals. (For reference intervals see Table 2.)<br />
†<strong>The</strong> proportional cell counts for the individual WBC types have been chosen arbitrarily, and these do not represent a 100-cell differential.
94 B. Houwen<br />
obtained. Typically, in a manual microscopic WBC differential<br />
count a total of 100 cells are counted. <strong>The</strong>refore, almost<br />
always far fewer than 100 cells are counted for each of the<br />
main 5 WBC categories as present in blood films from normal,<br />
healthy adult individuals (listed in order of decreasing<br />
frequency: neutrophils, lymphocytes, monocytes, eosinophils<br />
and basophils). Although more than 50 of 100 WBC may be<br />
neutrophils in a normal blood film, typically only 1 basophil<br />
per 100 WBC will be found. Imprecision in routine, manual<br />
differential counting is significant, and its wide confidence<br />
limits seriously affect clinical decision-making [26]. Even if<br />
the total number of cells enumerated were doubled or<br />
quadrupled, reproducibility would be just mediocre even for<br />
the most frequently appearing cell types, and still poor for<br />
cells that are less frequently observed. Assuming that the frequency<br />
of a certain cell type (N) remains constant regardless<br />
of how many cells are counted on a blood film, the standard<br />
deviation of its estimate will show stochastic convergence<br />
toward zero based on 1/√N with increasing sample size of N.<br />
However, this calculation requires large numbers of cells to<br />
be counted, far exceeding the potential of even the most<br />
persistent morphologist. <strong>The</strong> statistical uncertainty of the<br />
100-cell WBC differential count and its effect on assumptions<br />
of cell type distribution in a patient sample is shown in<br />
Table 3. <strong>The</strong> 5 WBC categories (with arbitrarily chosen cell<br />
counts for each cell type) and 95% confidence limits are<br />
shown at various total WBC differential counts. <strong>The</strong> cell<br />
counts represent typical levels within the reference interval<br />
for each cell type. When 100 WBC are counted, all cell types<br />
show an upper confidence limit that is outside the reference<br />
interval. Even at 10,000 cells counted, the cell type present<br />
with the lowest frequency (basophils) shows an upper confidence<br />
limit exceeding the reference interval. Such results<br />
would be deemed abnormal and, if no morphological abnormalities<br />
were found, distributionally abnormal. Patients<br />
might therefore be subjected to unnecessary further testing,<br />
driving up health care costs without any benefit to patients.<br />
Similarly, actual distributional abnormalities can easily go<br />
undetected by manual microscopy. Many automated analyzers,<br />
however, count around 8,000 WBC; the model in Table 3<br />
clearly shows the statistical superiority of the electronic cell<br />
count over the manual count. It is unlikely that electronic<br />
WBC differential counts result in significant errors in determining<br />
distributional abnormalities.<br />
A classic study illustrates this point. <strong>The</strong> study involved<br />
73 examiners each performing a 100-cell WBC differential<br />
count on 496 patient specimens with distributional abnormalities<br />
present in 169 specimens (34%). Distributional<br />
abnormalities were “detected” in 1.6% of samples without a<br />
distributional abnormality (false positives), while in 14.1%<br />
of samples with such abnormality present none was found by<br />
the examiners (false negatives) [27]. This is probably one of<br />
the most poignant examples of the limitations of the manual<br />
100-cell differential count.<br />
THE REFERENCE WBC DIFFERENTIAL COUNT<br />
<strong>The</strong> reference WBC differential count was introduced to<br />
enable manufacturers and users to validate automated electronic<br />
WBC differentials [28]. <strong>The</strong> method is used widely<br />
for evaluation of electronic differential cell counts and leads<br />
to satisfactory results for most normal cell types. 2 When the<br />
manual reference method was developed, it was well recognized<br />
that this could have all or at least some of the same<br />
problems as the routine differential count. To contain some<br />
of the imprecision of the routine count, it was decided that<br />
2 independent observers would each count 200 WBC on<br />
2 separately prepared blood films. Instrument results should<br />
not be available to the observers, and their manual results<br />
should be adjudicated (if necessary) by a third independent<br />
observer who has access to all information, including clinical<br />
data. For this purpose the availability of 1 or 2 additional<br />
slides is recommended. Problems are frequently encountered<br />
with the monocyte count, in part due to distributional problems,<br />
in part due to misidentification. <strong>The</strong> process of judgment<br />
allows for resolving discrepancies between observers as<br />
well as between instrument and observers, whether in morphology<br />
or counts, and overcomes issues of sample switching,<br />
clerical errors, and other errors.<br />
Despite these improvements, the method is still too<br />
imprecise to allow method comparison for cell categories<br />
that are present in low frequency, such as basophils. When<br />
applied to cell types with similar or lower frequency, the<br />
method essentially falls apart and alternative methods must<br />
be used. <strong>The</strong>se are not always readily available, however, and<br />
there is a great need for the development and homologation<br />
of such methods, if they are to be made available at all.<br />
Several attempts have been made to develop monoclonal<br />
antibody–based flow cytometry methods for such purposes.<br />
<strong>The</strong> rationale behind this is simple: when cells appear in the<br />
blood in low or very low frequency, the method comparison<br />
becomes in fact rare event analysis. Poisson error will be large<br />
when the sample size is small, and it will be impossible to<br />
judge from side-by-side comparison whether either method<br />
is correct. <strong>The</strong> solution is to increase the sample size, easily<br />
done by using flow cytometry.<br />
Monoclonal antibody–based 5-cell differential counts can<br />
readily and reproducibly be obtained by using CD45, CD14<br />
and CD13 or other antibody combinations [29, 30]. Similar<br />
approaches have been developed for nucleated red blood cells<br />
(NRBC) and reactive immature granulocytes [31-34].<br />
An example of the problems caused by imprecision of the<br />
manual count for low cell counts is shown in Figure 4. <strong>The</strong><br />
purpose of the illustrated investigation was to test low-range<br />
performance of NRBC identification (
<strong>Differential</strong> <strong>Cell</strong> <strong>Count</strong> 95<br />
FIGURE 4. Scatterplots showing the correlation between<br />
instrument NRBC (nucleated red blood cell) enumeration (yaxis),<br />
visual NRBC counts from blood films (A, 400 white<br />
blood cells [WBCs] counted) and flow cytometric NRBC<br />
counts on the same specimens (B, 20,000 events counted).<br />
<strong>The</strong> interval chosen is 0 to 10 NRBC per 100 WBC. Flow<br />
cytometric enumeration resulted in much better correlation<br />
than the visual method due to higher numbers of NRBC<br />
counted and better NRBC identification.<br />
a new hematology analyzer. On 37 blood samples with<br />
known presence of NRBC, the results of the analyzer count<br />
was compared with the results of the manual 400-cell reference<br />
count and with the results of a 20,000-cell flow cytometry<br />
count. It was impossible to decide on the basis of a<br />
manual reference 400-WBC differential count whether the<br />
analyzer was correct or not. However, the results from comparison<br />
with the flow cytometry method clearly showed that<br />
the analyzer gave the correct counts for NRBC.<br />
the area of the blood film suitable for morphological analysis<br />
because part of the blood film will be too thick and part will<br />
be too thin (Figure 5). For a representative count of all cells,<br />
it is necessary to cover the entire width of the examination<br />
area, because WBCs do not distribute evenly over the glass<br />
surface. Large cells such as monocytes and neutrophils are<br />
pushed toward the tail end of the blood film (“feathered<br />
edge”) and to the sides. Thus there can be under-representation<br />
in the differential count if the side areas of the film are<br />
not included in the examination. A battlement track scan<br />
will avoid such problems and at the same time will avoid<br />
repeat analysis of the same cells.<br />
It is important to realize that for all types of blood film<br />
analysis cells, the following issues apply. <strong>The</strong> process by which<br />
the cells are applied to the slide (spreading, smearing, spinning)<br />
may have caused changes in their distribution and<br />
appearance. Second, the cells have been flattened from their<br />
original spherical appearance by air drying. Finally, the cells’<br />
contents have undergone changes because of fixation and subsequent<br />
staining. Thus, the morphological analyses of fixed<br />
and stained blood cells carry a large number of artifacts, and<br />
direct comparison with untreated live cells in suspension may<br />
not always be possible, or is not very good. A typical example<br />
is found in the fragile lymphocytes from patients with chronic<br />
lymphocytic leukemia often damaged beyond recognition by<br />
the methods used to apply blood cells onto the slides.<br />
CELL IDENTIFICATION ISSUES<br />
Manual differential counts are subject to a variety of cell<br />
identification errors, some of which are attributable to the<br />
BLOOD FILM PREPARATION<br />
Guidelines for blood film preparation and staining can be<br />
found in many laboratory and hematology textbooks and<br />
have recently been reviewed [35]. A well prepared and<br />
stained blood film is essential for good-quality morphological<br />
analysis of blood cells. In North America, the most commonly<br />
used method for blood film preparation is wedge-push type<br />
with Wright or Wright-Giemsa staining. May-Grünwald-<br />
Giemsa type staining is more popular in Europe and elsewhere.<br />
For good-quality cell recognition it is necessary to use<br />
FIGURE 5. Schematic example of a blood film: the part closest<br />
to the origin is usually too thick for morphological use, and<br />
the tail end is too thin especially for evaluation of red blood<br />
cell morphology. During a differential leukocyte count it is<br />
paramount that white blood cells be counted only once,<br />
hence the often-used method of a “battlement track,” covering<br />
the entire width of the blood film.
96 B. Houwen<br />
observer’s training level and experience, others to motivation,<br />
fatigue, stress, or level of distraction. Current practices of<br />
cross-training of technologists can also lead to problems,<br />
mainly because of insufficient regular practice of microscopic<br />
analysis. Color blindness can play a role, although this<br />
should not a priory disqualify someone as a morphologist. A<br />
common practice of “skipping” counting cells the observer is<br />
unsure about should be strongly discouraged, as doing so<br />
may lead to ignoring significant morbidity.<br />
It should also be recognized that certain cell types lead to<br />
greater discordance between observers: observers rarely disagree<br />
in eosinophil counts, but quite often disagree about<br />
monocyte or band neutrophil counts. This discrepancy<br />
occurs because morphological criteria can easily be defined<br />
for eosinophils, whereas it can be difficult to distinguish a<br />
small monocyte from a large, granular lymphocyte (NK cell).<br />
Generally the poorest reproducibility and accuracy results are<br />
obtained for counting cells with different maturation levels<br />
within the same lineage. Examples are band and segmented<br />
neutrophils and, to a lesser degree, immature granulocytes:<br />
promyelocytes, myelocytes and metamyelocytes. It has<br />
proven to be very difficult to apply morphological criteria<br />
consistently by multiple observers and even more so across<br />
different institutions or countries. Thus the rather subjective<br />
differentiation of cell types by morphology often leads<br />
to inconsistent results: there is much less chance for inconsistency<br />
when electronic cell analysis, monoclonal antibody–based<br />
flow cytometry, or image analysis algorithms are<br />
applied to WBC populations.<br />
APPLICATIONS OF THE DIFFERENTIAL CELL<br />
COUNT<br />
<strong>The</strong> WBC differential count applies equally to blood,<br />
bone marrow, or body fluids, although cell types may differ<br />
and the presence of various cell types also may be quantitatively<br />
different. In most institutions, clinicians use the proportional<br />
cell count of peripheral blood WBC, despite efforts<br />
that have demonstrated a laboratory preference for a count in<br />
absolute numbers. This reluctance to change is probably<br />
caused by the origins of the WBC differential count: results<br />
obtained on enumeration of 100 WBC on a stained blood<br />
film, without a recalculation to absolute counts.<br />
<strong>The</strong> foundation for the WBC differential count dates<br />
back to the days of Paul Ehrlich and others, more than a century<br />
ago, with the application of aniline dyes to blood cell<br />
preparations, rendering blood cells visible for microscopic<br />
identification [36]. And although some of the WBC differential<br />
count applications may seem antiquated now, and<br />
although reliance by clinicians on its numbers may not<br />
always be fully warranted, there is no denying that the test<br />
can deliver powerful supportive data for clinical information<br />
and decision making. This ambivalence is further underscored<br />
by the morphological uncertainties of the manual,<br />
microscopic differential count. One of the results of a WBC<br />
differential, often reviled by laboratorians but considered by<br />
many clinicians as very valuable is expressed as a “left shift.”<br />
<strong>The</strong> morphological identification of left-shifted cells has<br />
been one of the most inconsistent and controversial aspects<br />
of the manual differential, and therefore is no longer used in<br />
many institutions [37]. Ironically, the term “left shift” finds<br />
its origins in the manual count itself. <strong>The</strong> devices used to<br />
punch in the numbers for the various cell types had the keys<br />
for immature WBC types on the left side of the key board,<br />
hence “left shift” in a blood specimen when immature WBC<br />
were found to be present.<br />
When observing the hematopoietic “tree,” from primitive<br />
stem cell to fully differentiated, functional “end” cells, one<br />
can distinguish the differentiating pathways and can apply a<br />
differential count to the functional end products of the tree’s<br />
branches (Figure 6). For purposes of this discussion, the<br />
terms “differentiation” and “maturation” will be considered<br />
loosely equivalent, and both are used to indicate an ongoing<br />
physiological process of cellular change, either by cell division<br />
plus cellular change, or by a cellular change alone, one<br />
that leads from immature to a mature, functional end cell<br />
stage. A differential count of functional end cells separates<br />
different lineages and can indicate changes in the distribution<br />
of these lineages in a blood or bone marrow sample.<br />
When compared to an established reference interval, this<br />
indication can provide clinically useful information. For<br />
example, increased numbers of eosinophils may be the result<br />
of allergies. Increased numbers of lymphocytes, especially<br />
with atypical or variant morphology, may be associated with<br />
certain viral infections such as infectious mononucleosis.<br />
Other viral infections, for instance those associated with<br />
human immunodeficiency virus (HIV), can result in low<br />
numbers of circulating lymphocytes.<br />
It is important to realize that the differential count is not<br />
restricted to separation of blood cells into different types of<br />
functional end cells (the lineages); it can also give an indication<br />
of the distribution of cells at different levels of maturation<br />
within a single lineage. However, when the differential<br />
count is done by purely morphological identification there<br />
are significant pitfalls. While lineages usually can be easily<br />
differentiated from each other (the “horizontal” differential<br />
count; Figure 6A), it is not so simple to apply stepwise morphological<br />
criteria (ie, segmented neutrophils versus band or<br />
stab cells) onto a biological continuum of differentiation<br />
within a single lineage (the “vertical” differential count; Figure<br />
6B). For this reason, left shift is difficult to quantitate by<br />
morphological means. Proper identification of left shift can<br />
be useful in identifying bacterial infection, especially in<br />
newborns and in the elderly population, but the lack of consensus<br />
about the morphological characteristics of what constitutes<br />
left shift has severely damaged its reputation among<br />
laboratorians [36]. Another form of vertical differential<br />
counting is represented by the identification of even more
<strong>Differential</strong> <strong>Cell</strong> <strong>Count</strong> 97<br />
A<br />
B<br />
C<br />
D<br />
FIGURE 6. <strong>The</strong> hematopoietic “tree,” from primitive stem cell to fully differentiated “end cells.” A, Schematic representation of the<br />
stem cell model for haematopoiesis, in this case the formation of eosinophils. Whereas the pluripotent stem cell has self-renewal<br />
capacity without entering a differentiation pathway (“lineage commitment”), progenitor cells have a limited proliferative potential.<br />
At first, expansion predominates gradually replaced by differentiation without mitotic activity, resulting in mature end cells entering<br />
the circulation. B, Although the exact processes of expansion and differentiation differ per lineage, the basic process remains<br />
the same. Typically, under steady state conditions blood cells are not released from the haematopoietic marrow until mature.<br />
Release of earlier stages points toward accelerated or disordered production. C, Under normal, steady-state conditions the differential<br />
count of cells in the peripheral blood is restricted to mature, functional end cells: the “horizontal” differential of blood cells at<br />
the same level of maturation. D, During accelerated or disordered production of cell types of one or more lineages, immature cells<br />
belonging to that/those lineages may be found in the peripheral blood. <strong>The</strong> enumeration of immature cells in relation to its<br />
mature, functional end product is deemed “vertical” differential count. Although rarely used extensively, normal and pathological<br />
haematopoietic marrow will lend itself by nature to vertical differential counts. <strong>The</strong> vertical differential count of a particular lineage<br />
is a reflection of the dynamics of cell production within that lineage.<br />
immature neutrophils, such as promyelocytes, myelocytes,<br />
and metamyelocytes. This can lead to difficulties among<br />
these specific cell types themselves, but as a group (“immature<br />
granulocytes”) they are sufficiently different in morphology<br />
that they can be separated from mature neutrophils and<br />
band forms (Figure 6C).<br />
Recently, several efforts have been made to analyze bone<br />
marrow by hematology blood cell analyzers. One application<br />
is to determine more effectively the myeloid to erythroid<br />
ratio (M:E). Others include blast cell counts and<br />
myeloid differentiation patterns [38,39]. New technological<br />
developments have made it possible to study maturation
98 B. Houwen<br />
FIGURE 7. Bivariate plot showing the number of reticulocytes<br />
in relation to the “vertical” differential, in this case the immature<br />
reticulocyte fraction (IRF). <strong>The</strong> data are represented on<br />
a log/log scale for easier interpretation and contain reference<br />
intervals for the reticulocyte count and IRF. <strong>The</strong> resulting<br />
division of the scatterplot into 6 quadrants means that the<br />
central quadrant represents normal values for both reticulocyte<br />
count and IRF. <strong>The</strong> data were obtained from a patient<br />
undergoing autologous marrow reinfusion and represents the<br />
patient’s course during 25 days from initiation of treatment<br />
to full recovery. <strong>The</strong> first noticeable effect from high-dose<br />
myeloablative therapy was a drop in IRF, not reticulocytes,<br />
indicating a severe reduction in marrow erythroid proliferation.<br />
Reticulocytes continued to mature without mitosis<br />
from the remaining reservoir of red blood cell precursors<br />
until depleted (day 2). After a period of bone marrow suppression<br />
where both parameters are suppressed, recovery is<br />
indicated by (first) a rise in IRF, followed almost 10 days later<br />
by a return of the reticulocyte count to normal. <strong>The</strong> vertical<br />
differential of peripheral blood cells (reticulocytes), in this<br />
case IRF, can thus reflect events in the hematopoietic marrow<br />
relating to cell production in the erythroid lineage. It is<br />
important to note that in situations such as this changes in<br />
IRF precede those in actual reticulocyte counts.<br />
patterns in the erythroid series as well [40-41]. With the<br />
introduction of the EDC in the clinical laboratory it is<br />
expected that electronic analysis of bone marrow and body<br />
fluid specimens will rapidly increase and will replace to a<br />
major extent manual microscopy.<br />
Vertical differential counting might become an important<br />
tool in assessing maturation and differentiation processes in<br />
the hematopoietic marrow. One of the roles of vertical differential<br />
counting can be viewed as similar to that of the immature<br />
reticulocyte fraction (IRF). <strong>The</strong> IRF expresses the number<br />
of the most immature reticulocytes as a proportion of all<br />
reticulocytes, themselves immature red blood cells. While it is<br />
well established that reticulocyte counts represent the production<br />
rate of RBC (erythropoiesis), to many the exact role of<br />
IRF has not been as clearly defined. Based on the kinetic relationship<br />
between changes in IRF and reticulocyte counts it is<br />
evident that the IRF is dissimilar from the reticulocyte count:<br />
changes often do not occur at the same time or on the same<br />
scale. This fact is illustrated in a patient receiving an autologous<br />
bone marrow reinfusion as part of cancer treatment (Figure<br />
7). After the patient receives the cytotoxic conditioning<br />
regimen, the IRF values drop to below normal before the<br />
reticulocyte counts become below normal. Conversely, as<br />
engraftment takes place the IRF increases to normal before<br />
the reticulocyte counts respond. When such changes and relationships<br />
between parameters are applied to generally accepted<br />
interpretations of what governs a production process, it is<br />
clear that the reticulocyte count represents the first derivative<br />
of erythropoiesis, ie, the RBC production rate. Changes in<br />
the IRF thus reflect the rate of change in the RBC production<br />
rate, ie, the second derivative of the production process.<br />
Greater immaturity indicates an increase in RBC production<br />
rates and less immaturity a decrease. Similarly, left shifted<br />
neutrophils indicate an increase in the neutrophil production<br />
rate, typically caused by infection or by administration of<br />
hematopoietic growth factors such as G- or GM-CSF.<br />
When expressed appropriately, ie, as the proportion of<br />
immature cells within any specific lineage, the vertical differential<br />
ratio can thus become an indication of the second<br />
derivative of the production process for that lineage: the rate<br />
of change in its production rate. Second derivative measurements<br />
are important because changes occur in advance of<br />
changes in the actual bone marrow output, ie, the specific<br />
cell counts themselves, and in the case of IRF have a strong<br />
predictive value [42,43]. It is exciting that such measurements<br />
may become available for myeloid and other lineages,<br />
although they are certainly not yet mainstream.<br />
Vertical differential counting for the erythroid and<br />
myeloid lineage will likely become routinely possible on<br />
hematology analyzers, and the challenge is going to be incorporating<br />
such parameters into the laboratory and particularly<br />
making these accessible and useful to clinicians.<br />
CONCLUSIONS<br />
Electronic cell identification and enumeration has reached<br />
a point of sophistication that often matches or surpasses that<br />
of the routine bench morphology count. WBC differential<br />
counts obtained electronically have much greater precision<br />
than their manual counterparts, and their accuracy is mostly<br />
equal or better. Both cost and turn-around times are lower<br />
for electronic differentials. <strong>The</strong> extended differential will<br />
enable laboratories to perform counts on complex specimens,<br />
including bone marrow and body fluid samples. Manual
<strong>Differential</strong> <strong>Cell</strong> <strong>Count</strong> 99<br />
review is likely to become greatly reduced, and new parameters<br />
may emerge. <strong>The</strong>se could include methods to measure<br />
the kinetics of hematopoiesis without ever doing a bone marrow<br />
aspirate or biopsy.<br />
Compared to that obtained by electronic differential<br />
counts, relatively little information is obtained by routine<br />
morphological analysis of blood cell populations and their<br />
precursors. Although manual, optical (morphological) WBC<br />
differential counting has been the mainstay for the analysis<br />
of WBC subpopulations for much of the twentieth century,<br />
it has become clear that the limitations posed by morphological<br />
analysis of Romanowsky stained blood films are impacting<br />
its potential for clinical use.<br />
ACKNOWLEDGMENT<br />
This article is in large part based on a paper written by the<br />
author for the International Council for Standardization in<br />
Haematology.<br />
REFERENCES<br />
1. Mahouy G, Lund PR, Chinn S, Barnes RD. <strong>The</strong> use of automated<br />
image analysis in differential white cell counting. Scand J Haematol.<br />
1973;10:315-318.<br />
2. Mui JK, Fu KS, Bacus JW. Automated classification of blood cell<br />
neutrophils. J Histochem Cytochem. 1977;25:633-640.<br />
3. Crossland-Taylor PJ. A device for counting small particles suspended<br />
in fluid through a tube. Nature. 1953;171:37.<br />
4. Kamentsky LA, Melamed MR, Derman H. Spectrophotometer: a new<br />
instrument for ultrarapid cell analysis. Science. 1965;150: 630-631.<br />
5. Bonner WA, Hulett HR, Sweet RG, et al. Fluorescence activated<br />
cell sorter. Rev Sci Instrum. 1972;43:404-409.<br />
6. Skeggs LT. An automatic method for colorimetric analysis. Am J<br />
Clin Pathol. 1957;28:311.<br />
7. Saunders AM. Development of automation of differential leukocyte<br />
counts by the use of cytochemistry. Clin Chem. 1972;18:783-788.<br />
8. Mansberg HP, Saunders AM, Groner W. <strong>The</strong> Hemalog-D white<br />
cell differential system. J Histochem Cytochem. 1974;22:711-724.<br />
9. Johnston CL. Leukocyte screening using the ELT-800WS. Blood<br />
<strong>Cell</strong>s. 1985;11:241-255.<br />
10. Cox CJ, Habermann TM, Payne BA, Klee GG, Pierre RV. Evaluation<br />
of the Coulter counter model S-Plus IV. Am J Clin Pathol.<br />
1985;84:297-306.<br />
11. Burgi W, Marti HR. Automated blood count analysis by trimodal<br />
size distribution with the Sysmex E-5000. J Clin Chem Clin<br />
Biochem. 1989;27:365-368.<br />
12. Houwen B, Tisdall PA, Croucher B, McDonald MJ, Fettes G,<br />
Pinto A. Automated histogram differential analysis: a comparison<br />
of 3 instruments and strategies for clinical implementation. Sysmex<br />
J. 1985;8:14-21.<br />
13. Pierre RV. Leukocyte differential counting. In: Koepke JA, ed.<br />
Practical Laboratory Hematology. New York, NY: Churchill Livingstone;<br />
1991:131.<br />
14. Cornbleet PJ, Myrick D, Levy R. Evaluation of the Coulter STKS<br />
five-part differential. Am J Clin Pathol. 1993;99:72-81.<br />
15. Kessler C, Sheridan B, Charles C, et al. Performance of the Coulter<br />
Gen•S System’s white cell differential on an abnormal specimen<br />
data set. Lab Hematol. 1997;3:32-40.<br />
16. Brigden ML, Page NE, Graydon C. Evaluation of the Sysmex<br />
NE-8000 automated hematology analyzer in a high-volume outpatient<br />
laboratory. Am J Clin Pathol. 1993;100:618-625.<br />
17. Houwen B, Mast BJ, Lebeck LK, Chang L, Hull B. Performance<br />
evaluation of the Sysmex SE-9000 hematology workstation. Sysmex<br />
J Int. 1994;4:5-18.<br />
18. Fournier M, Gireau A, Chretien MC, et al. Laboratory evaluation<br />
of the Abbott <strong>Cell</strong> DYN 3500 5-part differential. Am J Clin<br />
Pathol. 1996;105:286-292.<br />
19. Jones RG, Faust A, Glazier J, Matthews R, Potter B. <strong>Cell</strong>-DYN<br />
4000: utility within the core laboratory structure and preliminary<br />
comparison of its expanded differential with the 400-cell manual<br />
differential count. Lab Hematol. 1998;4:34-44.<br />
20. Corberand JX, Segonds C, Fontanilles AM, Cambus JP, Fillola G,<br />
Laharrague P. Evaluation of the Vega haematology analyzer in a<br />
university hospital setting. Clin Lab Haematol. 1999;21:3-10.<br />
21. Konno T, Kanda T. <strong>The</strong> total hematology system based on laboratory<br />
information system and quick turn around time. Sysmex J Int.<br />
1996;6:113-119.<br />
22. Selleri C, Maciejewski JP. <strong>The</strong> role of FAS-mediated apoptosis in<br />
chronic myelogenous leukemia. Leuk Lymphoma. 2000;37:283-297.<br />
23. Garrido SM, Willman C, Appelbaum FR, Banker DE. Threecolor<br />
versus four-color multiparameter cell cycle analyses of<br />
primary acute myeloid leukemia samples. Cytometry.<br />
2000;42:83-94.<br />
24. Kobayashi H, Takemura Y, Kawai Y, et al. Competitive reverse<br />
transcription-polymerase chain reaction assay for quantification of<br />
human multidrug resistance 1 (MDR 1) gene expression in fresh<br />
leukemic cells. J Lab Clin Med. 2000;135:199-209.<br />
25. Seong CM, Giralt S, Kantarjan H, et al. Early detection of relapse<br />
by hypermetaphase in situ hybridization after allogeneic bone<br />
marrow transplantation for chronic myeloid leukemia. J Clin<br />
Oncol. 2000;18:1831-1836.<br />
26. Rümke CL. <strong>The</strong> imprecision of the ratio of two percentages<br />
observed in differential white blood cell counts. Blood <strong>Cell</strong>s.<br />
1985;11:137-140.<br />
27. Koepke JA, Dotson MA, Shifman MA. A critical evaluation of the<br />
manual/visual differential leukocyte counting method. Blood <strong>Cell</strong>s.<br />
1985;11:173-186.<br />
28. Reference Leukocyte <strong>Differential</strong> <strong>Count</strong> (Proportional) and Evaluation<br />
of Instrument Methods. Approved Standard. NCCLS document<br />
H20-A. Villanova, Pa; 1992.<br />
29. Lebeck LK, Mast BJ, Houwen B. Flow cytometric white blood cell<br />
differential: A proposed alternate reference method. Sysm J Int.<br />
1993;3:61-69.<br />
30. Hubl W, Wolfbauer G, Andert S, et al. Toward a new reference<br />
method for the leukocyte five-part differential. Cytometry.<br />
1997;30:72-84.<br />
31. Tsuji T, Sakata T, Hamaguchi Y, Wang F-s, Houwen B. A new
100 B. Houwen<br />
rapid flow cytometric method for the enumeration of nucleated<br />
red blood cells. Cytometry. 1999;37:291-301.<br />
32. Paterakis G, Kossivas L, Kendall R, Anagnostopoulos N,<br />
Stavropoulos-Giokas A, Tassiopoulou A. Comparative evaluation<br />
of the erythroblast cell count generated by three-color fluorescence<br />
flow cytometry, the Abbott <strong>Cell</strong> DYN 4000 hematology analyzer,<br />
and microscopy. Lab Hematol. 1998;4:64-70.<br />
33. Lund-Johansen F, Terstappen LW. <strong>Differential</strong> expression of cell<br />
adhesion molecules during granulocyte maturation. J Leukoc Biol.<br />
1993;54:47-55.<br />
34. Fujimoto H, Sakata T, Hamaguchi Y, Shiga S, Wang F-s,<br />
Houwen B. Flow cytometric method for enumeration and classification<br />
of reactive immature granulocyte populations. Cytometry.<br />
2000;42:371-378.<br />
35. Houwen B. Blood film preparation and staining procedures. Lab<br />
Hematol. 2000;6:1-7.<br />
36. Cornbleet PJ, Novak RW. Classifying segmented and band neutrophils.<br />
CAP Today. 1994;8:37-41.<br />
37. Schumacher H, Glazier J, Ismail S, Mazella F. Bone marrow analysis<br />
provided by the <strong>Cell</strong> DYN 4000 hematology analyzer<br />
[abstract]. Lab Hematol. 1998;4:94.<br />
38. D’Onofrio G, Zini G, Tommasi M, et al. Automated analysis of<br />
bone marrow: Routine implementation and differences from<br />
peripheral blood. Lab Hematol. 1998;4:71-79.<br />
39. Wang F-s, Tsuji T, Sakata T, Hamaguchi Y, Hagbloom R, Houwen<br />
B. <strong>Count</strong>ing and staging of peripheral and cord blood nucleated<br />
red blood cells by flow cytometry [abstract]. Lab Hematol.<br />
1998;4:96.<br />
40. Zini G, Mistretta G, Crollari L, et al. Automated counting of<br />
nucleated red blood cells (NRBC): Evaluation of the Sysmex<br />
XE-2100 system [abstract]. Lab Hematol. 1999;5:94.<br />
41. Spanish Multicentric Study Group for Hematopoietic Recovery.<br />
Flow cytometric reticulocyte quantification in the evaluation of<br />
hematologic recovery. Eur J Haematol. 1994;53:293-297.<br />
42. Davis BH. Immature reticulocyte fraction: By any name, a useful<br />
clinical parameter of erythropoietic activity. Lab Hematol.<br />
1996;1:3-12.<br />
43. Wang F-s, Itose Y, Sagoaga O, et al. Development and clinical<br />
application of nucleated red blood cell staging with hematology<br />
analyzer XE-2100. 13 th International Symposium on Technological<br />
Innovations in Laboratory Hematology; April 2000; Banff,<br />
Alberta, Canada.