Difference between impedance and optical platelet count methods ...
Difference between impedance and optical platelet count methods ...
Difference between impedance and optical platelet count methods ...

You also want an ePaper? Increase the reach of your titles
YUMPU automatically turns print PDFs into web optimized ePapers that Google loves.
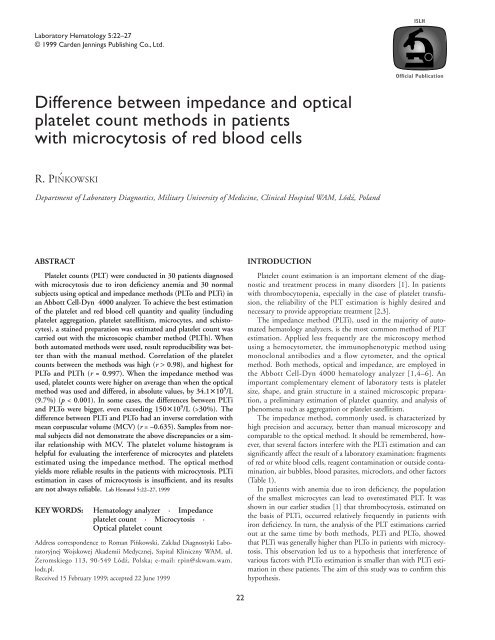
ISLHLaboratory Hematology 5:22–27© 1999 Carden Jennings Publishing Co., Ltd.Official Publication<strong>Difference</strong> <strong>between</strong> <strong>impedance</strong> <strong>and</strong> <strong>optical</strong><strong>platelet</strong> <strong>count</strong> <strong>methods</strong> in patientswith microcytosis of red blood cellsR. PIŃKOWSKIDepartment of Laboratory Diagnostics, Military University of Medicine, Clinical Hospital WAM, Lódź, Pol<strong>and</strong>ABSTRACTPlatelet <strong>count</strong>s (PLT) were conducted in 30 patients diagnosedwith microcytosis due to iron deficiency anemia <strong>and</strong> 30 normalsubjects using <strong>optical</strong> <strong>and</strong> <strong>impedance</strong> <strong>methods</strong> (PLTo <strong>and</strong> PLTi) inan Abbott Cell-Dyn 4000 analyzer. To achieve the best estimationof the <strong>platelet</strong> <strong>and</strong> red blood cell quantity <strong>and</strong> quality (including<strong>platelet</strong> aggregation, <strong>platelet</strong> satellitism, microcytes, <strong>and</strong> schistocytes),a stained preparation was estimated <strong>and</strong> <strong>platelet</strong> <strong>count</strong> wascarried out with the microscopic chamber method (PLTh). Whenboth automated <strong>methods</strong> were used, result reproducibility was betterthan with the manual method. Correlation of the <strong>platelet</strong><strong>count</strong>s <strong>between</strong> the <strong>methods</strong> was high (r > 0.98), <strong>and</strong> highest forPLTo <strong>and</strong> PLTh (r = 0.997). When the <strong>impedance</strong> method wasused, <strong>platelet</strong> <strong>count</strong>s were higher on average than when the <strong>optical</strong>method was used <strong>and</strong> differed, in absolute values, by 34.110 9 /L(9.7%) (p < 0.001). In some cases, the differences <strong>between</strong> PLTi<strong>and</strong> PLTo were bigger, even exceeding 15010 9 /L (>30%). Thedifference <strong>between</strong> PLTi <strong>and</strong> PLTo had an inverse correlation withmean corpuscular volume (MCV) (r = –0.635). Samples from normalsubjects did not demonstrate the above discrepancies or a similarrelationship with MCV. The <strong>platelet</strong> volume histogram ishelpful for evaluating the interference of microcytes <strong>and</strong> <strong>platelet</strong>sestimated using the <strong>impedance</strong> method. The <strong>optical</strong> methodyields more reliable results in the patients with microcytosis. PLTiestimation in cases of microcytosis is insufficient, <strong>and</strong> its resultsare not always reliable. Lab Hematol 5:22–27, 1999KEY WORDS: Hematology analyzer · Impedance<strong>platelet</strong> <strong>count</strong> · Microcytosis ·Optical <strong>platelet</strong> <strong>count</strong>Address correspondence to Roman Pińkowski, Zak ⁄lad Diagnostyki LaboratoryjnejWojskowej Akademii Medycznej, Szpital Kliniczny WAM, ul.Żeromskiego 113, 90-549 Lódź, Polska; e-mail: rpin@skwam.wam.lodz.pl.Received 15 February 1999; accepted 22 June 1999INTRODUCTIONPlatelet <strong>count</strong> estimation is an important element of the diagnostic<strong>and</strong> treatment process in many disorders [1]. In patientswith thrombocytopenia, especially in the case of <strong>platelet</strong> transfusion,the reliability of the PLT estimation is highly desired <strong>and</strong>necessary to provide appropriate treatment [2,3].The <strong>impedance</strong> method (PLTi), used in the majority of automatedhematology analyzers, is the most common method of PLTestimation. Applied less frequently are the microscopy methodusing a hemocytometer, the immunophenotypic method usingmonoclonal antibodies <strong>and</strong> a flow cytometer, <strong>and</strong> the <strong>optical</strong>method. Both <strong>methods</strong>, <strong>optical</strong> <strong>and</strong> <strong>impedance</strong>, are employed inthe Abbott Cell-Dyn 4000 hematology analyzer [1,4–6]. Animportant complementary element of laboratory tests is <strong>platelet</strong>size, shape, <strong>and</strong> grain structure in a stained microscopic preparation,a preliminary estimation of <strong>platelet</strong> quantity, <strong>and</strong> analysis ofphenomena such as aggregation or <strong>platelet</strong> satellitism.The <strong>impedance</strong> method, commonly used, is characterized byhigh precision <strong>and</strong> accuracy, better than manual microscopy <strong>and</strong>comparable to the <strong>optical</strong> method. It should be remembered, however,that several factors interfere with the PLTi estimation <strong>and</strong> cansignificantly affect the result of a laboratory examination: fragmentsof red or white blood cells, reagent contamination or outside contamination,air bubbles, blood parasites, microclots, <strong>and</strong> other factors(Table 1).In patients with anemia due to iron deficiency, the populationof the smallest microcytes can lead to overestimated PLT. It wasshown in our earlier studies [1] that thrombocytosis, estimated onthe basis of PLTi, occurred relatively frequently in patients withiron deficiency. In turn, the analysis of the PLT estimations carriedout at the same time by both <strong>methods</strong>, PLTi <strong>and</strong> PLTo, showedthat PLTi was generally higher than PLTo in patients with microcytosis.This observation led us to a hypothesis that interference ofvarious factors with PLTo estimation is smaller than with PLTi estimationin these patients. The aim of this study was to confirm thishypothesis.22
Impedance <strong>and</strong> Optical Platelet Count Methods <strong>and</strong> Microcytosis 23TABLE 1. Some reasons for interference with <strong>platelet</strong> <strong>count</strong> estimationusing automated <strong>methods</strong>Falsely high resultsCryoglobulinHemolysisSchistocytesMicrocytosisWhite blood cell fragmentsArtifactsMATERIALS AND METHODSFalsely low resultsMacrothrombocytesMicroclotsClotsUse of heparinPlatelet satellitismPlatelet degranulationPatient SamplesThirty patients with anemia due to iron deficiency <strong>and</strong> 30 normalsubjects were examined. Blood samples were stored using theBecton-Dickinson Vacutainer system (4 mL K 3 EDTA).PLTo <strong>and</strong> PLTi together with complete blood <strong>count</strong> (CBC) <strong>and</strong>differential were estimated using the Cell-Dyn 4000 hematologyanalyzer. For control purposes, each blood sample also underwent amicroscopy examination (stained blood smear) to confirm microcytosis,hypochromia, or presence of interfering elements.Microscopy Examination of Blood SmearRoutine microscopy of the stained peripheral blood smear wasused to evaluate the <strong>platelet</strong> <strong>count</strong>. This method was also applied toestimate the occurrence of aggregates or <strong>platelet</strong> satellitism,macrothrombocytes, microcytes, schistocytes, or white blood cellfragments, which could interfere with PLT estimation.Direct Microscopy Platelet CountsA phase contrast microscope, a hemocytometer (Burker’s chamber),<strong>and</strong> appropriate liquid (ammonium oxalate) were used to estimate<strong>platelet</strong> <strong>count</strong>s in both groups. The final result was the averageof the two estimations. In the case of significant divergence of<strong>platelet</strong> <strong>count</strong>s estimated with automated <strong>methods</strong>, the hemocytometer<strong>platelet</strong> <strong>count</strong> (PLTh) was used.Impedance Platelet CountsThe Cell-Dyn 4000 uses the <strong>impedance</strong> method (PLTi) to estimate<strong>platelet</strong> <strong>count</strong>. The method draws on a hydrodynamic focusingflow in an <strong>impedance</strong> chamber. On the basis of <strong>impedance</strong>,<strong>platelet</strong> size is estimated <strong>and</strong> a histogram of <strong>platelet</strong> volume is prepared.Platelet number <strong>and</strong> mean <strong>platelet</strong> volume are estimated onthe basis of the PLT histogram surface, limited by the lower <strong>and</strong>upper volume discriminator (Fig. 1).Optical Platelet CountsThe Cell-Dyn 4000, apart from the routine PLTi estimation,also uses the <strong>optical</strong> method (PLTo) to measure <strong>platelet</strong> <strong>count</strong>,applying multiangle polarized light scatter separation (MAPSS). Atwo-dimensional analysis estimates the complexity <strong>and</strong> <strong>optical</strong> densityof the <strong>platelet</strong>s, represented as a cytogram of the light intensityat 7- <strong>and</strong> 90-degree angles. Three moving discrimination lines createa window separating PLTo from other elements (Fig. 2).RESULTSCompared with manual microscopy, automated <strong>methods</strong> showbetter reproducibility of <strong>platelet</strong> <strong>count</strong>s (Table 2).If interference of non<strong>platelet</strong> elements (e.g., microcytes, schistocytes)occurs, then PLTi <strong>count</strong>s may be biased in their entirety(falsely high results). In such instances, the interference phenomenoncan be evaluated on the basis of the <strong>platelet</strong> volume histogram(Fig. 1). Such a procedure is insufficient, however, <strong>and</strong> should onlybe used for general information.Tables 3 <strong>and</strong> 4 contain detailed PLT <strong>count</strong>s estimated with thethree <strong>methods</strong>, summary of the quantitative results, <strong>and</strong> anac<strong>count</strong>ing of mean corpuscular cells in blood samples frompatients with microcytosis <strong>and</strong> normal subjects.In blood samples from patients with microcytosis, PLT valuesestimated using the <strong>impedance</strong> method were on the average higherby 9.7% than the <strong>optical</strong> method. The difference <strong>between</strong> PLTi <strong>and</strong>PLTo was statistically significant (p < 0.001). In individual cases,these differences were higher, as high as 30% (16710 9 /L as absolutevalues). In blood samples of normal subjects, PLT values estimatedusing the <strong>impedance</strong> method were on average higher by 1.7% thanthe <strong>optical</strong> method (p > 0.05). In individual cases, these differencesranged from –7.8% to 8.4% ( 0.98).The differences <strong>between</strong> PLTi <strong>and</strong> PLTo had an inverse correlationwith mean corpuscular volume (MCV) patients with microcy-ABFIGURE 1. Platelet volume histograms: normal (A) <strong>and</strong> with hindered separation due to presence of microcytes (B).
24 R PińkowskiTABLE 2. Platelet <strong>count</strong> reproducibility (coefficient of variation)depending on the blood examination method in patients withmicrocytosisAutomated <strong>methods</strong>Platelet <strong>count</strong> (10 9 /L) Manual (hemocytometer) PLTi PLTo130–400 9.9 4.7 3.8>400 8.7 3.4 2.9FIGURE 2. Cytogram outlining PLT, red blood cell (RBC),<strong>and</strong> microcyte (MICRO) separation in the <strong>optical</strong> measurementconducted with a Cell-Dyn 4000 analyzer. 7°, complexity;90°, <strong>optical</strong> density.tosis (r = –0.635) (Fig. 6). There was no such relationship in samplesfrom normal subjects (Fig. 7).On the basis of the PLT reference limit (150–40010 9 /L) acceptedin our laboratory, thrombocytosis <strong>and</strong> thrombocytopenia were detectedwith varying frequencies depending on the method (Table 5).The frequency of <strong>platelet</strong> changes in patients with microcytosiswas identical whether the hemocytometer or the <strong>optical</strong>TABLE 3. Platelet <strong>count</strong> <strong>and</strong> microcytosis in patients with iron deficiency anemiaPatient PLTh (10 9 /L) PLTo (10 9 /L) PLTi (10 9 /L) PLTi – PLTo (10 9 /L) PLTi – PLTo (%) MCV (fL) Microcytosis*1 567 564 561 –3 –0.5 80 +2 134 139 133 –6 –4.3 76 ++3 254 257 259 2 0.8 78 +4 230 239 238 –1 –0.4 80 +5 211 222 248 26 11.7 79 ++6 146 148 152 4 2.7 78 +7 135 128 150 22 17.2 78 +++8 193 191 207 16 8.4 80 +9 230 231 247 16 6.9 73 ++10 191 188 200 12 6.4 77 ++11 194 191 207 16 8.4 71 ++12 241 245 260 15 6.1 76 +13 281 283 309 26 9.2 72 ++14 380 381 416 35 9.2 71 ++15 267 262 288 26 9.9 75 +++16 432 412 463 51 12.4 73 ++17 457 444 506 62 14.0 65 ++18 391 383 401 18 4.7 77 +19 273 261 308 47 18.0 64 +++20 297 304 341 37 12.2 72 +++21 417 428 496 68 15.9 72 +++22 368 364 386 22 6.0 73 +23 270 263 300 37 14.1 71 ++24 226 230 250 20 8.7 73 +25 381 386 432 46 11.9 79 ++26 539 543 617 74 13.6 77 +++27 568 575 668 93 16.2 53 +++28 536 503 552 49 9.7 62 +++29 271 262 288 26 9.9 67 ++30 548 538 705 167 31.0 64 +++Average 321 319 353 34.1 9.7 73St<strong>and</strong>ard deviation 135 133 158 34.5 6.8 5.9Minimum 134 128 133 – 6 – 4.3 57Maximum 568 575 705 167 31.0 80*Severity of microcytosis was estimated by microscopic evaluation.
Impedance <strong>and</strong> Optical Platelet Count Methods <strong>and</strong> Microcytosis 25TABLE 4. Platelet <strong>count</strong> <strong>and</strong> mean corpuscular volume in normal subjectsPatient PLTh (10 9 /L) PLTo (10 9 /L) PLTi (10 9 /L) PLTi – PLTo (10 9 /L) PLTi – PLTo (%) MCV (fL)1 157 148 156 8 5.7 982 145 153 157 4 2.7 973 152 157 149 –8 –5.1 954 164 158 171 13 8.4 945 163 159 155 –4 –2.7 876 159 163 155 –8 –5.1 867 161 163 155 –8 –5.1 908 158 166 153 –13 –7.8 899 168 169 166 –3 –1.8 8710 182 178 193 15 8.4 9611 189 180 192 12 6.4 9012 187 193 209 16 8.3 9113 189 196 192 –4 –1.8 8414 197 200 213 13 6.3 9815 204 200 215 15 7.3 8816 211 206 203 –3 –1.4 8717 229 239 238 –1 –0.4 8618 263 254 271 17 6.7 8219 254 260 259 –1 –0.4 9420 296 301 316 15 5.0 9221 317 303 300 –3 –0.9 8922 323 312 316 4 1.2 9023 324 317 330 13 4.2 9524 331 321 323 2 0.6 9225 337 322 340 18 5.7 8926 348 356 353 –3 –0.9 9827 362 365 358 –7 –1.9 9428 372 371 388 17 4.5 8329 387 376 389 13 3.4 8630 391 383 386 3 0.7 82Average 244 242 247 4.4 1.7 90St<strong>and</strong>ard deviation 84 81 84 9.6 4.6 4.8Minimum 145 148 149 –13 –7.8 82Maximum 391 383 389 18 8.4 98FIGURE 3. Correlation of the results of PLT <strong>count</strong>s using the <strong>optical</strong> method (PLTo) <strong>and</strong> the <strong>impedance</strong> method (PLTi) in bloodsamples from patients with microcytosis.
26 R PińkowskiFIGURE 4. Correlation of the results of PLT <strong>count</strong>s using the <strong>optical</strong> method (PLTo) <strong>and</strong> the manual method in blood samples frompatients with microcytosis.FIGURE 5. Correlation of the results of PLT <strong>count</strong>s using the <strong>impedance</strong> method (PLTi) <strong>and</strong> the manual method in blood samplesfrom patients with microcytosis.method was used. When the <strong>impedance</strong> method was used, five of30 cases had excessive PLT values, including two false-negativeresults for thrombocytopenia <strong>and</strong> three false-positive results forthrombocytosis.DISCUSSIONImpedance <strong>platelet</strong> <strong>count</strong>s, based only on the estimation of volume,prove imperfect in the presence of non<strong>platelet</strong> elements similarin size to <strong>platelet</strong>s. Microcytes, which are present in blood frompatients with anemia due to iron deficiency, interfere with PLTi<strong>count</strong>s to various degrees. Excessive results in the 150–40010 9 /Larea of the scope or slight thrombocytosis do not constitute clinicalproblems. False-negative results in the case of thrombocytopeniamay jeopardize life. The new <strong>optical</strong> method of <strong>platelet</strong> <strong>count</strong> estimationin hematology analyzers significantly increases the reliabilityof the data. Optical <strong>methods</strong> are less susceptible to interference ofnon<strong>platelet</strong> elements such as microcytes.As other authors have observed [3], the <strong>impedance</strong> method providesbiased results when macrothrombocytes or red blood cell frag-TABLE 5. Frequency of thrombocytopenia (PLT 40010 9 /L) in blood samples from 30patients with iron deficiency anemiaPLTh PLTo PLTiPLT 40010 9 /L 8/30 8/30 11/30
Impedance <strong>and</strong> Optical Platelet Count Methods <strong>and</strong> Microcytosis 27FIGURE 6. Correlation of the <strong>impedance</strong> <strong>and</strong> <strong>optical</strong> <strong>platelet</strong> <strong>count</strong> difference (PLTi <strong>and</strong> PLTo) <strong>and</strong> the MCV in blood samplesfrom patients with microcytosis.FIGURE 7. Relationship of <strong>impedance</strong> <strong>and</strong> <strong>optical</strong> <strong>platelet</strong> <strong>count</strong> difference (PLTi <strong>and</strong> PLTo) <strong>and</strong> MCV in normal blood samples.ments are present. In the former case, PLTi is falsely low; if schistocytesare present (as in microcytosis), results are falsely high.Currently, the application of both PLT estimation <strong>methods</strong>, <strong>optical</strong><strong>and</strong> <strong>impedance</strong>, constitutes the best solution, especially in clinicallydifficult cases in which only a reliable result ensures the successof treatment (such as in cytoreductive treatment, after bone marrowtransplant, marrow aplasia, or in severe cases of thrombocytopenia).REFERENCES1 PINKOWSKI R: Blood <strong>platelet</strong>s: Current indices <strong>and</strong> some selected problemsrelated to the use of hematology analyzers. Abbott Laboratories Pol<strong>and</strong>:educational materials, ISBN 83-907097-0-8, 1997 [in Polish]2 AULT KA: Platelet <strong>count</strong>ing: Is there room for improvement? Lab Hematol2:139, 19963 KCKLER TS, ROTHE M, BLOSSER L, SCHISANO T, VAN HOVE L: Improving<strong>platelet</strong> transfusion therapy using the ImmunoPLT method on the CELL-DYN 4000. Lab Hematol 4:80, 19984 GOOSSENS W, S COTT CS, WALSH A, VANDEKERKHOVE PH, VANORSHOVEN A, VAN HOVE L: First basic performance evaluation of theCELL-DYN 4000. Lab Hematol 2:151, 19965 TATSUMI N, TSUDA I, SHIMIZU A, WATANABE K, MATSUNO K: Basic performanceevaluation of the new hematology analyzer, CELL-DYN 4000:Japanese hematology analyzer study group. Lab Hematol 2:157, 19966 VAN HOVE L, JANIK J, BECKER R, SCHISANO T, KIM YR, CHUPP V: CELL-DYN 4000, the next hematology analyzer. Int J Hematol 64 (Suppl1):164, 19967 PENNINCK D, CONTEMPRE B, WIJNS W, CAPEL P: Evaluation of AbbottCell-Dyn 4000, with special emphasis on <strong>platelet</strong> <strong>and</strong> nucleated red bloodcell. Lab Hematol 2:181, 1997