Evaluation of Leukocyte Differential Count Information - Carden ...
Evaluation of Leukocyte Differential Count Information - Carden ...
Evaluation of Leukocyte Differential Count Information - Carden ...

Create successful ePaper yourself
Turn your PDF publications into a flip-book with our unique Google optimized e-Paper software.
ISLHLaboratory Hematology 5:1–xx© 1999 <strong>Carden</strong> Jennings Publishing Co., Ltd.Official Publication<strong>Evaluation</strong> <strong>of</strong> <strong>Leukocyte</strong> <strong>Differential</strong> <strong>Count</strong> <strong>Information</strong>from the CELL-DYN 3200 Hematology AnalyzerC. SACHSE, G. JAHNS-STREUBEL, E. HENKELDepartment <strong>of</strong> Clinical Chemistry II, Medical School Hannover, Hannover, GermanyABSTRACTA new hematology analyzer, the CELL-DYN 3200, was evaluatedin a tertiary care hospital laboratory with regard to precisionand accuracy <strong>of</strong> the 5-part white blood cell differential providedand clinical sensitivity and specificity <strong>of</strong> the instrumentflagging system. Short- and long-term precision was fully satisfactoryin normal and abnormal nonflagged specimens. CELL-DYN 3200 values corresponded closely with those <strong>of</strong> referencemicroscopic 400-cell differentials: in normal samples, averagebias did not exceed 1% for any cell type. Moreover, in abnormalnonflagged specimens, no case with gross discrepancy betweenCELL-DYN 3200 and microscopy results was observed; linearregression coefficients were 0.96, 0.95, 0.68, 0.95, and 0.57 forneutrophil, lymphocyte, monocyte, eosinophil, and basophil percentages,respectively. The instrument diagnostic efficiency was88.5% for morphologic abnormalities only and 90.6% if bothmorphologic and distributional abnormalities were considered.False-negative results were largely confined to some cases withmoderate elevation <strong>of</strong> immature granulocytes and band cells.Our evaluation suggests that the CELL-DYN 3200 will serve theneeds for automated leukocyte differential counting in a tertiarycare hospital or other setting with a high proportion <strong>of</strong> abnormalspecimens. Lab Hematol. 1999;5:XXX–XXX.KEY WORDS Hematology automation ·Hematology analyzer evaluation ·<strong>Leukocyte</strong> differential FlaggingAddress correspondence to C. Sachse, MD, Department <strong>of</strong> ClinicalChemistry II, Medical School Hannover, Podbielskistr. 380, 30659Hannover, Germany; e-mail: alisia.sachse@t-online.deThis study was supported by Abbott Diagnostics.Received May 20, 1999; accepted August 25, 1999INTRODUCTIONIn routine care, laboratory hematologic diagnosis generallystarts with a cellular blood count and a leukocyte differentialcount. The cellular blood count can be regarded as primarily aquantitative task; its automation has long been established [1]. Incontrast, the leukocyte differential count essentially represents aqualitative procedure involving leukocyte classification and thediagnosis <strong>of</strong> cell abnormalities in each cell class. For leukocyte classification,in our laboratory in Germany we adopted a schemeused for external quality control <strong>of</strong> microscopic leukocyte differentialcount, which includes 18 cell types. In addition, an overviewlisted 53 qualitative abnormalities distinguishable by microscopicleukocyte examination [2]. Because no manufacturer <strong>of</strong> an automatedhematology analyzer claims that the instrument can recognizethis huge variety <strong>of</strong> cell types or morphologic abnormalities,the microscopic leukocyte differential count remains an essentialpart <strong>of</strong> laboratory diagnosis. However, because this technique issubjective, laborious, and imprecise under routine conditions,many laboratories try to combine the advantages <strong>of</strong> automatedand microscopic testing. With this strategy, automated analysis isperformed on all samples, whereas microscopic examination isrestricted to samples with predefined features <strong>of</strong> analyzer testing.This procedure requires that instrument results be correct withregard to quantification <strong>of</strong> specific cell populations and that thepresence <strong>of</strong> relevant pathology exceeding distributional changes isindicated in the results by flags or other means. The fulfillment <strong>of</strong>these requirements must be proved in field studies.To facilitate and standardize such studies, guidelines have beenpublished [2,3] and special attention given to the establishment <strong>of</strong>a standard for reference leukocyte differential counting [4]. Usingthese guidelines, valuable information regarding the performance <strong>of</strong>an analyzer can be obtained. Because there are clear differences(especially in clinical sensitivity) between the more laborious referenceleukocyte differential and routine microscopic testing, thisinformation does not directly relate to a comparison between theinstrument and microscopy under routine conditions. This problemcan be overcome by parallel evaluation <strong>of</strong> both proceduresagainst the reference method; however, we are not aware <strong>of</strong> anystudy in which this approach was chosen.1
2 Sachse et alTABLE 1. Flagging Messages <strong>of</strong> the CELL-DYN 3200 AnalyzerSuspectSuspectParameter Parameter Flags Population Flags<strong>Leukocyte</strong> WBC NWBC (nonwhite blood cells)countFWBC (fragile white blood cells)NRBC (nucleated red blood cells)RRBC (resistant red blood cells)<strong>Leukocyte</strong> DIFF BAND (neutrophil band forms)differential (NLMEB*) IG (immature granulocytes)(DIFF)BLAST (blast cells)VARIANT LYM (variant lymphocytes)*Cell types affected: N, neutrophils; L, lymphocytes; M, monocytes; E,eosinophils; B basophils.Alternatively, some differences between reference and routinemicroscopy can be taken into account on the basis <strong>of</strong> statistical considerations.Assuming that the Poisson distribution fits best for bothautomated and microscopic leukocyte differentials [5], the statistic <strong>of</strong>the widely used 100-cell microscopic differential can be calculated.In this study, the leukocyte differential count information froma new hematology analyzer, the CELL-DYN 3200 (CD 3200)(Abbott, Abbott Park, IL), was evaluated with regard to precision,accuracy, and clinical sensitivity and specificity.MATERIALS AND METHODSThroughout the study, unless otherwise indicated, we adhered tothe International Council for Standardization in Haematology guidelinesfor blood cell analyzer evaluation and the National Committeefor Clinical Laboratory Standards (NCCLS) standard for referenceleukocyte differentials [3,4]. Deviations from these guidelines includedthe choice <strong>of</strong> anticoagulant and the composition <strong>of</strong> samples.Blood SamplesPatient blood samples were obtained from the OststadtkrankenhausHannover, a tertiary care hospital that belongs to theMedical School Hannover, Germany, and cares for a high proportion<strong>of</strong> critically ill patients, and the Department <strong>of</strong> Hematology<strong>of</strong> the Medical School Hannover. Of 387 selected blood specimens,333 were drawn for routine hematologic analysis from adultinpatients <strong>of</strong> the Oststadtkrankenhaus Hannover and 39 samples,most with malignant hematologic abnormalities, were from theMedical School Hannover. In addition, 15 cord blood samples wereexamined. Analysis <strong>of</strong> accuracy and flagging performance relies on382 samples only, because in 5 cases (all with white blood cellcount 80%) 63Neutropenia (U 1.5 ( 10 9 /L and 50%) 17Lymphopenia (U 1.0 ( 10 9 /L and 10%) 22Eosinophilia (U 0.5 ( 10 9 /L and >7%) 13Qualitative leukocyte abnormality (any <strong>of</strong> the following criteria) 80Band cells (U 0.9 ( 10 9 /L and >6%) 10Immature granulocytes* (U 0.1 ( 10 9 /L and >2%) 34Variant lymphocytes* (U 0.7 ( 10 9 /L and >2%) 28Blasts* (U 0.1 ( 10 9 /L and >2%) 21Nucleated red blood cells (U 0.02 ( 10 9 /L and >2%) 27*Definitions differing from the H20-A standard. Immature granulocytescomprise promyelocytes, myelocytes, and metamyelocytes.
CELL-DYN 3200 <strong>Leukocyte</strong> <strong>Differential</strong> 3TABLE 3.Short-term Paired Imprecision <strong>of</strong> CELL-DYN 3200 <strong>Leukocyte</strong> Percentage Measurement*Sample GroupNormal Abnormal Samples Abnormal SamplesCell Type Parameter All Samples Samples Without Flag With FlagNumber <strong>of</strong> samples 387 59 232 96Neutrophils Mean value 62.3 60.5 70.7 43.1Coefficient <strong>of</strong> variation 1.3 1.1 0.9 2.8Mean difference 0.0 0.1 0.0 0.2Minimum difference 3.4 1.9 2.4 3.4Maximum difference 7.7 1.9 3.1 7.7Lymphocytes Mean value 25.2 29.7 19.3 36.6Coefficient <strong>of</strong> variation 8.7 3.6 5.6 11.1Mean difference 0.2 0.5 0.4 0.8Minimum difference 38.5 1.9 4.0 38.5Maximum difference 16.0 4.3 6.7 16.0Monocytes Mean value 8.5 6.4 6.9 13.9Coefficient <strong>of</strong> variation 22.1 12.2 13.8 24.8Mean difference 0.4 0.4 0.4 0.2Minimum difference 33.3 3.4 5.9 33.3Maximum difference 18.2 1.4 4.8 18.2Eosinophils Mean value 2.3 2.4 2.3 2.4Coefficient <strong>of</strong> variation 48.8 8.2 8.8 93.6Mean difference 0.1 0.0 0.0 0.3Minimum difference 2.3 0.6 0.9 2.3Maximum difference 30.8 0.8 1.0 30.8Basophils Mean value 1.7 1.0 0.9 4.0Coefficient <strong>of</strong> variation 39.8 17.7 19.7 32.4Mean difference 0.1 0.0 0.0 0.4Minimum difference 2.8 0.7 1.0 2.8Maximum difference 10.5 0.5 1.3 10.5*Data are given in %. Differences were calculated as run 2 – run 1.3000 Control (Abbott) provided by the manufacturer was measuredon each <strong>of</strong> 20 consecutive workdays. Separate analyses were performedon data from all specimens, from abnormal specimens withand without instrument flag, and from normal specimens (all cellularblood count and leukocyte differential count values within thelaboratory reference ranges).AccuracyAccuracy was examined in accordance with the proposals madein the NCCLS standard H20-A [4]. Reference microscopy was performedby 2 experienced medical technologists. For the comparison<strong>of</strong> CD 3200 neutrophil percentages, the manual differentialpromyelocyte, myelocyte, metamyelocyte, and band cell and segmentedneutrophil percentages were added. Similarly, with regardto CD 3200 lymphocyte estimates, the total <strong>of</strong> normal and variantlymphocytes by microscopy was determined. Again, separate analyseswere done for different sample groups.Clinical Sensitivity and SpecificityThe NCCLS H20-A procedures were used. For a sample to beclassified as morphologically abnormal by microscopic examination,one <strong>of</strong> the following requirements had to be fulfilled: (1) bandcells >6%; (2) variant lymphocytes >2%; (3) total <strong>of</strong> promyelocytes,myelocytes, and metamyelocytes >1%; or (4) total <strong>of</strong> allother abnormal cell types >1%. In addition, clinical sensitivity wasanalyzed considering the diagnostic capacity <strong>of</strong> routine 100-cellmicroscopic differentials. If the percentage <strong>of</strong> an abnormal cell typereaches 3%, the Poisson distribution gives a 95% probability <strong>of</strong>finding 1 <strong>of</strong> these abnormal cells in the 100 leukocytes examined.Therefore, special attention was given to samples containing at least3% <strong>of</strong> an abnormal cell type.TABLE 4. Long-term Imprecision <strong>of</strong> CELL-DYN 3200 <strong>Leukocyte</strong>PercentagesCell Type Mean Value (%) Coefficient <strong>of</strong> Variation (%)Neutrophils 66.4 1.6Lymphocytes 17.9 6.6Monocytes 9.3 11.1Eosinophils 3.9 10.0Basophils 2.5 22.4
4 Sachse et alTABLE 5. Accuracy <strong>of</strong> CELL-DYN 3200 <strong>Leukocyte</strong> Percentage Measurement with 400-Cell Microscopic <strong>Differential</strong>s Serving as ReferenceMethod*Sample GroupNormal Abnormal Samples Abnormal SamplesCell Type Parameter All Samples Samples Without Flag With FlagNumber <strong>of</strong> samples 382 59 232 91Neutrophils Mean (microscopy) 64.6 60.7 72.8 46.0Range (microscopy) 0.0–93.8 49.5–73.3 28.0–93.8 0.0–93.8Mean (CELL-DYN 3200) 62.9 60.5 70.7 44.3Mean difference 1.7 0.2 2.1 1.7Minimum difference 54.4 8.0 15.9 54.4Maximum difference 22.9 10.6 13.2 22.9SD <strong>of</strong> difference 5.7 3.6 3.6 9.8Passing/Bablok* 0.97x + 0.61 1.11x 7.14 0.99x 1.38 0.97x + 0.90r 0.97 0.81 0.96 0.96Lymphocytes Mean (microscopy) 23.6 30.0 18.2 33.0Range (microscopy) 0.0–99.0 20.5–42.3 2.3–64.3 0.0–99.0Mean (CELL-DYN 3200) (%) 24.6 29.4 19.0 35.6Mean difference (%) 1.0 0.6 0.8 2.5Minimum difference (%) 34.2 7.9 12.5 34.2Maximum difference (%) 70.7 7.9 14.0 70.7SD <strong>of</strong> difference (%) 8.5 3.4 3.3 16.5Passing/Bablok* 0.94 x + 1.57 1.02x 1.15 0.96x + 1.49 0.94x + 1.37r 0.89 0.81 0.95 0.85Monocytes Mean (microscopy) (%) 6.5 6.4 6.5 6.8Range (microscopy) (%) 0.0–38.8 3.5–10.0 1.3–18.3 0.0–38.8Mean (CELL-DYN 3200) (%) 8.7 6.6 7.1 14.2Mean difference (%) 2.2 0.2 0.6 7.4Minimum difference (%) 8.4 2.5 5.8 8.4Maximum difference (%) 80.7 3.6 8.6 80.7SD <strong>of</strong> difference (%) 8.5 1.4 2.1 16.0Passing/Bablok 1.10x 0.00 1.20x 0.94 0.91x + 0.98 1.78x 1.76r 0.41 0.62 0.68 0.41Eosinophils Mean (microscopy) (%) 2.0 2.1 1.9 2.0Range (microscopy) (%) 0.0–23.3 0.3–5.5 0.0–18.0 0.0–23.3Mean (CELL-DYN 3200) (%) 2.2 2.4 2.3 2.0Mean difference (%) 0.3 0.3 0.3 0.0Minimum difference (%) 10.7 1.4 2.0 10.7Maximum difference (%) 5.4 3.0 5.4 4.8SD <strong>of</strong> difference (%) 1.1 0.8 0.9 1.6Passing/Bablok 1.10x + 0.12 1.14x + 0.02 1.11x + 0.12 1.07x + 0.07r 0.93 0.86 0.95 0.93Basophils Mean (microscopy) (%) 0.5 0.8 0.5 0.4Range (microscopy) (%) 0.0–6.5 0.0–2.0 0.0–3.5 0.0–6.5Mean (CELL-DYN 3200) (%) 1.6 1.0 0.9 3.9Mean difference (%) 1.1 0.3 0.4 3.5Minimum difference (%) 5.5 1.2 1.7 5.5Maximum difference(%) 51.7 1.1 1.8 51.7SD <strong>of</strong> difference (%) 4.0 0.5 0.5 7.7Passing/Bablok 1.40x + 0.36 0.54x + 0.66 0.95x + 0.38 No resultr 0.02 0.32 0.57 0.05*Results <strong>of</strong> the method comparison according to Passing and Bablok are given as y = (slope)x +/ intercept, where y = CELL-DYN 3200 values andx = microscopy values; SD, standard deviation; r, linear regression coefficient.
RECORDSIowa Code Chapter 22; 281 IAC 12.3(4) Student records.Each board establishes and maintains a system <strong>of</strong> studentrecords. This system includes a student permanent <strong>of</strong>fice recordand a cumulative record. Permanent <strong>of</strong>fice record serves as ahistorical record <strong>of</strong> <strong>of</strong>ficial information concerning student’seducation. At a minimum, permanent <strong>of</strong>fice record should containevidence <strong>of</strong> attendance and educational progress, serve as an<strong>of</strong>ficial transcript, contain other data for use in planning to meetstudent needs, and provide data for <strong>of</strong>ficial school and schooldistrict reports. This record is permanently maintained/ stored ina fire-resistant safe or vault or can be maintained and storedelectronically with a secure back-up file. Cumulative recordprovides a continuous and current record <strong>of</strong> significantinformation on progress and growth. It should reflect informationsuch as courses taken, scholastic progress, school attendance,physical and health record, experiences, interests, aptitudes,attitudes, abilities, honors, extracurricular activities, part-timeemployment, and plans. It is the “working record” used byinstructional pr<strong>of</strong>essional staff in understanding the student. Atrequest <strong>of</strong> a receiving school or school district, a copy <strong>of</strong>cumulative record is sent to <strong>of</strong>ficials <strong>of</strong> that school when astudent transfers. For sole purpose <strong>of</strong> implementing aninteragency agreement with state and local agencies, a student’spermanent record may include information contained incumulative record. The board adopts a policy on accessibility andconfidentiality <strong>of</strong> student records that complies with FederalFamily Educational Rights and Privacy Act and Iowa CodeChapter 22. 441 IAC 79.3(3) Medicaid requires recordsmaintenance for five years from the date <strong>of</strong> claim. Interpretation:Legal lessons, Student records, Transfer copy permanent file may sendoriginal cumulative and keep copy; Student records as school property;Maintain cumulative records beyond transfer/’graduation date if there areunresolved issues,SCHOOL FOOD PROGRAM42 USC Chapter 13 Requires nutrition education and training. 42USC 1771 et seq. Requires a local educational agency wellnesspolicy, at a minimum-nutrition education goals, physical activity,and other school-based activities designed to promote studentwellness that the local educational agency determinesappropriate; nutrition guidelines selected by the local educationalagency for all foods available on each school campus under thelocal educational agency during the school day with objectives <strong>of</strong>promoting student health and reducing childhood obesity;provides an assurance guidelines for reimbursable school mealsshall not be less restrictive than regulations and guidance issuedin the Child Nutrition Act and sections <strong>of</strong> the National SchoolLunch Act as those regulations and guidance apply to schools;establishes a plan for measuring implementation <strong>of</strong> local wellnesspolicy, including designation <strong>of</strong> 1 or more persons within localeducational agency or at each school, as appropriate, chargedwith operational responsibility for ensuring the school meets thelocal wellness policy; and involves parent and studentsrepresentatives <strong>of</strong> the school food authority, the school board,school administrators, and the public in development <strong>of</strong> theschool wellness policy. 7 CFR §§210.10(g(1-3) Exceptions andvariations allowed in meals; medical or special dietary needs(case by case basis for students when supported by a statement<strong>of</strong> need and alternate foods signed by a physician or medicalauthority), ethnic, religious, economic reasons, and naturaldisasters. Iowa Code Chapter 283A, 281 IAC 58 All publicschools provide school meal programs. Lunch programsrequired. Nutritional standards for foods and beverages sold orprovided on school ground during the school day. Iowa Code§283A.2(3) 3 Each school district operating or providing a schoolfood program provides forwarding <strong>of</strong> application information,when federal funding is provided, to identify children forenrollment in medical assistance program pursuant to healthyand well kids in Iowa program pursuant to chapter 514I todepartment <strong>of</strong> human services.SCHOOL NURSEIowa Code §256.11(9B) District shall have a school nurse toprovide health services. District shall work toward goal <strong>of</strong> oneschool nurse for every 750 students enrolled. School nursemeans a person who holds an endorsement (RN from Board <strong>of</strong>Nursing). Available and not required School Nurse statement <strong>of</strong>pr<strong>of</strong>essional recognition (SPR) from Iowa Board <strong>of</strong> EducationalExaminers. Interpretation: District school nurse is employed, shared, orcontracted, and amount <strong>of</strong> time not specified. The school nurse (RN withbaccalaureate degree and SPR) meets the definition <strong>of</strong> “teacher’, SchoolLeader Update-Legislative Update, May 2007.282 IAC 16.3 School Nurse SPR from Board <strong>of</strong> EducationalExaminers authorizes the registered nurse (RN) to promotehealth and safety <strong>of</strong> students including medical treatment allowedunder RN license. Requires current RN license from the Board <strong>of</strong>Nursing, baccalaureate degree, valid for five years and renewalrequires continuing education required by board <strong>of</strong> nursing andchild and dependent abuse education. Available and not requiredto practice in a school. To renew submit fee, copy current RNlicense, and record <strong>of</strong> child abuse course. Board <strong>of</strong> EducationalExaminers http://www.boee.iowa.gov/ChooseNew.html282 IAC 16.7 Special education nurse SPR authorizes the nurseto provide school nurse and school health services with specialeducation pupils birth to age 21. Special education directorsubmits a letter to the educational examiners requesting theSPR. Requirements: Nursing baccalaureate or master’s degree<strong>of</strong>ficial transcript; current Iowa Board <strong>of</strong> Nursing license; andverification <strong>of</strong> two years' experience in public health nursingincluding service to schools or as a school nurse. Valid for 5years and temporary authorization and requirements listed.281 IAC 12.4(12) Board employing a nurse requires a currentlicense filed with the superintendent.Iowa Code §279.13 School Nurse contract is in writing, statingnumber <strong>of</strong> contract days, annual compensation, any other matteras mutually agreed, not to exceed a term beyond the school yearexcept as otherwise authorized, signed by the Board and nurse,and on file before entering into performance.282 IAC 17.1,-.4 Specialized career/technical secondaryendorsements and licenses, health initial career, technical, andClass D requirements. Contact Board <strong>of</strong> Educational Examiners.282 IAC 13.28(28) School nurse endorsement. The holderauthorized to provide service as a school nurse, prekindergarten-12th grade. Program requirements: baccalaureate degree,approved human relations program, pr<strong>of</strong>essional education core,and a current license. Endorsed nurses may teach health at allgrade levels does not authorize general classroom teaching.Alternatively, a nurse may obtain a statement <strong>of</strong> pr<strong>of</strong>essionalrecognition (SPR) from the board <strong>of</strong> educational examiners, inaccordance with the provisions set out in 282—Chapter 16. Note:School Nurse endorsement is optional, not currently <strong>of</strong>fered by aninstitution, and not required to be employed as a school nurse.Iowa Code §152.1(1-2) The "practice <strong>of</strong> nursing" meanspractice <strong>of</strong> a registered nurse or a licensed practical nurse.Nursing Practice Definitions. "Practice <strong>of</strong> pr<strong>of</strong>ession <strong>of</strong> aregistered nurse" means practice <strong>of</strong> a natural person licensed byboard to do all <strong>of</strong> specified in a-f.655 IAC 6.1 Nursing practice for registered nurses selecteddefinitions. Accountability: Obligated to answer for one's actsincluding supervision. Competence: Knowledge/ability to perform,skillfully/pr<strong>of</strong>iciently, functions within the role. Minimumstandards: Standards <strong>of</strong> practice that interpret legal definition <strong>of</strong>nursing and provide criteria to determine violations <strong>of</strong> law.Nursing diagnosis: Judgment following assessment to form basisfor determining effective interventions. Nursing process: Ongoingassessment, nursing diagnosis, planning, intervention, andevaluation. Proximate area: Registered nurse analyzesqualification <strong>of</strong> the LPN in relationship to client nursing needs todetermine appropriate distance within building and timenecessary to be readily available. Unlicensed assistivepersonnel: Individual trained to function in assistive role inproviding nursing care activities as delegated by RN or LPN.5
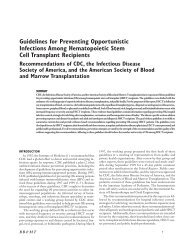
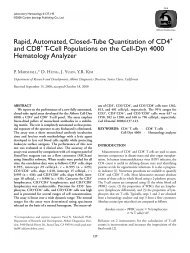
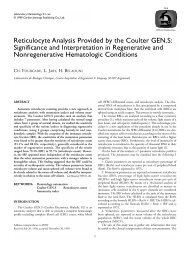
6 Sachse et alFIGURE 1. CELL-DYN 3200 accuracy (all specimens). Neutrophil (A), lymphocyte (B), monocyte (C), eosinophil (D), and basophil (E)percentage results <strong>of</strong> the CELL-DYN 3200 analyzer were compared with 400-cell microscopic differentials. All specimens were included.Solid lines show the 95% confidence limits.Statistical AnalysisIn addition to the procedures outlined in the NCCLS H20-Astandard, the biometrical method proposed by Passing and Bablok[10] was used for method comparison.RESULTSSample CompositionThe patient samples examined comprised 59 hematologicallynormal and 328 hematologically abnormal specimens. The hematologicallyabnormal samples comprised 127 and 80 specimenswith quantitative and qualitative leukocyte abnormalities, respectively;the remaining abnormal specimens showed quantitativedeviations <strong>of</strong> cellular blood count parameters. Zero normal and96 abnormal samples were flagged by the CD 3200. With regardto the characteristic leukocyte differential count findingsdescribed in the H20-A standard, at least 10 specimens with any<strong>of</strong> the leukocyte abnormalities were included in the study. Thedetails are summarized in Table 2.PrecisionIn normal samples, CD 3200 short-term imprecision coefficients<strong>of</strong> variation varied between 1.1% for neutrophils and17.7% for basophils. In abnormal specimens without instrumentgeneratedflags, only moderately higher short-term imprecision wasdetermined. However, CD 3200 measurements <strong>of</strong> flagged samples
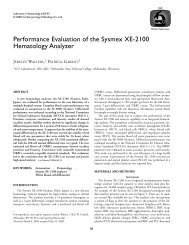
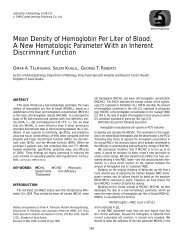
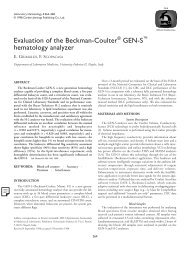
8 Sachse et alFIGURE 2. CELL-DYN 3200 accuracy (nonflagged specimens). Neutrophil (A), lymphocyte (B), monocyte (C), eosinophil (D), andbasophil (E) percentage results <strong>of</strong> the CELL-DYN 3200 analyzer were compared with 400-cell microscopic differentials. Analysis wasrestricted to specimens without instrument-generated leukocyte flags. Solid lines show the 95% confidence limits.were clearly less precise, with coefficients <strong>of</strong> variation generally 2 to3 times higher than in the normal sample group. Run-to-run imprecisionbias plots (not shown) revealed 6 samples (all flagged) withgross imprecision <strong>of</strong> cell type percentages. Two <strong>of</strong> these samples wereleukopenic (white blood cell counts 0.04 ( 10 9 /L and 0.33 ( 10 9 /L),with chance effects exerting a strong influence on measuredpercentages. In the other 4 cases, irregularly positioned blasts (onmicroscopical examination shown to be made up <strong>of</strong> 88.5%-100%leukocytes) led to an arbitrary separation <strong>of</strong> cell types. Long-termimprecision coefficients <strong>of</strong> variation varied from 1.6% for neutrophilsto 22.4% for basophils. Short- and long-term imprecisionresults are summarized in Table 3 and Table 4, respectively.AccuracyAccuracy <strong>of</strong> the CD 3200 analyzer depended largely, again, onthe type <strong>of</strong> specimen used. CD 3200 results generally comparedwell with those <strong>of</strong> reference microscopy in both normal samplesand abnormal samples without instrument-generated flags. In normalsamples, mean values <strong>of</strong> CD 3200 and microscopic resultswere nearly identical, and standard deviations <strong>of</strong> differences variedbetween 0.5% (basophils) and 3.6% (neutrophils). In abnormalnonflagged samples, similarly low inaccuracy was determined,although maximal deviations were somewhat higher. In contrast, asubstantial proportion <strong>of</strong> flagged samples showed gross discrepanciesbetween CD 3200 results and microscopy. However, even with
CELL-DYN 3200 <strong>Leukocyte</strong> <strong>Differential</strong> 9
CELL-DYN 3200 <strong>Leukocyte</strong> <strong>Differential</strong> 11TABLE 6. Clinical Sensitivity and Specificity <strong>of</strong> the CELL-DYN 3200Analyzer in Comparison to 400-Cell Microscopic <strong>Differential</strong>sParameter Result (%)Morphologic abnormalities onlyEfficiency (agreement) 88.5Sensitivity 75.3False-negative ratio 24.7Specificity 92.7False-positive ratio 7.3Morphologic and distributional abnormalities combinedEfficiency (agreement) 90.6Sensitivity 94.0False-negative ratio 6.0Specificity 82.8False-positive ratio 17.2(in 1 case with 14.75% Sézary cells), and nucleated red blood cells(in 1 case with 10.75 nucleated red blood cells/100 leukocytes, redblood cell abnormality marked by the CD 3200).DISCUSSIONA principle <strong>of</strong> laboratory medicine says that a new techniqueshould possess analytical and technical quality at least as high asthe method it is thought to replace. Concerning automated versusmicroscopic leukocyte differential counting, the advantages<strong>of</strong> sophisticated hematologic instruments are undeniable, especiallywith regard to precision and turnaround time. At present,instrument-generated leukocyte differential counts cannotreplace microscopy, because no analyzer is able to identify thevariety <strong>of</strong> morphologic abnormalities possibly encountered inblood films. However, automated and microscopic methods canbe combined in diagnostic strategies. Here, we report a fieldstudy examining the ability <strong>of</strong> the CD 3200, a hematologic analyzerrecently introduced into the market, to work as an efficienttool in such strategies.The precision results <strong>of</strong> the CD 3200 compare well with those<strong>of</strong> other modern hematology analyzers. Generally, similar valueshave been obtained with Coulter STKS and MAXM (CoulterCorporation, Miami, FL) [11-15], Bayer Diagnostics H-1 andH-2 (Bayer, Tarrytown, NY) [11-13], Sysmex NE-8000 andSE-9000 (Sysmex, Kobe, Japan) [12,16], ABX Cobas Argos(ABX/Roche, Montpellier, France) [17], and Abbott CELL-DYN3000 instruments [12]. CD 3200 monocyte percentage coefficients<strong>of</strong> variation tended to be somewhat higher than thosereported in studies <strong>of</strong> other analyzers, whereas imprecision <strong>of</strong>eosinophil and basophil percentages was slightly lower. However,these differences can possibly be explained by variation in samplecomposition and precision testing techniques and are probably <strong>of</strong>no relevance in routine diagnosis. In our study, CD 3200 precisionwas satisfactory for both normal samples and nonflaggedabnormal samples. Major imprecision was restricted to a minority<strong>of</strong> highly abnormal samples with gross deviations <strong>of</strong> white bloodcell count and leukocyte composition.Regarding accuracy, in the nonflagged specimen group, CD3200 and microscopical leukocyte differential count results wereclosely correlated. Average bias was small for all cell types, the differencesbetween instrument and microscopy values were withinthe statistical confidence limits in most samples, and no specimenwith gross discrepancies could be identified. In contrast, analysis <strong>of</strong>flagged samples gave another picture; systematic bias and a considerableproportion <strong>of</strong> results clearly deviating from referencemicroscopy were observed.For our study, we selected specimens with nonmalignant andmalignant hematologic abnormalities to challenge the CD 3200with a large variety <strong>of</strong> samples known to cause problems in automatedleukocyte differential counting. It should therefore be madeclear that our data set does not represent a sample compositionlikely to be encountered outside <strong>of</strong> specialized hematology units.Although comparisons with other studies are thereby made somewhatmore difficult, the accuracy <strong>of</strong> CD 3200 measurements asTABLE 7. False-Negative CELL-DYN 3200 Results in Samples with Major Morphologic Abnormalities*Study Number Microscopic <strong>Differential</strong> Abnormality CommentE004 14.75% variant lymphocytes, 0.75/100 NRBC Sézary cells, 64.25% total lymphocytes,WBC = 9.4 10 9 /LG003 5% myelocytes, 3.25% metamyelocytes, 0.25% variant lymphocytes WBC = 19.010 9 /LU007 14.25% band cellsU040 6.25% band cellsU110 9.75% band cells WBC = 34.9 10 9 /LU112 3.75% myelocytes, 2% metamyelocytes, 0.25% variant lymphocytesV044 0.25% myelocytes, 0.25% metamyelocytes, 7.5% band cells, 0.25/100 NRBCV070 4.75% myelocytes, 1.25% metamyelocytes, 0.75% variant lymphocytes WBC = 12.4 ( 10 9 /LV097 2.25% myelocytes, 1.75% metamyelocytes, 0.75% variant lymphocytesW005 0.25% promyelocytes, 4.25% myelocytes, 1% metamyelocytes WBC = 23.2 ( 10 9 /LX017 0.25% metamyelocytes, 0.75% variant lymphocytes, 10.75/100 NRBC WBC = 17.710 9 /L, cord blood sample, red blood cellabnormality indicated by CELL-DYN 3200*NRBC indicates nucleated red blood cells;WBC, white blood cells.
12 Sachse et alassessed by systematic bias, standard deviation <strong>of</strong> differences to referencemicroscopy, and regression coefficients largely correspondsto that described for other hematology analyzers, including CoulterSTKS [11,18-20], Bayer Diagnostic H-1 [11,20,21], Sysmex NE-8000 and SE-9000 [20-22], ABX Cobas Argos [17], and AbbottCELL-DYN 3000 and CELL-DYN 3500 instruments [12,23,24].Compared to reference microscopy, efficiency <strong>of</strong> CD 3200 testingwas 88.5% when only morphologic abnormalities were consideredand 90.6% when both morphologic and distributional abnormalitieswere taken into account. Similar diagnostic efficiencieshave been found in some instrument evaluations [14,20], butmost studies report lower values [12,13,19,23,25]. Discrepanciesregarding sample composition and the definition <strong>of</strong> reference(microscopically) abnormal samples are difficult to exclude ascauses for differences between independent studies; however, ourefficiency data were obtained with a large proportion <strong>of</strong> samplesshowing leukocyte abnormalities, and we used a wide definition <strong>of</strong>reference (microscopical) abnormality, including some specimensthat cannot reliably be recognized as abnormal by routinemicroscopy. These factors must be considered, too, when interpretingthe morphologic false-negative ratio <strong>of</strong> 24.7%, which issomewhat above the average <strong>of</strong> other instrument evaluations.However, 12 <strong>of</strong> 23 false-negative results relate to minor abnormalitiesnot reliably recognized by routine microscopy, and, in 4 otherspecimens, the main abnormality was a moderate increase <strong>of</strong> bandcells, which are routinely quantified in our laboratory but were notincluded in many other studies. Moreover, our false-negativeresults included 1 case <strong>of</strong> Sézary syndrome, standing out by itshigh lymphocyte percentage and absolute count, and a cord bloodsample with elevated nucleated red blood cells, which was indicatedby a CD 3200 red blood cell flag. Therefore, false-negativeCD 3200 results, possibly relevant under routine conditions, wereconfined to some cases with left shift, as assessed by moderate rises<strong>of</strong> immature granulocyte or band cell percentages.In conclusion, this evaluation showed that the CD 3200 providesa precise and accurate 5-part white blood cell differential andthat its diagnostic efficiency and flagging performance correspondto those <strong>of</strong> other modern hematology analyzers.ACKNOWLEDGMENTSThe authors thank Ms. E. Arslan and Ms. M. Leifheit for excellenttechnical assistance and Ms. A. Biewener (Medical School Hannover,Department <strong>of</strong> Hematology) for the provision <strong>of</strong> samples.REFERENCES1. Stiene-Martin EA. Introduction to hematologic automation. In: Lotspeich-Steininger CA, Stiene-Martin EA, Koepke JA, eds. Clinical Hematology.Philadelphia: JB Lippincott; 1992:486.2. von Rücker A, Henkel E, Haeckel R, et al. <strong>Evaluation</strong>sprotokoll für hämatologischeZellzähl- und Zelldifferenzierungsgeräte. DG Klin Chem Mitteilungen.1994;25:273.3. England JM, Rowan RM, Van Assendelft OW, et al. International Councilfor Standardization in Haematology: guidelines for the evaluation <strong>of</strong> bloodcell analysers including those used for differential leucocyte and reticulocytecounting and cell marker applications. Clin Lab Haematol.1994;16:157-174.4. National Committee for Clinical Laboratory Standards. Reference leukocytedifferential count (proportional) and evaluation <strong>of</strong> instrumental methods:approved standard. NCCLS H20-A. Villanova, PA; 1992.5. Weber R, Müller HAG. Statistic <strong>of</strong> suspended blood cells: a new approach.Lab Med. 1995;19:243.6. De Grooth BG, Terstappen LWMM, Puppels GJ, Greve J. Light scatteringpolarization measurements as a new parameter in flow cytometry. Cytometry.1987;8:539-544.7. Terstappen LWMM, De Grooth BG, Vissher K, et al. Four-parameterwhite blood cell differential counting based on light scattering measurements.Cytometry. 1988;9:39-43.8. Cornbleet PJ, Myrick D, Judkins S, Levy R. <strong>Evaluation</strong> <strong>of</strong> the CELL-DYN3000 differential. Am J Clin Pathol. 1992;98:603-614.9. Sachse C, Jahns-Streubel G, Henkel E. First clinical evaluation <strong>of</strong> theCELL-DYN( 3200 haematology analyser. Clin Lab Haematol. 1998;20:333-340.10. Passing H, Bablok W. A new biometrical procedure for testing the equality<strong>of</strong> measurements from two different analytical methods: application <strong>of</strong> linearregression procedures for method comparison studies in clinical chemistry.Part 1. J Clin Chem Clin Biochem. 1983;21:709-720.11. Robertson EP, Lai HW, Wei DCC. An evaluation <strong>of</strong> leucocyte analysis onthe Coulter STKS. Clin Lab Haematol. 1992;14:53-68.12. Bentley SA, Johnson A, Bishop CA. A parallel evaluation <strong>of</strong> four automatedhematology analyzers. Am J Clin Pathol. 1993;100:626-632.13. Swaim WR. Laboratory and clinical evaluation <strong>of</strong> white blood cell differentialcounts: comparison <strong>of</strong> the Coulter VCS, Technicon H-1, and 800-cell manual method. Am J Clin Pathol. 1991;95:381-388.14. Billett HH, Simson E, Main P, et al. The MAXM hematology autoanalyzer:an alternative? Am J Clin Pathol. 1994;102:36-44.15. Warner BA, Reardon DM.A field evaluation <strong>of</strong> the Coulter STKS. Am JClin Pathol. 1991;95:207-217.16. Hübl W, Andert S, Bayer PM. <strong>Evaluation</strong> <strong>of</strong> the Sysmex SE-9000( haematologyanalyser. Sysmex J Int. 1995;5:85.17. Sachse C, Baudach A, Tille D, et al. Die mechanische Leukozytendifferenzierungam Cobas Argos-Hämatologie-Analyzer im Vergleich mit demBayer Diagnostic H1 und dem Coulter STKS. Lab Med. 1995;19:9.18. Verheul FEAM, Spitters JMC, Bergmans CHF. <strong>Evaluation</strong> and performance<strong>of</strong> the Coulter STKS. Eur J Clin Chem Clin Biochem. 1993;31:179.19. Cornbleet PJ, Myrick D, Levy <strong>of</strong> the Coulter STKS five-part differential.Am J Clin Pathol. 1993;99:72-81.20. Katz N, Grundhöfer G. Möglichkeiten und Grenzen durchflußzytometrischerDifferenzierung - Vergleich verschiedener Meßverfahren. KlinLab. 1993;39:329.21. Devreese K, De Logi E, Francart C, et al. <strong>Evaluation</strong> <strong>of</strong> the automatedhaematology analyser Sysmex NE-8000. Eur J Clin Chem Clin Biochem.1991;29:339.22. Besson I, Jou JM, Villamor N, et al. <strong>Differential</strong> leukocyte count (DLC)performance evaluation <strong>of</strong> the Sysmex SE-9000 hematology workstation.Lab Hematol. 1996;2:22.23. Iles-Mann J, Henniker J. An evaluation <strong>of</strong> the differential from the AbbottCELL-DYN 3500 in a population <strong>of</strong> patients with haematological abnormalities.Clin Lab Haematol. 1997;19:191-196.24. Al-Ismail SA, Bond K, Carter AB, et al. Two-centre evaluation <strong>of</strong> the AbbottCELL-DYN 3500 blood counter. Clin Lab Haematol. 1995;17:11-21.25. Korninger L, Mustafa G, Schwarzinger I. The haematology analyser SF-3000: performance <strong>of</strong> the automated white blood cell differential count incomparison to the haematology analyser NE-1500. Clin Lab Haematol.1998;20:81-86.