Infection Prevention Update - The Royal Wolverhampton Hospitals ...
Infection Prevention Update - The Royal Wolverhampton Hospitals ...
Infection Prevention Update - The Royal Wolverhampton Hospitals ...

You also want an ePaper? Increase the reach of your titles
YUMPU automatically turns print PDFs into web optimized ePapers that Google loves.
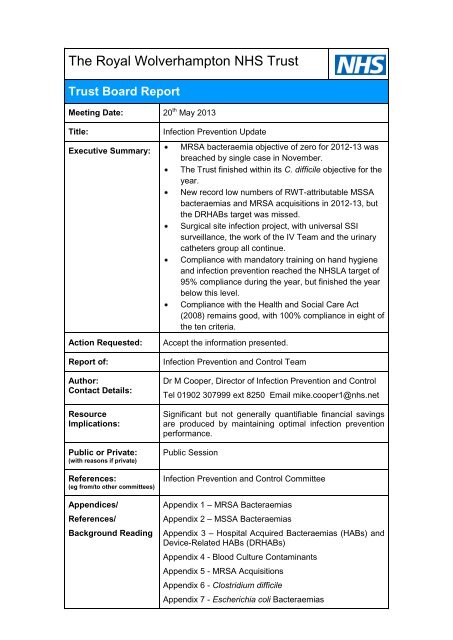
<strong>The</strong> <strong>Royal</strong> <strong>Wolverhampton</strong> NHS Trust<br />
Trust Board Report<br />
Meeting Date: 20 th May 2013<br />
Title:<br />
Executive Summary:<br />
Action Requested:<br />
Report of:<br />
Author:<br />
Contact Details:<br />
Resource<br />
Implications:<br />
Public or Private:<br />
(with reasons if private)<br />
References:<br />
(eg from/to other committees)<br />
Appendices/<br />
References/<br />
Background Reading<br />
<strong>Infection</strong> <strong>Prevention</strong> <strong>Update</strong><br />
MRSA bacteraemia objective of zero for 2012-13 was<br />
breached by single case in November.<br />
<strong>The</strong> Trust finished within its C. difficile objective for the<br />
year.<br />
New record low numbers of RWT-attributable MSSA<br />
bacteraemias and MRSA acquisitions in 2012-13, but<br />
the DRHABs target was missed.<br />
Surgical site infection project, with universal SSI<br />
surveillance, the work of the IV Team and the urinary<br />
catheters group all continue.<br />
Compliance with mandatory training on hand hygiene<br />
and infection prevention reached the NHSLA target of<br />
95% compliance during the year, but finished the year<br />
below this level.<br />
Compliance with the Health and Social Care Act<br />
(2008) remains good, with 100% compliance in eight of<br />
the ten criteria.<br />
Accept the information presented.<br />
<strong>Infection</strong> <strong>Prevention</strong> and Control Team<br />
Dr M Cooper, Director of <strong>Infection</strong> <strong>Prevention</strong> and Control<br />
Tel 01902 307999 ext 8250 Email mike.cooper1@nhs.net<br />
Significant but not generally quantifiable financial savings<br />
are produced by maintaining optimal infection prevention<br />
performance.<br />
Public Session<br />
<strong>Infection</strong> <strong>Prevention</strong> and Control Committee<br />
Appendix 1 – MRSA Bacteraemias<br />
Appendix 2 – MSSA Bacteraemias<br />
Appendix 3 – Hospital Acquired Bacteraemias (HABs) and<br />
Device-Related HABs (DRHABs)<br />
Appendix 4 - Blood Culture Contaminants<br />
Appendix 5 - MRSA Acquisitions<br />
Appendix 6 - Clostridium difficile<br />
Appendix 7 - Escherichia coli Bacteraemias
Title: <strong>Infection</strong> <strong>Prevention</strong> and Control<br />
Appendix 8 - Compliance with <strong>Infection</strong> <strong>Prevention</strong><br />
Mandatory Training<br />
Appendix 9 - Compliance with the Code of Practice<br />
Appendix 10 - Current Projects and Norovirus Outbreak<br />
NHS Constitution:<br />
(How it impacts on any<br />
decision-making)<br />
In determining this matter, the Board should have regard to<br />
the Core principles contained in the Constitution of:<br />
Equality of treatment and access to services<br />
High standards of excellence and professionalism<br />
Service user preferences<br />
Cross community working<br />
Best Value<br />
Accountability through local influence and scrutiny<br />
Background Details<br />
1 1. <strong>The</strong> Trust external targets for 2012-13 were: MRSA bacteraemia - 0 and<br />
Clostridium difficile toxin positives - 57. <strong>The</strong>se targets apply to New Cross<br />
Hospital only. Local commissioners set an additional target for West Park<br />
Hospital of 12 C. difficile toxin positive cases per year, which means<br />
Monitor accepted a target of 69 cases for RWT.<br />
National mandatory surveillance of MSSA and E. coli bacteraemias is<br />
undertaken, though no external targets were set for these. <strong>The</strong>re was,<br />
however, an internal target for MSSA bacteraemias, along with internal<br />
targets for C. difficile PCR positives (which includes recently discharged<br />
patients in addition to in-patients), and device-related hospital acquired<br />
bacteraemias (DRHABs). Admission screening for MRSA carriage allows<br />
us to monitor the number of MRSA acquisitions that occur, and monthly<br />
targets are set for this for the organization, each clinical Division and every<br />
ward.<br />
Compliance with <strong>Infection</strong> <strong>Prevention</strong> elements of mandatory training,<br />
relevant High Impact Interventions and other measures are monitored<br />
monthly at the <strong>Infection</strong> <strong>Prevention</strong> and Control Committee.<br />
Compliance with the Code of Practice is monitored through ‘Health Assure’<br />
(formally called Performance Accelerator).<br />
Details of the above can be seen in the Appendices.<br />
Page 2 of 14
Apr-12<br />
May-12<br />
Jun-12<br />
Jul-12<br />
Aug-12<br />
Sep-12<br />
Oct-12<br />
Nov-12<br />
Dec-12<br />
Jan-13<br />
Feb-13<br />
Mar-13<br />
Number<br />
Title: <strong>Infection</strong> <strong>Prevention</strong> and Control<br />
Appendix 1 – MRSA Bacteraemias<br />
MRSA bacteraemias – monthly totals (and attributable to RWT)<br />
11-12<br />
(RWT)<br />
12-13<br />
(RWT)<br />
Apr May Jun Jul Aug Sep Oct Nov Dec Jan Feb Mar<br />
0 1 0 0 0 1 0 0 0 0 0 0<br />
(0) (0) (0) (0) (0) (0) (0) (0) (0) (0) (0) (0)<br />
0 0 0 0 2 1 0 1 2 0 0 0<br />
(0) (0) (0) (0) (0) (1) (0) (0) (0) (0) (0) (0)<br />
Annual target 2012-13 = 0 for RWHT; 2 for <strong>Wolverhampton</strong> PCT<br />
Total for 2012-13 = 1 for RWHT; 2 for <strong>Wolverhampton</strong> PCT<br />
Of the six MRSA bacteraemias in the above table, five were pre-48 hour cases, but<br />
two of these were in patients who had had recent in-patient care in New Cross. <strong>The</strong><br />
one post-48 hour cases was classified as unavoidable after an RCA was carried out.<br />
6<br />
Performance Against Target MRSA Bacteraemias 2012 -<br />
2013<br />
5<br />
4<br />
3<br />
2<br />
1<br />
RWT<br />
Target<br />
RWT<br />
Performance<br />
PCT<br />
Target<br />
PCT<br />
Performance<br />
0<br />
Page 3 of 14
April<br />
May<br />
June<br />
July<br />
August<br />
September<br />
October<br />
November<br />
December<br />
January<br />
February<br />
March<br />
Number<br />
Apr-12<br />
May-12<br />
Jun-12<br />
Jul-12<br />
Aug-12<br />
Sep-12<br />
Oct-12<br />
Nov-12<br />
Dec-12<br />
Jan-13<br />
Feb-13<br />
Mar-13<br />
Number<br />
Title: <strong>Infection</strong> <strong>Prevention</strong> and Control<br />
Appendix 2 – MSSA Bacteraemias<br />
MSSA bacteraemias – totals and number attributable to RWT<br />
Apr May Jun Jul Aug Sep Oct Nov Dec Jan Feb Mar<br />
11-12<br />
(RWT)<br />
2<br />
(1)<br />
5<br />
(1)<br />
2<br />
(2)<br />
5<br />
(5)<br />
6<br />
(6)<br />
4<br />
(2)<br />
8<br />
(4)<br />
9<br />
(5)<br />
2<br />
(1)<br />
5<br />
(3)<br />
3<br />
(1)<br />
3<br />
(2)<br />
12-13<br />
(RWT)<br />
4<br />
(4)<br />
3<br />
(1)<br />
4<br />
(0)<br />
8<br />
(5)<br />
10<br />
(4)<br />
6<br />
(4)<br />
5<br />
(3)<br />
4<br />
(0)<br />
4<br />
(2)<br />
5<br />
(2)<br />
5<br />
(2)<br />
4<br />
(2)<br />
35<br />
Performance Against Target MSSA Bacteraemias 2012 -<br />
2013<br />
30<br />
25<br />
20<br />
15<br />
10<br />
Target<br />
2012-13<br />
Performance<br />
2012-<br />
13<br />
5<br />
0<br />
We finished within our internal target of 30 RWT-attributable MSSA bacteraemias for<br />
2012-13, with 29, which is the lowest total since we began collecting this data. Of the<br />
29 cases during the year, 18 were related to IV lines (seven Renal, seven<br />
Haematology / Oncology, one NNU, 1 CCU, two ‘others’); eight were secondary to<br />
skin or soft tissue infections (no surgical site infections); one was related to a urinary<br />
catheter; one was a contaminant and there was one of unknown source.<br />
100<br />
90<br />
80<br />
70<br />
60<br />
50<br />
40<br />
30<br />
20<br />
10<br />
0<br />
Cumulative RWT-Attributable MSSA Bacteraemias from<br />
April 2005<br />
2005-06<br />
2006-07<br />
2007-08<br />
2008-09<br />
2009-10<br />
2010-11<br />
2011-12<br />
2012-13<br />
Page 4 of 14
Apr-12<br />
May-12<br />
Jun-12<br />
Jul-12<br />
Aug-12<br />
Sep-12<br />
Oct-12<br />
Nov-12<br />
Dec-12<br />
Jan-13<br />
Feb-13<br />
Mar-13<br />
Number<br />
Title: <strong>Infection</strong> <strong>Prevention</strong> and Control<br />
Appendix 3 – Hospital Acquired Bacteraemias (HABs) and Device-Related<br />
HABs (DRHABs)<br />
<strong>The</strong> number of HABs and DRHABs are monitored internally. We set an internal<br />
target of 84 DRHABs for the year. <strong>The</strong> graph below shows our performance against<br />
the target for 2012-13. No target was set for HABs.<br />
Hospital Acquired and Device-Related Hospital Acquired<br />
Bacteraemias 2012 - 13<br />
40<br />
35<br />
30<br />
25<br />
20<br />
15<br />
10<br />
HABs<br />
DRHABs<br />
Target for<br />
DRHABs<br />
5<br />
0<br />
<strong>The</strong>re were 100 DRHABs overall during the year, which is an increase on last year’s<br />
total of 93. <strong>The</strong> sources of the DRHABs is shown in the table. <strong>The</strong> IV Team became<br />
operational in September 2012 and it was hoped that there would be a significant<br />
reduction in the number of line-associated DRHABs over the rest of the year.<br />
Unfortunately this has not yet been seen, principally because most of the lineassociated<br />
DRHABs have been in areas, such as renal dialysis and Haematology,<br />
where the IV Team are not responsible for placing the lines. Work is being<br />
undertaken in these areas to try to reduce the number of such infections. <strong>The</strong> Trust<br />
had a CQUIN around urinary catheter management, and considerable work has been<br />
undertaken both in the hospital and community to reduce the number of infections<br />
related to these devices.<br />
Devices Associated with DRHABs 2012-13<br />
Apr<br />
12<br />
May<br />
12<br />
Jun<br />
12<br />
Jul<br />
12<br />
Aug<br />
12<br />
Sep<br />
12<br />
Oct<br />
12<br />
Nov<br />
12<br />
Dec<br />
12<br />
Jan<br />
13<br />
Feb<br />
13<br />
Mar<br />
13<br />
B/C taken 966 1062 1035 1051 915 980 1052 978 1152 1107 1014 1119<br />
B/C positives 96 99 83 88 76 80 93 72 97 93 75 98<br />
B/C significant 67 68 69 69 60 62 70 52 74 64 56 62<br />
Contaminants 29 31 14 19 16 18 23 20 23 29 19 36<br />
HABs 29 24 29 25 21 31 35 20 28 29 21 25<br />
DRHABs 6 3 11 9 10 15 9 4 11 10 6 6<br />
IV Lines 5 2 10 7 8 7 7 2 9 5 5 6<br />
Urinary cath 1 1 0 2 1 6 1 2 2 3 1 0<br />
VAP 0 0 0 0 0 0 0 0 0 1 0 0<br />
Nephrostomy 0 0 1 0 0 2 1 0 0 0 0 0<br />
?VAP/?Line 0 0 0 0 1 0 0 0 0 0 0 0<br />
?Line / ?PEG 0 0 0 0 0 0 0 0 0 1 0 0<br />
Page 5 of 14
Apr-Jun 08<br />
Jul-Sep 08<br />
Oct-Dec 08<br />
Jan-Mar 09<br />
Apr-Jun 09<br />
Jul-Sep 09<br />
Oct-Dec 09<br />
Jan-Mar 10<br />
Apr-Jun 10<br />
Jul-Sep 10<br />
Oct-Dec 10<br />
Jan-Mar 11<br />
Apr-Jun 11<br />
Jul-Sep 11<br />
Oct-Dec 11<br />
Jan-Mar 12<br />
Apr-Jun 12<br />
Jul-Sep 12<br />
Oct-Dec 12<br />
Jan-Mar 13<br />
Percentage Contaminants<br />
Title: <strong>Infection</strong> <strong>Prevention</strong> and Control<br />
Appendix 4 - Blood Culture Contaminants<br />
Contaminated blood cultures are a common problem which can lead to unnecessary<br />
patient investigations, prolonging the in-patient stay and wasting resources. In<br />
addition, antibiotics may be given to treat these pseudo-bacteraemias, increasing the<br />
risk of complications, such as C. difficile. <strong>The</strong> blood culture Phlebotomy Team<br />
enables the majority of blood cultures to be taken by dedicated staff fully trained in<br />
the necessary techniques. This has resulted in a substantial reduction in the number<br />
and rate of blood culture contaminants. In 2008-09, the average blood culture<br />
contamination rate was 5.64 percent; in 2012-13 it was 2.21 percent. <strong>The</strong>re is no<br />
standard for this measure in the UK, but in the USA 3% is the generally agreed<br />
standard.<br />
7<br />
Percentage of Contaminated Blood Culture Sets by<br />
Quarter<br />
6<br />
5<br />
4<br />
3<br />
2<br />
1<br />
0<br />
Page 6 of 14
April<br />
May<br />
June<br />
July<br />
August<br />
September<br />
October<br />
November<br />
December<br />
January<br />
February<br />
March<br />
Number<br />
Durnall Unit<br />
Deanesly<br />
CHU<br />
A4 / Gynae<br />
A5/A6D/S…<br />
PAU/C1/C2 /…<br />
NNU<br />
CTW<br />
Cardiology…<br />
Critical Care<br />
D1 / A12<br />
D2 / A14<br />
D3 / A9<br />
D4 / A10<br />
VSU / B7<br />
D5 / A5<br />
D6 / A6<br />
EAU / AMU<br />
Stroke Unit<br />
RDU/CAPD<br />
D22 / C22<br />
D8 / A8<br />
D15 / C24<br />
D16 / C25<br />
D17 / C15<br />
D18 / C16<br />
D19 / C18<br />
D20 / C19<br />
D21 / C17<br />
D7 / A7<br />
West Park<br />
Number<br />
Title: <strong>Infection</strong> <strong>Prevention</strong> and Control<br />
Appendix 5 - MRSA Acquisitions<br />
<strong>The</strong> screening of all admissions to RWT has enabled the acquisition of MRSA in the<br />
hospital to be monitored. <strong>The</strong> first graph shows the wards where MRSA acquisitions<br />
were found to have occurred in 2012-13. All wards that have had clusters of cases<br />
have had meetings with and additional input from the <strong>Infection</strong> <strong>Prevention</strong> Team.<br />
This has led to a resolution of the problem in all cases. <strong>The</strong> second graph shows the<br />
cumulative MRSA acquisition numbers for the Trust over the past few years. It can<br />
be seen that a new record low total was set in 2012-13<br />
MRSA Acquisitions 2012-2013<br />
10<br />
8<br />
6<br />
4<br />
2<br />
0<br />
Mar-13<br />
Feb-13<br />
Jan-13<br />
Dec-12<br />
Nov-12<br />
Oct-12<br />
Sep-12<br />
Aug-12<br />
Jul-12<br />
Jun-12<br />
May-12<br />
Apr-12<br />
200<br />
180<br />
160<br />
140<br />
120<br />
100<br />
80<br />
60<br />
40<br />
20<br />
0<br />
Cumulative RWT -Attributable MRSA Acquisitions from<br />
April 2008<br />
2008-09<br />
2009-10<br />
2010-11<br />
2011-12<br />
2012-13<br />
Page 7 of 14
Apr-12<br />
May-12<br />
Jun-12<br />
Jul-12<br />
Aug-12<br />
Sep-12<br />
Oct-12<br />
Nov-12<br />
Dec-12<br />
Jan-13<br />
Feb-13<br />
Mar-13<br />
Number<br />
Title: <strong>Infection</strong> <strong>Prevention</strong> and Control<br />
Appendix 6 - Clostridium difficile<br />
New Cross West Park W’ton PCT RWT PCR<br />
toxin positive<br />
(target)<br />
toxin positive<br />
(target)<br />
toxin positive<br />
(target)<br />
positive<br />
(target)<br />
Apr 2012 2 (5) 0 (1) 4 (7) 9 (9)<br />
May 2012 6 (5) 0 (1) 7 (7) 19 (9)<br />
Jun 2012 2 (4) 1 (1) 4 (6) 14 (9)<br />
Jul 2012 5 (5) 2 (1) 10 (7) 11 (9)<br />
Aug 2012 4 (5) 0 (1) 7 (7) 10 (9)<br />
Sep 2012 4 (4) 0 (1) 5 (6) 12 (9)<br />
Oct 2012 5 (5) 0 (1) 6 (7) 13 (9)<br />
Nov 2012 2 (5) 0 (1) 3 (7) 13 (9)<br />
Dec 2012 4 (4) 0 (1) 2 (6) 8 (9)<br />
Jan 2012 2 (5) 0 (1) 6 (7) 8 (9)<br />
Feb 2012 2 (5) 0 (1) 7 (7) 8 (9)<br />
Mar 2012 2 (4) 1 (1) 4 (6) 11 (9)<br />
Totals (Target) 40 (57) 4 (12) 65 (80) 136 (108)<br />
<strong>The</strong> New Cross and West Park <strong>Hospitals</strong> and PCT external targets refer to the<br />
figures based on the national definition of C. difficile cases introduced from April<br />
2012. It can be seen that New Cross, West Park and <strong>Wolverhampton</strong> PCT all<br />
finished the year within their targets. <strong>The</strong> <strong>Wolverhampton</strong> PCT figure, however, does<br />
not include any patients diagnosed in other laboratories and therefore may not be<br />
complete. <strong>The</strong> targets set for the year 2013-14 are 39 for RWT (including West Park<br />
Hospital cases) and 65 for <strong>Wolverhampton</strong> CCG.<br />
C. difficile Toxin Positives and Targets 2012 - 13<br />
100<br />
RWT<br />
80<br />
RWT Target<br />
60<br />
West Park<br />
Hospital<br />
40<br />
20<br />
West Park<br />
Hospital<br />
Target<br />
Wolves PCT<br />
PCT Target<br />
0<br />
<strong>The</strong> RWHT Internal Target figure is set against our own definition of attribution which<br />
includes patients who have recently been discharged from RWT, and is based on<br />
PCR test results, which is a measure of colonisation with the organism and therefore<br />
the spread of C. difficile, rather than with clinical disease. <strong>The</strong> target was an<br />
ambition based on results from the previous year, when the same testing method<br />
was employed. It is a concern that this target was exceeded by over 25%. <strong>The</strong><br />
second graph below shows the comparison between 2012-13 and 2011-12. <strong>The</strong><br />
Page 8 of 14
Apr<br />
May<br />
Jun<br />
Jul<br />
Aug<br />
Sep<br />
Oct<br />
Nov<br />
Dec<br />
Jan<br />
Feb<br />
Mar<br />
Number<br />
Apr-12<br />
May-12<br />
Jun-12<br />
Jul-12<br />
Aug-12<br />
Sep-12<br />
Oct-12<br />
Nov-12<br />
Dec-12<br />
Jan-13<br />
Feb-13<br />
Mar-13<br />
Number<br />
Title: <strong>Infection</strong> <strong>Prevention</strong> and Control<br />
decrease in the total was less than 7%. New strategies are probably needed if this<br />
number is to be further reduced.<br />
160<br />
140<br />
120<br />
Cumulative C. difficile PCR Positives and RWT Internal<br />
Target 2012-13<br />
100<br />
80<br />
60<br />
RWT Target<br />
RWT<br />
40<br />
20<br />
0<br />
Cumulative C. difficile PCR Positives 2011-12 and 2012-<br />
13<br />
160<br />
140<br />
120<br />
100<br />
80<br />
60<br />
RWT 2011-12<br />
RWT 2012-13<br />
40<br />
20<br />
0<br />
Page 9 of 14
Number of E.coli bacteraemias<br />
Number of E.coli bacteraemias<br />
Title: <strong>Infection</strong> <strong>Prevention</strong> and Control<br />
Appendix 7 - Escherichia coli Bacteraemias<br />
National mandatory reporting of all E. coli bacteraemias began in June 2011, though<br />
locally we have robust data from April 2009. <strong>The</strong> Accountability Framework for NHS<br />
Trust Boards states that E. coli bacteraemias should be reported as part of each<br />
organisation’s Quality and Governance indicators. <strong>The</strong> first graph below gives the<br />
annual totals for E. coli bacteraemias for those that occurred in RWT in-patients and<br />
for those found on admission. <strong>The</strong> majority of cases are admitted with it.<br />
Number and Source of E.coli Bacteraemias From April 2009<br />
160<br />
140<br />
120<br />
100<br />
80<br />
60<br />
RWTattributable<br />
Non-RWTattributable<br />
40<br />
20<br />
0<br />
2009-10 2010-11 2011-12 2012-13<br />
Of the RWT-attributable cases, it is likely that realistically only the DRHAB-related<br />
cases are preventable, although it is unlikely that all of these are actually<br />
preventable. <strong>The</strong> second graph shows the number of HABs (excluding DRHABs)<br />
and DRHABs for each year for the RWT-attributable cases. This suggests that<br />
overall less than 8% of E. coli bacteraemias are possibly preventable.<br />
E.coli Bacteraemias - HABs and DRHABs From April 2009<br />
100<br />
90<br />
80<br />
70<br />
60<br />
50<br />
40<br />
30<br />
20<br />
10<br />
0<br />
2009-10 2010-11 2011-12 2012-13<br />
HABs<br />
(excluding<br />
DRHABs)<br />
DRHABs<br />
Page 10 of 14
Administrative<br />
& Clerical<br />
Ancillary<br />
Building &<br />
Engineering<br />
Allied Health<br />
Professions…<br />
Nursing &<br />
Midwifery &…<br />
Scientific &<br />
Technical &…<br />
Medical &<br />
Dental<br />
Senior<br />
Managers<br />
TRUST<br />
TOTAL<br />
Administrative & Clerical<br />
(1321)<br />
Ancillary (636)<br />
Building & Engineering<br />
(59)<br />
Allied Health Professions &<br />
Support Staff (468)<br />
Nursing & Midwifery<br />
Tranined (1884)<br />
Nursing & Midwifery<br />
Untranined (658)<br />
Scientific & Technical &<br />
Support Staff (38)<br />
Technicians/Healthcare<br />
Scientists (539)<br />
Medical & Dental (605)<br />
Senior Managers and NEDs<br />
(174)<br />
TRUST TOTAL (6295)<br />
Percentage<br />
Title: <strong>Infection</strong> <strong>Prevention</strong> and Control<br />
Appendix 8 - Compliance with <strong>Infection</strong> <strong>Prevention</strong> Mandatory Training<br />
Hand Hygiene and <strong>Infection</strong> <strong>Prevention</strong> Training and Hand Hygiene<br />
Competency Assessment<br />
100.0%<br />
95.0%<br />
Uptake of Hand Hygiene and <strong>Infection</strong> <strong>Prevention</strong><br />
Training at March 31st 2013 by Professional Groups<br />
Training<br />
90.0%<br />
85.0%<br />
Hand<br />
Hygiene<br />
Assessment<br />
Target<br />
80.0%<br />
75.0%<br />
RWHT Uptake of Hand Hygiene Training 31st March 2007<br />
to 2013<br />
100%<br />
90%<br />
80%<br />
70%<br />
60%<br />
50%<br />
40%<br />
30%<br />
20%<br />
10%<br />
0%<br />
31.03.07<br />
31.03.08<br />
31.03.09<br />
31.03.10<br />
31.03.11<br />
31.03.12<br />
31.03.13<br />
Page 11 of 14
Percentage<br />
Title: <strong>Infection</strong> <strong>Prevention</strong> and Control<br />
NHSLA requires that hand hygiene training compliance is at least 95% to match level 3<br />
requirements. <strong>The</strong> first graph shows that several staff groups have to improve their<br />
training compliance levels to achieve this. Overall compliance was 92.5% at the end of<br />
March, which is the lowest since July 2012 and a marked deterioration from the 95.6%<br />
achieved in October 2012. Once again, the groups that are potentially the most<br />
concerning are ‘Medical and Dental’ and both of the ‘Nursing and Midwifery’ groups; it is<br />
important the compliance of these groups improves and this improvement is maintained.<br />
<strong>The</strong> second graph, however, shows how the compliance at the end of 2012-13 was higher<br />
than has been achieved in any previous years.<br />
Antimicrobial Prescriber Training<br />
Uptake of Antimicrobial Prescriber Training<br />
100<br />
90<br />
80<br />
70<br />
60<br />
30.05.07<br />
31.03.08<br />
31.03.09<br />
50<br />
40<br />
30<br />
20<br />
31.03.10<br />
31.03.11<br />
31.03.12<br />
31.03.13<br />
10<br />
0<br />
Division 1 Division 2 Total<br />
NHSLA requires that antimicrobial prescriber training compliance is at least 95% to match<br />
level 3 requirements. While the current compliance level is higher than at the end of<br />
either of the previous two years, it is still below the 95% target. <strong>The</strong> Antimicrobial<br />
Stewardship Group is exploring different methods of delivering training and assessing<br />
competence. Training and compliance with training was a key element of the<br />
Antimicrobial CQUIN that the Trust was set this year. <strong>The</strong> Trust achieved all of the CQIN<br />
objectives.<br />
Page 12 of 14
Title: <strong>Infection</strong> <strong>Prevention</strong> and Control<br />
Appendix 9 - Compliance with the Code of Practice for the <strong>Prevention</strong> and<br />
Control of Healthcare Associated <strong>Infection</strong>s (2008)<br />
Criterion 01: Systems to manage and monitor the prevention and HCAI Self<br />
control of infection. <strong>The</strong>se systems use risk assessments and Assessment<br />
consider how susceptible service users are and any risks that their Rating: Green<br />
environment and other users may pose to them.<br />
Criterion 02: Provide and maintain a clean and appropriate HCAI Self<br />
environment in managed premises that facilitates the prevention Assessment<br />
and control of infections.<br />
Rating: Yellow<br />
Criterion 03: Provide suitable accurate information on infections to<br />
service users and their visitors.<br />
HCAI Self<br />
Assessment<br />
Rating: Green<br />
Criterion 04: Provide suitable accurate information on infections to HCAI Self<br />
any person concerned with providing further support or Assessment<br />
nursing/medical care in a timely fashion.<br />
Rating: Green<br />
Criterion 05: Ensure that people who have or develop an infection HCAI Self<br />
are identified promptly and receive the appropriate treatment and Assessment<br />
care to reduce the risk of passing on the infection to other people. Rating: Green<br />
Criterion 06: Ensure that all staff and those employed to provide HCAI Self<br />
care in all settings are fully involved in the process of preventing Assessment<br />
and controlling infection.<br />
Rating: Green<br />
Criterion 07: Provide or secure adequate isolation facilities.<br />
Criterion 08: Secure adequate access to laboratory support as<br />
appropriate.<br />
HCAI Self<br />
Assessment<br />
Rating: Green<br />
HCAI Self<br />
Assessment<br />
Rating: Green<br />
Criterion 09: Have and adhere to policies, designed for the HCAI Self<br />
individuals care and provider organisations, that will help to prevent Assessment<br />
and control infections.<br />
Rating: Amber<br />
Criterion 10: Ensure, so far as is reasonably practicable, that care HCAI Self<br />
workers are free of and are protected from exposure to infections Assessment<br />
that can be caught at work and that all staff are suitably educated in Rating: Green<br />
the prevention and control of infection associated with the provision<br />
of health and social care.<br />
Actions are underway to achieve full compliance and it expected this will be achieved over<br />
the next three months. <strong>The</strong> areas where we are not fully compliant with relate to the<br />
Waste Policy, decontamination and the use of safe sharps.<br />
Page 13 of 14
Title: <strong>Infection</strong> <strong>Prevention</strong> and Control<br />
Appendix 10 - Current Projects and Norovirus Outbreak<br />
IV Team (incorporating OPAT – Outpatient Parenteral Antimicrobial <strong>The</strong>rapy) –<br />
intravenous lines are the single biggest risk factor for RWHT-acquired MSSA<br />
bacteraemias and DRHABs. <strong>The</strong> purpose of the IV Team is to reduce line-related<br />
infections to an irreducible minimum and eliminate all avoidable infections related to these<br />
devices. Since the introduction of the IV Team (from September 2012), most line-related<br />
infections have been in patient groups the IV Team does not directly access (Renal,<br />
Haematology and some Oncology), and the number of DRHABs related to lines has not<br />
decreased as had been hoped. <strong>The</strong> experience being gained by the line team is now<br />
being used to reduce line-associated infections in these areas. <strong>The</strong> OPAT work has been<br />
a huge success in enabling earlier discharge of patients from hospital, or admission<br />
avoidance.<br />
Urinary Catheter Working Group - the second commonest cause of device-related<br />
bacteraemias is urinary catheters. <strong>The</strong> district-wide Urinary Catheter Group is reviewing<br />
all aspects of urinary catheter use and care. <strong>The</strong> aim of this group is to ensure these<br />
devices are only used when absolutely necessary and when they are used that they are<br />
inserted and used optimally to reduce the risk of infections. <strong>The</strong> greatest impact is likely<br />
to result from a reduction in both the number of catheters inserted and the duration that<br />
these devices are left in-situ.<br />
Surgical Site <strong>Infection</strong> Surveillance - the Surgical Site <strong>Infection</strong> project is underway,<br />
collecting data from all appropriate surgical interventions in RWHT and trialling what is<br />
considered to be the optimal surgical skin preparation across almost all surgical<br />
specialties in the Trust.<br />
Norovirus Outbreak<br />
Norovirus outbreaks hit the UK earlier in the winter of 2012-13 than in the previous year<br />
and continued into the Spring. This pattern was seen in <strong>Wolverhampton</strong> and both RWT<br />
and local care homes experienced outbreaks of suspected and proven norovirus. Entire<br />
ward closures were rare and the number of beds blocked due to norovirus was kept to a<br />
minimum, particularly due to the introduction of in-house molecular amplification testing<br />
for norovirus. Extensive use of hydrogen peroxide environmental decontamination was<br />
also a key element in the control strategy. Through the support given by the <strong>Infection</strong><br />
<strong>Prevention</strong> Team, admissions related to norovirus from affected <strong>Wolverhampton</strong> care<br />
homes were once again minimal this winter.<br />
Page 14 of 14