RESIDENTIAL GROWTH STRATEGY - Palmerston North City Council
RESIDENTIAL GROWTH STRATEGY - Palmerston North City Council
RESIDENTIAL GROWTH STRATEGY - Palmerston North City Council

Create successful ePaper yourself
Turn your PDF publications into a flip-book with our unique Google optimized e-Paper software.
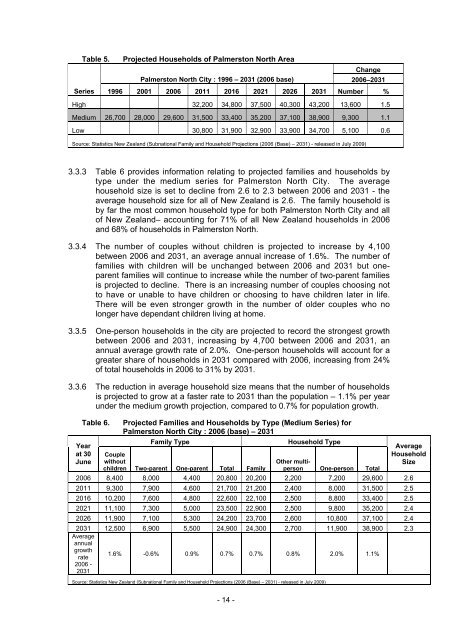
Table 5. Projected Households of <strong>Palmerston</strong> <strong>North</strong> Area<br />
Change<br />
<strong>Palmerston</strong> <strong>North</strong> <strong>City</strong> : 1996 – 2031 (2006 base) 2006–2031<br />
Series 1996 2001 2006 2011 2016 2021 2026 2031 Number %<br />
High 32,200 34,800 37,500 40,300 43,200 13,600 1.5<br />
Medium 26,700 28,000 29,600 31,500 33,400 35,200 37,100 38,900 9,300 1.1<br />
Low 30,800 31,900 32,900 33,900 34,700 5,100 0.6<br />
Source: Statistics New Zealand (Subnational Family and Household Projections (2006 (Base) – 2031) - released in July 2009)<br />
3.3.3 Table 6 provides information relating to projected families and households by<br />
type under the medium series for <strong>Palmerston</strong> <strong>North</strong> <strong>City</strong>. The average<br />
household size is set to decline from 2.6 to 2.3 between 2006 and 2031 - the<br />
average household size for all of New Zealand is 2.6. The family household is<br />
by far the most common household type for both <strong>Palmerston</strong> <strong>North</strong> <strong>City</strong> and all<br />
of New Zealand– accounting for 71% of all New Zealand households in 2006<br />
and 68% of households in <strong>Palmerston</strong> <strong>North</strong>.<br />
3.3.4 The number of couples without children is projected to increase by 4,100<br />
between 2006 and 2031, an average annual increase of 1.6%. The number of<br />
families with children will be unchanged between 2006 and 2031 but oneparent<br />
families will continue to increase while the number of two-parent families<br />
is projected to decline. There is an increasing number of couples choosing not<br />
to have or unable to have children or choosing to have children later in life.<br />
There will be even stronger growth in the number of older couples who no<br />
longer have dependant children living at home.<br />
3.3.5 One-person households in the city are projected to record the strongest growth<br />
between 2006 and 2031, increasing by 4,700 between 2006 and 2031, an<br />
annual average growth rate of 2.0%. One-person households will account for a<br />
greater share of households in 2031 compared with 2006, increasing from 24%<br />
of total households in 2006 to 31% by 2031.<br />
3.3.6 The reduction in average household size means that the number of households<br />
is projected to grow at a faster rate to 2031 than the population – 1.1% per year<br />
under the medium growth projection, compared to 0.7% for population growth.<br />
Table 6.<br />
Year<br />
at 30<br />
June<br />
Projected Families and Households by Type (Medium Series) for<br />
<strong>Palmerston</strong> <strong>North</strong> <strong>City</strong> : 2006 (base) – 2031<br />
Family Type<br />
Couple<br />
without<br />
children Two-parent One-parent Total Family<br />
Household Type<br />
Other multiperson<br />
One-person Total<br />
Average<br />
Household<br />
Size<br />
2006 8,400 8,000 4,400 20,800 20,200 2,200 7,200 29,600 2.6<br />
2011 9,300 7,900 4,600 21,700 21,200 2,400 8,000 31,500 2.5<br />
2016 10,200 7,600 4,800 22,600 22,100 2,500 8,800 33,400 2.5<br />
2021 11,100 7,300 5,000 23,500 22,900 2,500 9,800 35,200 2.4<br />
2026 11,900 7,100 5,300 24,200 23,700 2,600 10,800 37,100 2.4<br />
2031 12,500 6,900 5,500 24,900 24,300 2,700 11,900 38,900 2.3<br />
Average<br />
annual<br />
growth<br />
rate<br />
2006 -<br />
2031<br />
1.6% -0.6% 0.9% 0.7% 0.7% 0.8% 2.0% 1.1%<br />
Source: Statistics New Zealand (Subnational Family and Household Projections (2006 (Base) – 2031) - released in July 2009)<br />
- 14 -