Methods to test discrete semiconductors in 1149.4 environment
Methods to test discrete semiconductors in 1149.4 environment
Methods to test discrete semiconductors in 1149.4 environment

You also want an ePaper? Increase the reach of your titles
YUMPU automatically turns print PDFs into web optimized ePapers that Google loves.
1<br />
<strong>Methods</strong> <strong>to</strong> <strong>test</strong> <strong>discrete</strong> semiconduc<strong>to</strong>rs <strong>in</strong><br />
<strong>1149.4</strong> <strong>environment</strong><br />
Jari Hannu and Markku Moilanen<br />
Op<strong>to</strong>electronics and Measurement Techniques Labora<strong>to</strong>ry and<br />
EMPART Research Group of Infotech Oulu,<br />
Department of Electrical and Information Eng<strong>in</strong>eer<strong>in</strong>g,<br />
University of Oulu, Oulu, F<strong>in</strong>land<br />
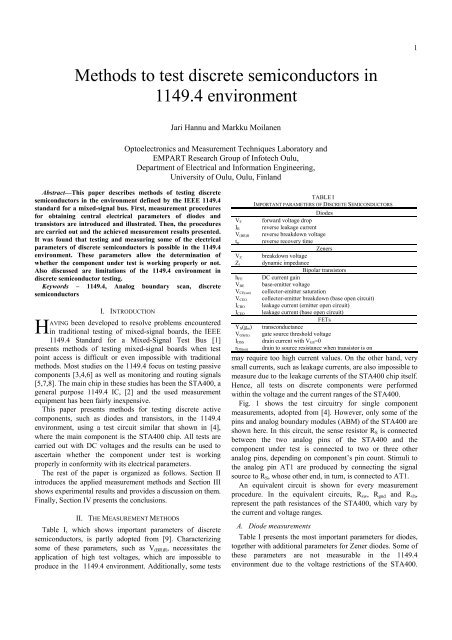
Abstract—This paper describes methods of <strong>test</strong><strong>in</strong>g <strong>discrete</strong><br />
semiconduc<strong>to</strong>rs <strong>in</strong> the <strong>environment</strong> def<strong>in</strong>ed by the IEEE <strong>1149.4</strong><br />
standard for a mixed-signal bus. First, measurement procedures<br />
for obta<strong>in</strong><strong>in</strong>g central electrical parameters of diodes and<br />
transis<strong>to</strong>rs are <strong>in</strong>troduced and illustrated. Then, the procedures<br />
are carried out and the achieved measurement results presented.<br />
It was found that <strong>test</strong><strong>in</strong>g and measur<strong>in</strong>g some of the electrical<br />
parameters of <strong>discrete</strong> semiconduc<strong>to</strong>rs is possible <strong>in</strong> the <strong>1149.4</strong><br />
<strong>environment</strong>. These parameters allow the determ<strong>in</strong>ation of<br />
whether the component under <strong>test</strong> is work<strong>in</strong>g properly or not.<br />
Also discussed are limitations of the <strong>1149.4</strong> <strong>environment</strong> <strong>in</strong><br />
<strong>discrete</strong> semiconduc<strong>to</strong>r <strong>test</strong><strong>in</strong>g.<br />
Keywords – <strong>1149.4</strong>, Analog boundary scan, <strong>discrete</strong><br />
semiconduc<strong>to</strong>rs<br />
H<br />
I. INTRODUCTION<br />
AVING been developed <strong>to</strong> resolve problems encountered<br />
<strong>in</strong> traditional <strong>test</strong><strong>in</strong>g of mixed-signal boards, the IEEE<br />
<strong>1149.4</strong> Standard for a Mixed-Signal Test Bus [1]<br />
presents methods of <strong>test</strong><strong>in</strong>g mixed-signal boards when <strong>test</strong><br />
po<strong>in</strong>t access is difficult or even impossible with traditional<br />
methods. Most studies on the <strong>1149.4</strong> focus on <strong>test</strong><strong>in</strong>g passive<br />
components [3,4,6] as well as moni<strong>to</strong>r<strong>in</strong>g and rout<strong>in</strong>g signals<br />
[5,7,8]. The ma<strong>in</strong> chip <strong>in</strong> these studies has been the STA400, a<br />
general purpose <strong>1149.4</strong> IC, [2] and the used measurement<br />
equipment has been fairly <strong>in</strong>expensive.<br />
This paper presents methods for <strong>test</strong><strong>in</strong>g <strong>discrete</strong> active<br />
components, such as diodes and transis<strong>to</strong>rs, <strong>in</strong> the <strong>1149.4</strong><br />
<strong>environment</strong>, us<strong>in</strong>g a <strong>test</strong> circuit similar that shown <strong>in</strong> [4],<br />
where the ma<strong>in</strong> component is the STA400 chip. All <strong>test</strong>s are<br />
carried out with DC voltages and the results can be used <strong>to</strong><br />
ascerta<strong>in</strong> whether the component under <strong>test</strong> is work<strong>in</strong>g<br />
properly <strong>in</strong> conformity with its electrical parameters.<br />
The rest of the paper is organized as follows. Section II<br />
<strong>in</strong>troduces the applied measurement methods and Section III<br />
shows experimental results and provides a discussion on them.<br />
F<strong>in</strong>ally, Section IV presents the conclusions.<br />
II. THE MEASUREMENT METHODS<br />
Table I, which shows important parameters of <strong>discrete</strong><br />
semiconduc<strong>to</strong>rs, is partly adopted from [9]. Characteriz<strong>in</strong>g<br />
some of these parameters, such as V (BR)R , necessitates the<br />
application of high <strong>test</strong> voltages, which are impossible <strong>to</strong><br />
produce <strong>in</strong> the <strong>1149.4</strong> <strong>environment</strong>. Additionally, some <strong>test</strong>s<br />
TABLE I<br />
IMPORTANT PARAMETERS OF DISCRETE SEMICONDUCTORS<br />
Diodes<br />
V F forward voltage drop<br />
I R reverse leakage current<br />
V (BR)R reverse breakdown voltage<br />
t rr reverse recovery time<br />
Zeners<br />
V Z breakdown voltage<br />
Z r dynamic impedance<br />
Bipolar transis<strong>to</strong>rs<br />
h FE DC current ga<strong>in</strong><br />
V BE base-emitter voltage<br />
V CE(sat) collec<strong>to</strong>r-emitter saturation<br />
V CEO collec<strong>to</strong>r-emitter breakdown (base open circuit)<br />
I CBO leakage current (emitter open circuit)<br />
I CEO leakage current (base open circuit)<br />
FETs<br />
Y fs (g m ) transconductance<br />
V GS(th) gate source threshold voltage<br />
I DSS dra<strong>in</strong> current with V GS =0<br />
r DS(on) dra<strong>in</strong> <strong>to</strong> source resistance when transis<strong>to</strong>r is on<br />
may require <strong>to</strong>o high current values. On the other hand, very<br />
small currents, such as leakage currents, are also impossible <strong>to</strong><br />
measure due <strong>to</strong> the leakage currents of the STA400 chip itself.<br />
Hence, all <strong>test</strong>s on <strong>discrete</strong> components were performed<br />
with<strong>in</strong> the voltage and the current ranges of the STA400.<br />
Fig. 1 shows the <strong>test</strong> circuitry for s<strong>in</strong>gle component<br />
measurements, adopted from [4]. However, only some of the<br />
p<strong>in</strong>s and analog boundary modules (ABM) of the STA400 are<br />
shown here. In this circuit, the sense resis<strong>to</strong>r R S is connected<br />
between the two analog p<strong>in</strong>s of the STA400 and the<br />
component under <strong>test</strong> is connected <strong>to</strong> two or three other<br />
analog p<strong>in</strong>s, depend<strong>in</strong>g on component’s p<strong>in</strong> count. Stimuli <strong>to</strong><br />
the analog p<strong>in</strong> AT1 are produced by connect<strong>in</strong>g the signal<br />
source <strong>to</strong> R S , whose other end, <strong>in</strong> turn, is connected <strong>to</strong> AT1.<br />
An equivalent circuit is shown for every measurement<br />
procedure. In the equivalent circuits, R sw , R gnd and R vh ,<br />
represent the path resistances of the STA400, which vary by<br />
the current and voltage ranges.<br />
A. Diode measurements<br />
Table I presents the most important parameters for diodes,<br />
<strong>to</strong>gether with additional parameters for Zener diodes. Some of<br />
these parameters are not measurable <strong>in</strong> the <strong>1149.4</strong><br />
<strong>environment</strong> due <strong>to</strong> the voltage restrictions of the STA400.
2<br />
Fig. 2. Equivalent circuits for <strong>test</strong><strong>in</strong>g a diode by the current-voltage<br />
characterization method (a) and the high voltage method (b).<br />
Fig. 1 Test circuit for s<strong>in</strong>gle component <strong>test</strong><strong>in</strong>g.<br />
For example, the reverse breakdown voltage usually requires<br />
more than 50 V. On the other hand, <strong>test</strong><strong>in</strong>g V (BR)R is po<strong>in</strong>tless<br />
exercise, as it may permanently damage the component under<br />
<strong>test</strong>.<br />
Of the diode’s characteristics, the most <strong>in</strong>formative are the<br />
forward voltage level and the possible breakdown voltage<br />
level, which make it easy <strong>to</strong> identify the right diode type.<br />
Other <strong>in</strong>terest<strong>in</strong>g characteristics of breakdown diodes are the<br />
leakage current and dynamic impedance. There are two<br />
methods of <strong>test</strong><strong>in</strong>g a diode’s voltage levels and currents with<br />
the STA400: the first one <strong>in</strong>volves us<strong>in</strong>g an external signal<br />
source and the other us<strong>in</strong>g the STA400’s own voltage high, or<br />
logical ‘1’ , control on the ABM. An external signal source<br />
enables the characterization of the diode’s voltage-current by<br />
allow<strong>in</strong>g the signal source <strong>to</strong> be swept with<strong>in</strong> its operat<strong>in</strong>g<br />
voltage range. In contrast, apply<strong>in</strong>g logic ‘1’ on the ABM<br />
only allows the use of one voltage level, namely, the operation<br />
voltage.<br />
Characteriz<strong>in</strong>g the voltage-current curve of diodes is done<br />
as follows. First, the signal source is connected <strong>to</strong> AT1<br />
through R S as <strong>in</strong> Fig. 1. Next, the signal is routed through<br />
AB1 <strong>to</strong> the anode of the diode <strong>in</strong> ABM3, while the cathode of<br />
the diode is grounded <strong>in</strong> ABM4. Fig.2.a shows the equivalent<br />
circuit of the measurement. The signal source is swept from 0<br />
V <strong>to</strong> the operat<strong>in</strong>g voltage, which is usually 5 V. At every<br />
voltage step, voltages are measured with a meter connected<br />
through AT2 <strong>to</strong> AB2. First, the voltages of ABM1 (U 1 <strong>in</strong><br />
Fig.2.a) and ABM2 (U 2 ) are measured for current calculation,<br />
whereafter the voltages of ABM3 (U 3 ) and ABM4 (U 4 ) are<br />
measured <strong>to</strong> obta<strong>in</strong> the voltage across the diode. After the first<br />
sweep, the configuration is changed such that ABM4 is now<br />
connected <strong>to</strong> AB1 and ABM3 is grounded, which gives the<br />
possibility <strong>to</strong> measure the diode’s reverse voltage properties.<br />
Test<strong>in</strong>g diodes by us<strong>in</strong>g logic ‘1’ on the ABM is done as<br />
follows. Initially, the signal source is set either <strong>to</strong> 0 V or <strong>to</strong><br />
ground level, and the diode is connected from ABM3 <strong>to</strong><br />
ABM4 as <strong>in</strong> Fig. 1. The equivalent circuit of the measurement<br />
is shown <strong>in</strong> Fig.2.a. When measur<strong>in</strong>g forward voltage<br />
properties, ABM3 is set <strong>to</strong> logic ‘1’. Then, the <strong>test</strong> signal is<br />
routed through the diode <strong>to</strong> ABM4 and further <strong>to</strong> AT1 through<br />
AB1. AT1 is connected with a wire <strong>to</strong> R S , whose other end is<br />
connected <strong>to</strong> ground through ABM1. The voltage across the<br />
diode is measured from ABM3 (U 1 ) and ABM4 (U 2 ) through<br />
AB2, and the current is calculated from the value of R S and<br />
the measured voltage values at ABM2 (U 3 ) and ABM1 (U 4 ),<br />
which are also measured through AB2. The reverse voltage<br />
properties are measured <strong>in</strong> the same way, but ABM4 is set <strong>to</strong><br />
logical ‘1’ and ABM3 is connected <strong>to</strong> AB1.<br />
B. Bipolar transis<strong>to</strong>r measurements<br />
As a rule, <strong>test</strong><strong>in</strong>g <strong>discrete</strong> components only requires signal<br />
busses for the source and measurement signals. S<strong>in</strong>ce typical<br />
bipolar transis<strong>to</strong>rs have three connec<strong>to</strong>rs, some <strong>test</strong>s call for<br />
the use of three busses <strong>to</strong> route two source signals and a<br />
measurement signal. This complicates or even precludes the<br />
application of certa<strong>in</strong> <strong>test</strong>s <strong>in</strong> the <strong>1149.4</strong> <strong>environment</strong>.<br />
Possible resis<strong>to</strong>rs that are already present on the DUT may be<br />
useful when <strong>test</strong><strong>in</strong>g some transis<strong>to</strong>r parameters.<br />
Another problem with bipolar transis<strong>to</strong>rs is that they are<br />
def<strong>in</strong>ed for quite large current values. For example, the<br />
saturation voltage (V CE(sat) ) is usually def<strong>in</strong>ed for a base<br />
current of 10 mA and a collec<strong>to</strong>r current of 100 mA.<br />
However, the current go<strong>in</strong>g through analog busses <strong>in</strong> the<br />
STA400 is <strong>in</strong>variably less than 3 mA.<br />
Although the follow<strong>in</strong>g measurement procedures are made<br />
for npn transis<strong>to</strong>rs, they are easily adaptable <strong>to</strong> pnp transis<strong>to</strong>rs.<br />
1) DC current ga<strong>in</strong> measurement<br />
To <strong>in</strong>dicate the operation of the transis<strong>to</strong>r, one can use the<br />
DC current ga<strong>in</strong> (h FE ) <strong>test</strong>. h FE is the common emitter current<br />
ga<strong>in</strong> for large signals and is def<strong>in</strong>ed as follows:<br />
IC<br />
I<br />
E<br />
hFE<br />
= ≈ , (1)<br />
I<br />
B<br />
I<br />
B<br />
where I C is the collec<strong>to</strong>r current, I B the base current and I E<br />
the emitter current. h FE is usually determ<strong>in</strong>ed for specified I C<br />
and collec<strong>to</strong>r/emitter voltage (V CE ) levels. Its value tends <strong>to</strong><br />
vary considerably from transis<strong>to</strong>r <strong>to</strong> transis<strong>to</strong>r.<br />
Fig. 3.a shows the equivalent circuit for h FE <strong>test</strong><strong>in</strong>g. The<br />
collec<strong>to</strong>r of the transis<strong>to</strong>r is connected <strong>to</strong> high voltage <strong>in</strong><br />
ABM3. From the function genera<strong>to</strong>r, the DC signal is routed<br />
through R s <strong>to</strong> AT1 before pass<strong>in</strong>g through AB1 <strong>to</strong> ABM4,<br />
where it is connected <strong>to</strong> the transis<strong>to</strong>r’s base. The emitter of<br />
the transis<strong>to</strong>r is connected <strong>to</strong> ABM5, which is used only for<br />
prob<strong>in</strong>g. In addition, the emitter is connected <strong>to</strong> known<br />
resis<strong>to</strong>r R 1 , which is needed for I E measurements. R 1 may be<br />
an already exist<strong>in</strong>g resis<strong>to</strong>r <strong>in</strong> a DUT.
3<br />
Fig. 3. Equivalent circuits for <strong>test</strong><strong>in</strong>g npn’s h FE and VCE (sat) (a) and V BE<br />
(b).<br />
First, the function genera<strong>to</strong>r’s voltage level is swept <strong>to</strong> a<br />
level when the V CE is equal or under 1V. The voltage is<br />
measured from the voltages recorded at ABM3 (U 3 <strong>in</strong> Fig. 3.a)<br />
and ABM5 (U 5 ). When V CE reaches the desired level, the<br />
correspond<strong>in</strong>g voltage levels at ABM1 (U 1 ) and ABM2 (U 2 )<br />
are measured through AB2 <strong>to</strong> obta<strong>in</strong> I B . Then, <strong>to</strong> get V BE , also<br />
the voltage at ABM4 (U 3 ) is measured. F<strong>in</strong>ally, I E is<br />
calculated from the value of R 1 and from the voltage level at<br />
ABM5<br />
2) Base-emitter voltage measurement<br />
In component data sheets, the base-emitter voltage (V BE ) is<br />
def<strong>in</strong>ed as the voltage from the base <strong>to</strong> the collec<strong>to</strong>r when the<br />
collec<strong>to</strong>r current (I C ) and collec<strong>to</strong>r-emitter voltage (V CE ) are at<br />
def<strong>in</strong>ed levels. Usually, I C is def<strong>in</strong>ed as 100 mA and V CE as<br />
1V. V BE depends on I C such that the bigger the I C , the bigger<br />
the V BE .<br />
To measure V BE , one may use a circuit similar <strong>to</strong> that <strong>in</strong> the<br />
current ga<strong>in</strong> measurement. But <strong>in</strong> the absence of an external<br />
resis<strong>to</strong>r R 1 <strong>in</strong> the <strong>test</strong>able circuit, V BE can only be measured<br />
when the emitter is connected <strong>to</strong> ground. In this situation,<br />
however, the current from the collec<strong>to</strong>r and emitter is<br />
unknown. Nevertheless, its value can be estimated from the<br />
maximum output current of the ABM when it is connected <strong>to</strong><br />
high voltage. The maximum output current of the ABM is less<br />
than 2.5 mA.<br />
Measur<strong>in</strong>g V BE resembles the current-voltage<br />
characterization of diodes. First, the function genera<strong>to</strong>r is<br />
connected through R S <strong>to</strong> AB1, and further <strong>to</strong> the transis<strong>to</strong>r’s<br />
base. The collec<strong>to</strong>r is connected <strong>to</strong> high voltage through<br />
ABM3, and the emitter is connected <strong>to</strong> ground through<br />
ABM5.<br />
The function genera<strong>to</strong>r is swept from 0 V <strong>to</strong> V CC . At every<br />
voltage level, voltages are measured at ABM1 (U 1 ) and<br />
ABM2 (U 2 ) through AB2 <strong>to</strong> obta<strong>in</strong> the base current (I B ).<br />
Moreover, voltages at ABM4 (U 3 ) and ABM5 (U 5 ) are<br />
measured <strong>to</strong> get V BE . Then, <strong>to</strong> obta<strong>in</strong> V CE , also the voltage at<br />
ABM3 (U 4 ) is measured. The value of V BE is def<strong>in</strong>ed when<br />
V CE reaches the desired level, such as 1 V.<br />
Fig. 4. Equivalent circuits for <strong>test</strong><strong>in</strong>g MOSFET’s V GS(th) (a) and r ds(ON) (b).<br />
3) Collec<strong>to</strong>r-emitter saturation voltage measurement<br />
The collec<strong>to</strong>r-emitter saturation voltage (V CE(sat) ) is<br />
measured with a circuit similar <strong>to</strong> that of the h FE measurement.<br />
V CE(sat) is usually def<strong>in</strong>ed as the voltage over the collec<strong>to</strong>r and<br />
emitter when the collec<strong>to</strong>r current (I C ) is ten times larger than<br />
the base current (I B ). Generally, I C is set at 100 mA, which is<br />
<strong>to</strong>o high for the <strong>1149.4</strong> <strong>environment</strong>.<br />
When us<strong>in</strong>g the circuit shown <strong>in</strong> Fig. 3.a, the currents must<br />
be calculated such that the emitter current (I E ) is the sum of I C<br />
and I B . As a result, I E must be eleven times larger than I B . The<br />
measurement procedure is similar <strong>to</strong> the h FE measurement, the<br />
only difference be<strong>in</strong>g that the signal genera<strong>to</strong>r is driven from 0<br />
<strong>to</strong> V CC . The currents are measured and when the current ratio<br />
reaches the desired ratio of 11:1, V CE is determ<strong>in</strong>ed.<br />
C. Field effect transis<strong>to</strong>r (FET) measurements<br />
I Table I presents some important FET parameters. One of<br />
the most <strong>in</strong>terest<strong>in</strong>g among these is transconductance (g m ), but<br />
it cannot be measured <strong>in</strong> the <strong>1149.4</strong> <strong>environment</strong> without a<br />
large number of additional components. Thus,<br />
transconductance measurements require two more signal<br />
busses and extra capaci<strong>to</strong>rs for dc-block<strong>in</strong>g. Also leakage<br />
currents are impossible <strong>to</strong> measure due <strong>to</strong> the leakage currents<br />
of the <strong>1149.4</strong> bus. The follow<strong>in</strong>g measurements enable one <strong>to</strong><br />
<strong>test</strong> some FET parameters which then allows the<br />
determ<strong>in</strong>ation of whether the component works properly or<br />
not. The follow<strong>in</strong>g procedures are for an n-type MOSFET<br />
transis<strong>to</strong>r, but are also easily adaptable <strong>to</strong> other types of FET.<br />
1) Gate threshold voltage measurement<br />
Information as <strong>to</strong> how high a voltage is needed <strong>to</strong> turn a<br />
channel on or off is given by the gate threshold voltage<br />
(V GS(th) ). Technical datasheets for transis<strong>to</strong>rs usually provide a<br />
value for V GS(th) , which is obta<strong>in</strong>ed when the dra<strong>in</strong>-source<br />
voltage equals the gate-source voltage at the exact dra<strong>in</strong><br />
current level.<br />
The measurement procedure is as follows. The signal from<br />
the function genera<strong>to</strong>r is routed through R s <strong>to</strong> AT1. AT1 is<br />
connected <strong>to</strong> AB1, which is connected <strong>to</strong> the dra<strong>in</strong> of the
4<br />
transis<strong>to</strong>r through ABM3 and <strong>to</strong> the gate through ABM4.<br />
ABM5 is used <strong>to</strong> connect the transis<strong>to</strong>r’s source <strong>to</strong> ground.<br />
Fig. 4.a shows the equivalent circuit.<br />
The function genera<strong>to</strong>r is swept from 0 <strong>to</strong> V cc . At every<br />
step, the voltage is measured at ABM1 (U 1 ) and ABM2 (U 2 )<br />
<strong>to</strong> record the current go<strong>in</strong>g <strong>to</strong> the dra<strong>in</strong> and gate. Because the<br />
gate current (I G ) is negligible, it can be assumed that the<br />
current flow<strong>in</strong>g through is I D . Also the voltages at ABM3<br />
(U 4 ), ABM4 (U 3 ) and ABM5 (U 5 ) are measured <strong>to</strong> get actual<br />
values for V DS and V GS . V GS(th) is def<strong>in</strong>ed when I D reaches the<br />
level stated <strong>in</strong> the technical datasheet.<br />
2) Dra<strong>in</strong>-Source resistance measurement<br />
Dra<strong>in</strong>-Source resistance (r DS(on) ) is the switch resistance of<br />
the FET when it is on. S<strong>in</strong>ce this resistance tends <strong>to</strong> be small,<br />
the measurement is very difficult <strong>to</strong> perform. In this study, the<br />
measurement procedure is as follows. As usual, the signal<br />
from the function genera<strong>to</strong>r is connected through R S <strong>to</strong> AB1.<br />
From AB1, the signal goes <strong>to</strong> the dra<strong>in</strong> of the transis<strong>to</strong>r. The<br />
transis<strong>to</strong>r’s gate is connected <strong>to</strong> high voltage through ABM4<br />
and the source is connected <strong>to</strong> ground through ABM5. Fig 4.b<br />
shows the equivalent circuit of the connection.<br />
Voltages are measured at ABM1 (U 1 ) and ABM2 (U 2 ) <strong>to</strong><br />
obta<strong>in</strong> the dra<strong>in</strong> current (I D ) and at ABM3 (U 3 ) and ABM5<br />
(U 5 ) <strong>to</strong> get V DS . Also the voltage at ABM4 (U 4 ) is measured <strong>to</strong><br />
establish V GS . Hav<strong>in</strong>g acquired V DS and I D , one can calculate<br />
r DS(on) .<br />
TABLE II<br />
DIODE MEASUREMENT RESULTS<br />
Component V F1 V Z1 V F2 V Z2 V F3 V Z3<br />
Green LED 1.86 - 1.85 - < 1.85 1.9 -<br />
Red LED 1.64 - 1.63 - < 1.63 1.8 -<br />
IR LED 1.15 - 1.15 - < 1.14 1.20 -<br />
bat48 0.26 - 0.27 - < 0.26 0.30 -<br />
bat85 0.29 - 0.28 - < 0.28 0.32 -<br />
1n914 0.63 - 0.64 - < 0.63 0.80 -<br />
zte2 0.77 2.12 0.77 2.12 < 0.77 1.1 < 2.13 2.4<br />
c4v7 0.71 3.87 0.72 3.83 < 0.72 0.80 < 3.84 5.0<br />
c5v1 0.72 4.30 0.72 4.22 < 0.71 0.80 < 4.23 5.4<br />
I [mA]<br />
1.5<br />
zte2<br />
c4v7<br />
c5v1<br />
1<br />
0.5<br />
V [V]<br />
0<br />
-5 -4 -3 -2 -1 0 1 2<br />
-0.5<br />
III. MEASUREMENT RESULTS AND DISCUSSION<br />
The measurement system shown <strong>in</strong> Fig. 1 was built us<strong>in</strong>g an<br />
Agilent 33120A as function genera<strong>to</strong>r and an Agilent 34401A<br />
as voltmeter. For boundary scan control, we used a JTAG<br />
PM3705 boundary-scan controller. The measurement<br />
equipment was controlled by LabVIEW software.<br />
A. Diode measurements<br />
Diodes were measured as described <strong>in</strong> Section II. As Table<br />
II <strong>in</strong>dicates, a number of different types of diode were <strong>test</strong>ed.<br />
Among these, the first three were LEDs, bat48 and bat85 were<br />
Schottky diodes, 1n914 was a regular pn-junction diode and<br />
the last three were Zener diodes. In the table, the first two<br />
columns represent the voltage values V F and V Z us<strong>in</strong>g the<br />
voltage high control on the STA400. The middle columns<br />
represent measurement results obta<strong>in</strong>ed us<strong>in</strong>g the voltagecurrent<br />
characterization method. The last column presents<br />
reference measurements of the diodes. The reference<br />
measurements were done with the same current values as the<br />
<strong>1149.4</strong> measurements.<br />
Table II illustrates that the voltage-current characterization<br />
method and voltage high method produce essentially the same<br />
results. However, some voltage levels differ slightly, because<br />
the currents did not match exactly <strong>in</strong> every measurement. This<br />
m<strong>in</strong>or discrepancy is expla<strong>in</strong>ed by the fact that the voltage<br />
high method produced somewhat larger currents. Also both of<br />
the <strong>1149.4</strong> measurement methods produced similar results<br />
Fig. 5. Voltage – Current characteristics of Zener diodes measured <strong>in</strong> the<br />
<strong>1149.4</strong> <strong>environment</strong>.<br />
2.5<br />
V[V]<br />
2<br />
1.5<br />
1<br />
0.5<br />
0<br />
Max voltage<br />
M<strong>in</strong> voltage<br />
M<strong>in</strong> current<br />
Max current<br />
R<br />
0.1k 1k 10k 100k<br />
2<br />
I[mA]<br />
which were obta<strong>in</strong>ed from the reference results.<br />
Fig. 5. presents the voltage-current characteristics of the<br />
measured Zener diodes. In this measurement, the step size of<br />
the voltage sweeps was 0.1 V and the size of R S was about 1<br />
kΩ. It can be seen that the maximum current pass<strong>in</strong>g through<br />
1.8<br />
1.6<br />
1.4<br />
1.2<br />
1<br />
0.8<br />
0.6<br />
0.4<br />
0.2<br />
Fig. 6. Maximum and m<strong>in</strong>imum currents and voltages as a functions <strong>to</strong> of<br />
sense resis<strong>to</strong>rs size.<br />
-1<br />
0
5<br />
the diode was approximately 1.5 mA. As shown <strong>in</strong> the<br />
equivalent circuit of the measurement (Fig. 2.a), this current is<br />
limited by the R S and switch resistances (R SW ) of the STA400,<br />
and expla<strong>in</strong>s why currents <strong>in</strong> the breakdown region are<br />
smaller with higher voltage Zeners.<br />
The Zener diode zte2 was measured with four different<br />
sense resis<strong>to</strong>rs, and the R S value was varied by decade steps<br />
from 0.1 <strong>to</strong> 100 kΩ. Fig. 6 shows the measured m<strong>in</strong>imum and<br />
maximum current and voltage values. All the values shown<br />
are absolute. As can be seen from the figure, a large sense<br />
resis<strong>to</strong>r has a stronger effect on current than on voltage. Thus,<br />
by allow<strong>in</strong>g the use of larger currents, a small R S is better<br />
suited for more accurate measurements of diode behaviour <strong>in</strong><br />
the breakdown region.<br />
Despite voltage and current restrictions, the mixed-signal<br />
<strong>test</strong> bus can be used for diode measurements. With the thus<br />
acquired <strong>in</strong>formation, one may tell whether the diode under<br />
<strong>test</strong> is mounted appropriately and work<strong>in</strong>g properly.<br />
B. Bipolar transis<strong>to</strong>r measurements<br />
1) DC current ga<strong>in</strong> measurement<br />
Six identical BC337 transis<strong>to</strong>rs were used <strong>in</strong> the DC current<br />
ga<strong>in</strong> (h FE ) measurements. In Table III, the first column<br />
presents the reference measurements for h FE , <strong>in</strong> which V CE<br />
was forced <strong>to</strong> 1 V and I E <strong>to</strong> 2 mA. In the <strong>1149.4</strong> measurement,<br />
different resis<strong>to</strong>r sizes were used as R 1 and R S . Because I B is<br />
so small, R S has <strong>to</strong> be large enough <strong>to</strong> yield accurate results.<br />
Hence, the best results were obta<strong>in</strong>ed us<strong>in</strong>g a value of 100 kΩ<br />
for R S and 1 kΩ for R 1 . With this configuration, I E was about<br />
2 mA and V CE about 1V. The results can be seen <strong>in</strong> the middle<br />
columns of Table III.<br />
As shown, the accuracy rate of the results <strong>in</strong> the <strong>1149.4</strong><br />
measurements is with<strong>in</strong> 3 % of the reference measurements.<br />
There are many reasons for the errors <strong>in</strong> the results. Firstly,<br />
the measurement conditions (V CE an I E ) were not exactly the<br />
same and, secondly, measurements with small I B values were<br />
affected by the leakage currents of the STA400.<br />
The presented method for h FE measurements <strong>in</strong> the <strong>1149.4</strong><br />
<strong>environment</strong> is valid for small current ranges, whereas<br />
measurements with larger currents are restricted by the<br />
ABM‘s maximum output current. Also the value of R 1 greatly<br />
affects the measurement by resist<strong>in</strong>g I E and the already small<br />
current I B .<br />
2) Base-emitter voltage measurement<br />
The six BC337 transis<strong>to</strong>rs of the h FE measurements were<br />
also used <strong>in</strong> the V BE measurements. A reference measurement,<br />
whose results are given <strong>in</strong> the second column <strong>in</strong> Table III, was<br />
conducted such that V CE was 1 V and I E was 2 mA. In the<br />
<strong>1149.4</strong> <strong>test</strong> circuit, an R S of 100 kΩ was used <strong>to</strong> prevent the<br />
transis<strong>to</strong>rs from saturat<strong>in</strong>g. As described <strong>in</strong> measurement<br />
methods, it was estimated that I E <strong>in</strong> the measurement circuit<br />
was about 2 mA.<br />
From Table III, it can be seen that the difference between<br />
TABLE III<br />
DC CURRENT GAIN AND BASE-EMITTER VOLTAGE MEASUREMENTS<br />
Component<br />
Reference<br />
h FE<br />
V BE<br />
[mV]<br />
h FE<br />
<strong>1149.4</strong> measurements<br />
error%<br />
V BE<br />
[mV]<br />
the <strong>1149.4</strong> and reference measurements is at the most 1.6%.<br />
Because the emitter current is not measurable <strong>in</strong> this<br />
measurement method it is the ma<strong>in</strong> reason for the error <strong>in</strong> the<br />
measurement results.<br />
3) Collec<strong>to</strong>r-emitter saturation voltage measurement<br />
Saturation voltages are generally measured when the<br />
collec<strong>to</strong>r current, usually about 100 mA, is ten times bigger<br />
than the base current. Us<strong>in</strong>g the circuit for V CE(sat)<br />
measurements described <strong>in</strong> Chapter II brought out the<br />
limitations of the ABM’s maximum output current. To get the<br />
required 11:1 current level ratio, a large resis<strong>to</strong>r had <strong>to</strong> be<br />
attached <strong>to</strong> the transis<strong>to</strong>r’s emitter. Accurate measurements of<br />
I B also required the application of a fairly large resis<strong>to</strong>r as R S .<br />
In the BC337 measurements, the emitter resistance value<br />
was 830 kΩ and R S was 50 kΩ. Gett<strong>in</strong>g the right ratio between<br />
I B and I E means that only the emitter’s resistance value has an<br />
effect on the results. Accord<strong>in</strong>g <strong>to</strong> the BC337 data sheets,<br />
V CE(sat) is def<strong>in</strong>ed as less than 700 mV, when I C is 500 mA and<br />
I B is 50 mA. In our measurements, V CE(sat) was 480 mV, when<br />
I E was 5.5μA and I B 520 nA.<br />
Measur<strong>in</strong>g V CE(sat) is difficult, because the ABM’s<br />
maximum current is small and the resistance <strong>in</strong> the emitter<br />
must be specified for the measurement. As a result, this<br />
measurement method is possible only when the R 1 value is<br />
sufficiently large.<br />
C. Field effect transis<strong>to</strong>r (FET) measurements<br />
error%<br />
BC337(1) 252 624 249 -1.1 613 -1.6<br />
BC337(2) 229 626 227 -1.1 617 -1.5<br />
BC337(3) 246 624 242 -1.7 614 -1.6<br />
BC337(4) 252 623 245 -2.8 614 -1.5<br />
BC337(5) 240 625 233 -3.1 616 -1.5<br />
BC337(6) 259 623 252 -2.8 614 -1.5<br />
1) Gate threshold voltage measurement<br />
Characteriz<strong>in</strong>g the gate threshold voltage (V GS(th) ) was<br />
similar <strong>to</strong> the current-voltage characterization of diodes. Thus,<br />
V GS was measured as a function of dra<strong>in</strong> current (I D ) us<strong>in</strong>g six<br />
2n7000 transis<strong>to</strong>rs. For the reference measurements <strong>in</strong> Table<br />
IV, V GS(th) was def<strong>in</strong>ed when I D was 1 mA. This same I D value<br />
was also used <strong>in</strong> the <strong>1149.4</strong> measurement <strong>to</strong> def<strong>in</strong>e V GS(th) .<br />
The size of R S <strong>in</strong> the <strong>1149.4</strong> measurement was 1 kΩ. V GS(th)<br />
characterization would not have been possible with higher R S<br />
values, because the required current would have been <strong>to</strong>o<br />
small. With 1 kΩ, the maximum current was just over 1 mA.<br />
The measurement results obta<strong>in</strong>ed <strong>in</strong> the <strong>1149.4</strong> measurement<br />
system varied only by 0.2% relative <strong>to</strong> the reference<br />
measurements.
6<br />
TABLE IV<br />
GATE-SOURCE THRESHOLD THRESOLD VOLTAGE AND ON RESISTANCE MEASUREMENTS<br />
Component<br />
Reference<br />
V GS<br />
[V]<br />
r DS<br />
[Ω]<br />
V GS<br />
[V]<br />
<strong>1149.4</strong> measurements<br />
r DS1<br />
[Ω]<br />
error<br />
%<br />
r DS2<br />
[Ω]<br />
error<br />
%<br />
2n7000(1) 2.56 2.89 2.56 6.98 58.6 3.22 10.2<br />
2n7000(2) 2.45 2.81 2.45 6.80 58.7 3.20 12.2<br />
2n7000(3) 2.55 2.90 2.55 6.90 58.0 3.27 11.3<br />
2n7000(4) 2.57 2.95 2.57 7.14 58.6 3.35 11.9<br />
2n7000(5) 2.41 2.84 2.41 6.78 58.1 3.21 11.5<br />
2n7000(6) 2.44 2.74 2.45 6.71 59.2 3.11 11.9<br />
2) Dra<strong>in</strong>-Source resistance measurement<br />
Dra<strong>in</strong>-Source resistance (r DS(on) ) is usually def<strong>in</strong>ed for large<br />
currents than are impossible <strong>to</strong> measure with the STA400. For<br />
example, <strong>in</strong> the datasheet for the 2n7000, r DS(on) is def<strong>in</strong>ed<br />
when I D is 50 mA and V GS 5 V. The reference measurements<br />
shown <strong>in</strong> Table IV were performed us<strong>in</strong>g an I D of 400 μA and<br />
a V GS of 5 V. These reference values were chosen <strong>to</strong> be<br />
similar <strong>to</strong> those <strong>in</strong> the <strong>1149.4</strong> measurement.<br />
Usually, r DS(on) is small; for the 2n7000, the maximum<br />
resistance is 7.5 Ω. A larger current eases the measurement,<br />
because 50 mA produces a voltage of 375 mV over the<br />
channel when r DS(on) is 7.5 Ω. Contrast<strong>in</strong>gly, a 1 mA current<br />
produces a voltage of only 7.5 mV, which is difficult <strong>to</strong><br />
dist<strong>in</strong>guish from the leakage currents of the STA400. For the<br />
current measurement, R S was chosen <strong>to</strong> be 10 kΩ when I D is<br />
400 μA. Had R S been smaller, such as 1 kΩ, I D would have<br />
been bigger. A bigger I D raises the ground resistance of the<br />
ABM, caus<strong>in</strong>g the voltage level <strong>in</strong> the transis<strong>to</strong>r’s source <strong>to</strong><br />
rise. When the source has a higher potential than the ground,<br />
V GS becomes smaller and that changes the measurement<br />
conditions. It was <strong>test</strong>ed with the STA400 that when I D is 1<br />
mA, V GS is reduced <strong>to</strong> 3.75 V. In reference measurements,<br />
when V GS was 3.75 V and I D 1 mA, r DS(on) was 3.8 Ω. Fig. 7.<br />
shows the effect of I D on V GS and the measurement of r DS(on) <strong>in</strong><br />
the <strong>1149.4</strong> <strong>environment</strong>.<br />
The values for r DS1 <strong>in</strong> Table IV are the ones used <strong>in</strong> the<br />
measurement procedure presented <strong>in</strong> Section II, while the<br />
values for r DS2 are those for a similar measurement procedure,<br />
except that the source of the transis<strong>to</strong>r was connected <strong>to</strong> actual<br />
ground. As the results <strong>in</strong>dicate, the values of r DS2 differ only<br />
by 12 % from the reference values, whereas those of r DS1<br />
differ by almost 60 %. The measurement error is partly caused<br />
by the lower V GS and partly by the leakage currents of the<br />
STA400.<br />
IV. CONCLUSIONS<br />
This paper demonstrated that <strong>test</strong><strong>in</strong>g and characteriz<strong>in</strong>g<br />
<strong>discrete</strong> semiconduc<strong>to</strong>rs <strong>in</strong> the <strong>1149.4</strong> <strong>environment</strong> is fully<br />
possible, albeit with some restrictions. Also shown were the<br />
procedures of measur<strong>in</strong>g certa<strong>in</strong> important electrical<br />
properties of diodes and of bipolar and field effect transis<strong>to</strong>rs.<br />
Experimental results were presented <strong>in</strong> support of these<br />
rDS [Ω]<br />
8.2<br />
8.0<br />
7.8<br />
7.6<br />
7.4<br />
7.2<br />
7.0<br />
6.8<br />
6.6<br />
6.4<br />
6.2<br />
6.0<br />
5.0<br />
4.8<br />
4.9<br />
rDS<br />
ID<br />
4.7<br />
4.6<br />
4.6<br />
4.5<br />
4.4<br />
4.4<br />
4.3<br />
4.2<br />
4.2<br />
4.8<br />
V GS [V]<br />
Fig. 7. Effect of I D on <strong>to</strong> V GS and r DS<br />
procedures. Moreover, us<strong>in</strong>g them <strong>in</strong> <strong>discrete</strong> component<br />
<strong>test</strong><strong>in</strong>g allows one <strong>to</strong> determ<strong>in</strong>e whether a given component is<br />
work<strong>in</strong>g properly or whether it is broken or improperly<br />
mounted. F<strong>in</strong>ally, restrictions on component <strong>test</strong><strong>in</strong>g <strong>in</strong> the<br />
<strong>1149.4</strong> <strong>environment</strong> were identified and expla<strong>in</strong>ed.<br />
ACKNOWLEDGMENT<br />
The authors wish <strong>to</strong> thank National Semiconduc<strong>to</strong>r Corp.<br />
for provid<strong>in</strong>g us with the STA400s. The Technology<br />
Development Centre of F<strong>in</strong>land (TEKES), Nokia and<br />
Elektrobit Group are acknowledged for fund<strong>in</strong>g the Embedded<br />
Test<strong>in</strong>g of Mixed-Signal Devices Project, under which this<br />
work was carried out.<br />
REFERENCES<br />
[1] IEEE Std <strong>1149.4</strong>-1999 “Standard for a Mixed-Signal Test Bus”, IEEE,<br />
USA, 2000<br />
[2] S.Sunter, K.Filliter, J.Woo, P.McHugh, “A General Purpose <strong>1149.4</strong> IC<br />
with HF Analog Test Capabilities”, Proceed<strong>in</strong>gs of IEEE International<br />
Test Conference, 2001, pp. 38-45<br />
[3] I.Duzevik, “Prelim<strong>in</strong>ary Results of Passive Component Measurement<br />
<strong>Methods</strong> Us<strong>in</strong>g an IEEE <strong>1149.4</strong> Compliant Device”, 1st IEEE<br />
International Board Test Workshop, 2002<br />
[4] T.Saikkonen, J.Voutila<strong>in</strong>en, M.Moilanen, “Some <strong>Methods</strong> <strong>to</strong> Calculate<br />
the Values of Passive Components from the Measurements Made with<br />
an <strong>1149.4</strong> Compliant Device”, 2nd IEEE International Board Test<br />
Workshop, 2003<br />
[5] C.Jeffrey, A.Lechner, A.Richardson, “Onl<strong>in</strong>e Moni<strong>to</strong>r<strong>in</strong>g for<br />
Au<strong>to</strong>motive Subsystems Us<strong>in</strong>g <strong>1149.4</strong>”, 2nd IEEE International Board<br />
Test Workshop, 2003<br />
[6] T.Saikkonen, J.Voutila<strong>in</strong>en, M.Moilanen, “Calculat<strong>in</strong>g the Values of<br />
Passive Components <strong>in</strong> <strong>1149.4</strong> Environment”, 3rd IEEE International<br />
Board Test Workshop, 2004<br />
[7] J. Voutila<strong>in</strong>en, M. Moilanen, “Embedded Characterization Technique<br />
for BGA Solder Jo<strong>in</strong>t Wear-Out with <strong>1149.4</strong> Mixed-Signal Test Bus<br />
Architecture”, IEEE European Test Symposium 2005<br />
[8] C. Jeffrey, R. Cutajar, S. Prosser, M. Lickess, A. Richardson, S. Riches,<br />
“The <strong>in</strong>tegration of on-l<strong>in</strong>e moni<strong>to</strong>r<strong>in</strong>g and reconfiguration functions<br />
us<strong>in</strong>g IEEE<strong>1149.4</strong> <strong>in</strong><strong>to</strong> a safety critical au<strong>to</strong>motive electronic control<br />
unit”, Design, Au<strong>to</strong>mation and Test <strong>in</strong> Europe, 2005. Proceed<strong>in</strong>gs 2005<br />
Page(s):153 - 158 Vol. 3<br />
[9] G.C. Loveday, “Electronic Test<strong>in</strong>g and Fault Diagnosis”, 3 rd edition,<br />
London: Pearson Education Limited 1995, ch 3.<br />
4.0<br />
4.1<br />
3.9<br />
3.9<br />
1.8<br />
1.6<br />
1.4<br />
1.2<br />
1.0<br />
0.8<br />
0.6<br />
0.4<br />
0.2<br />
0.0<br />
ID [mA]