ENTSO-E Overview of transmission tariffs in Europe: Synthesis 2010
ENTSO-E Overview of transmission tariffs in Europe: Synthesis 2010
ENTSO-E Overview of transmission tariffs in Europe: Synthesis 2010

You also want an ePaper? Increase the reach of your titles
YUMPU automatically turns print PDFs into web optimized ePapers that Google loves.
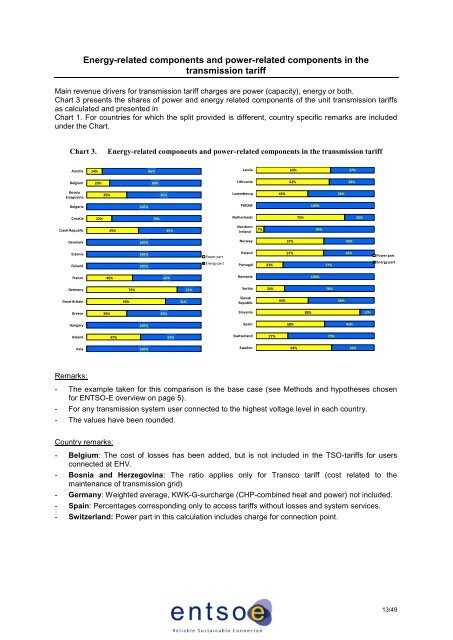
Energy-related components and power-related components <strong>in</strong> the<br />
<strong>transmission</strong> tariff<br />
Ma<strong>in</strong> revenue drivers for <strong>transmission</strong> tariff charges are power (capacity), energy or both.<br />
Chart 3 presents the shares <strong>of</strong> power and energy related components <strong>of</strong> the unit <strong>transmission</strong> <strong>tariffs</strong><br />
as calculated and presented <strong>in</strong><br />
Chart 1. For countries for which the split provided is different, country specific remarks are <strong>in</strong>cluded<br />
under the Chart.<br />
Chart 3.<br />
Energy-related components and power-related components <strong>in</strong> the <strong>transmission</strong> tariff<br />
Austria<br />
14%<br />
86%<br />
Latvia<br />
63%<br />
37%<br />
Belgium<br />
20%<br />
80%<br />
Lithuania<br />
62%<br />
38%<br />
Bosnia<br />
Erzegov<strong>in</strong>a<br />
35%<br />
65%<br />
Luxembourg<br />
44%<br />
56%<br />
Bulgaria<br />
100%<br />
FYROM<br />
100%<br />
Croatia<br />
22%<br />
78%<br />
Netherlands<br />
75%<br />
25%<br />
Czech Republic<br />
45%<br />
55%<br />
Northern<br />
Ireland<br />
7%<br />
93%<br />
Denmark<br />
100%<br />
Norway<br />
57%<br />
43%<br />
Estonia<br />
F<strong>in</strong>land<br />
100%<br />
100%<br />
Power part<br />
Energy part<br />
Poland<br />
Portugal<br />
23%<br />
57%<br />
77%<br />
43%<br />
Power part<br />
Energy part<br />
France<br />
40%<br />
60%<br />
Romania<br />
100%<br />
Germany<br />
79%<br />
21%<br />
Serbia<br />
24%<br />
76%<br />
Great Brita<strong>in</strong><br />
69%<br />
31%<br />
Slovak<br />
Republic<br />
44%<br />
56%<br />
Greece<br />
35%<br />
65%<br />
Slovenia<br />
88%<br />
12%<br />
Hungary<br />
100%<br />
Spa<strong>in</strong><br />
58%<br />
42%<br />
Ireland<br />
47%<br />
53%<br />
Switzerland<br />
27%<br />
73%<br />
Italy<br />
100%<br />
Sweden<br />
64%<br />
36%<br />
Remarks:<br />
- The example taken for this comparison is the base case (see Methods and hypotheses chosen<br />
for <strong>ENTSO</strong>-E overview on page 5).<br />
- For any <strong>transmission</strong> system user connected to the highest voltage level <strong>in</strong> each country.<br />
- The values have been rounded.<br />
Country remarks:<br />
- Belgium: The cost <strong>of</strong> losses has been added, but is not <strong>in</strong>cluded <strong>in</strong> the TSO-<strong>tariffs</strong> for users<br />
connected at EHV.<br />
- Bosnia and Herzegov<strong>in</strong>a: The ratio applies only for Transco tariff (cost related to the<br />
ma<strong>in</strong>tenance <strong>of</strong> <strong>transmission</strong> grid)<br />
- Germany: Weighted average, KWK-G-surcharge (CHP-comb<strong>in</strong>ed heat and power) not <strong>in</strong>cluded.<br />
- Spa<strong>in</strong>: Percentages correspond<strong>in</strong>g only to access <strong>tariffs</strong> without losses and system services.<br />
- Switzerland: Power part <strong>in</strong> this calculation <strong>in</strong>cludes charge for connection po<strong>in</strong>t.<br />
13/49