Board Meeting Agenda July 2012 - Birmingham Children's Hospital
Board Meeting Agenda July 2012 - Birmingham Children's Hospital
Board Meeting Agenda July 2012 - Birmingham Children's Hospital

You also want an ePaper? Increase the reach of your titles
YUMPU automatically turns print PDFs into web optimized ePapers that Google loves.
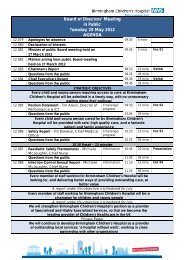
<strong>Board</strong> of Directors’ <strong>Meeting</strong> in Public<br />
Tuesday 31 <strong>July</strong> <strong>2012</strong><br />
AGENDA<br />
12.124 Apologies for absence<br />
09.00 5 mins<br />
Elaine Simpson, David Eltringham, David<br />
Melbourne, Vin Diwakar<br />
12.125 Declaration of interests<br />
12.126 Minutes of public <strong>Board</strong> meeting held on 29<br />
09.05 5 mins Enc 01<br />
May <strong>2012</strong><br />
12.127 Matters arising from of public <strong>Board</strong> meeting<br />
held on 29 May <strong>2012</strong><br />
12.128 Chairman’s Report 09.10 10 mins Verbal<br />
Questions from the public 09.20 5 mins<br />
12.129 Chief Executive’s Report 09.25 25 mins Verbal<br />
Questions from the public 09.50 5 mins<br />
STRATEGIC OBJECTIVE<br />
Every child and young person requiring access to care at<br />
<strong>Birmingham</strong> Children’s <strong>Hospital</strong> will be admitted in a timely way,<br />
with no unnecessary waiting along their pathway<br />
12.130 Monthly Position Statement – Phil Foster, Challenge 09.55 15 mins Enc 02<br />
Deputy Chief Finance Officer<br />
progress<br />
Questions from the public 10.10 5 mins<br />
STRATEGIC ENABLER<br />
Our Brand & Reputation<br />
12.131 Developing the BCH Brand - Rob Checketts, Information 10.15 25 mins Presentation<br />
Director of Performance<br />
Questions from the public 10.40 5 mins<br />
10.45 Break 15 minutes<br />
STRATEGIC OBJECTIVES<br />
Every child and young person cared for by <strong>Birmingham</strong> Children’s <strong>Hospital</strong><br />
will be provided with safe, high quality care,<br />
and a fantastic patient and family experience<br />
12.132 Quality Report – Vin Diwakar, Chief Medical Challenge 11.00 15 mins Enc 03<br />
Officer & Michelle McLoughlin, Chief Nurse progress<br />
Questions from the public 11.15 5 mins<br />
Every member of staff working for <strong>Birmingham</strong> Children’s <strong>Hospital</strong> will be<br />
looking for, and delivering better ways of providing<br />
outstanding care, at better value<br />
12.133 Clinical Handover – Vin Diwakar, Chief Challenge 11.20 30 mins Presentation<br />
Medical Officer<br />
progress<br />
Questions from the public 11.50 5 mins<br />
Every member of staff working for <strong>Birmingham</strong> Children’s <strong>Hospital</strong><br />
will be a champion for children and young people<br />
A report under this objective is scheduled for September<br />
We will strengthen <strong>Birmingham</strong> Children’s <strong>Hospital</strong>’s position as a provider<br />
of Specialised and Highly Specialised Services, so that we become the<br />
leading provider of Children’s Healthcare in the UK
A report under this objective is scheduled for November<br />
We will continue to develop <strong>Birmingham</strong> Children’s <strong>Hospital</strong> as a provider<br />
of outstanding local services: ‘a hospital without walls’, working in close<br />
partnership with other organisations<br />
A report under this objective is scheduled for <strong>July</strong><br />
STRATEGIC ENABLER<br />
A local Operating Framework & Financial Plan to ensure we move from<br />
strategy to action<br />
12.134 Resources Report – Phil Foster, Deputy Chief<br />
Finance Officer and Theresa Nelson, Chief<br />
Officer for Workforce Development<br />
Challenge<br />
progress<br />
11.55 15 mins Enc 04<br />
Questions from the public 12.10 5 mins<br />
GOVERNANCE<br />
12.135 Use of Trust Seal - Gwenny Scott, Company Approve 12.15 5 mins Enc 05<br />
Secretary<br />
Questions from the public 12.20 5 mins<br />
12.136 <strong>Hospital</strong>ity Register Review - Gwenny Scott, Review 12.25 5 mins Enc 06<br />
Company Secretary<br />
Questions from the public 12.30 5 mins<br />
Next Public <strong>Meeting</strong>s:<br />
Annual General <strong>Meeting</strong>: 27 September <strong>2012</strong><br />
Council of Governors <strong>Meeting</strong>: 22 November <strong>2012</strong><br />
Public <strong>Board</strong> <strong>Meeting</strong>: 27 November <strong>2012</strong>
BOARD OF DIRECTORS MEETING<br />
Minutes of the public meeting held on 29 May <strong>2012</strong> at 9.00am<br />
in the Education Centre at <strong>Birmingham</strong> Children’s <strong>Hospital</strong><br />
Present: Keith Lester KL Deputy Chairman<br />
Jon Glasby JG Non Executive Director<br />
Judy Green JAG Non Executive Director<br />
Colin Horwath CH Non Executive Director<br />
Zubair Khan ZK Non Executive Director<br />
Elaine Simpson ES Non Executive Director<br />
Sarah-Jane Marsh SJM Chief Executive Officer<br />
Michelle McLoughlin MM Chief Nursing Officer<br />
David Melbourne DM Chief Finance Officer<br />
Theresa Nelson TN Chief Officer for Workforce Development<br />
Dr Vin Diwakar VD Chief Medical Officer<br />
David Eltringham DE Chief Operating Officer<br />
Attending: Gwenny Scott GS Company Secretary<br />
Tim Atack TA Director of Performance and ICT<br />
Dr Jim Gray DJG Consultant Microbiologist<br />
Observing: David Naylor The Burdett Trust<br />
Minutes: Shelley Smith Executive Assistant<br />
Ref. Item Action<br />
12.079 Apologies<br />
None<br />
12.080 Declaration of Interest<br />
None<br />
12.082 Minutes of the public meeting held on 27 March <strong>2012</strong><br />
The minutes were agreed as a true and accurate record.<br />
12.082 Matters arising from meeting held on 27 March <strong>2012</strong>.<br />
12.053. The <strong>Board</strong> will discuss how the Governors can support schemes practically<br />
[Making Every Contact Count].<br />
MM confirmed this will be picked up as part of the governors’ walkabout process in<br />
<strong>July</strong>.<br />
12.083 Chairman’s Report<br />
KL welcomed David Naylor of The Burdett Trust, who was attending the<br />
meeting as an observer, and gave the following verbal report:<br />
This week BCH celebrates its 150 th birthday. The launch on Monday was a great<br />
success and was the first in a series of events, the majority of which are to say thank<br />
you to staff.<br />
JAG hosted a Civic Reception in the Council House and reported that it was<br />
extremely well attended by staff, and the Lord Mayor of <strong>Birmingham</strong> made all feel<br />
welcome. Two inspirational guest speakers represented the hospital: a Diabetes<br />
Specialist Nurse who pioneered the <strong>Hospital</strong> at Home scheme, and Ben<br />
MacSkimming, a 14 year old patient.<br />
A Volunteer Recognition Ceremony will be held in the marquee today to recognise<br />
the selfless support and vital contribution of volunteers to BCH. ZK and ES will be<br />
1
Ref. Item Action<br />
presenting the awards.<br />
On Thursday KL will be presenting awards at the Bands 1-4 Tea Party Graduation<br />
Ceremony.<br />
KL expressed his gratitude to the other non-executive directors for their continued<br />
support in Joanna Davis’s absence. It is particularly sad that JD is unable to attend<br />
the events this week and all at BCH miss her energy and enthusiasm.<br />
The <strong>Board</strong> noted the verbal report.<br />
There were no questions from the Public.<br />
12.084 Chief Executive’s Report<br />
The Chief Executive reported verbally as follows:<br />
• It is fantastic to be holding a <strong>Board</strong> meeting during our 150 th birthday week,<br />
the focus of which is to say a big thank you to staff. There are various events<br />
during the week, including pampering sessions, which so far are proving very<br />
popular. Over 800 staff have booked on an event.<br />
We have had positive media coverage of the celebrations from ITV and the<br />
<strong>Birmingham</strong> Mail, and the BBC is recording several interviews in order to<br />
screen a lengthy piece on Friday.<br />
• On 25 May we were visited by the Prime Minister, David Cameron who chose<br />
BCH as the location for his announcement about the national roll-out of the<br />
Friends and Family Test from April 2013, which has already been launched<br />
across the Midlands and the East Cluster. Mr Cameron had heard about our<br />
pioneering work on patient experience, including the Friends and Family app<br />
we have developed.<br />
Mr Cameron spent 2 hours visiting wards, talking to patients and staff and<br />
getting involved with things like taking blood pressure and helping children<br />
order meals with the Maple system. He also met with a group of lead nurses,<br />
discussing cultural leadership issues and how nurses fit into the organisation.<br />
He was particularly interested in Safe and Sustainable, the way we are<br />
managing the financial situation and the prominence that MM Chief Nurse<br />
has in the Trust. He remarked as he was leaving that this was the busiest<br />
Children’s <strong>Hospital</strong> he had visited. The visit was covered positively in the<br />
media.<br />
• We had another high profile visit in May from Earl Howe who was interested<br />
in our research into paediatric rare diseases. Many children with these<br />
diseases only make it to early adulthood, so it is vital that research is done<br />
during childhood, and he was interested in how this can be developed. He<br />
visited the CRF and MRI scanner, and we explained some of the special work<br />
the Trust has done, such as the development of special diet food packets by<br />
Anita McDonald which have proved invaluable for many families, especially<br />
those for whom English is not their first language. Earl Howe also spent time<br />
with Tim Barratt and the wider team on the CRF, looking at some of the more<br />
intense studies such as the first inhuman trial in Hunters Syndrome. He was<br />
hugely impressed, particularly with the dedicated ward and the lengths that<br />
2
Ref. Item Action<br />
we go to for patient care. He sent a thank you letter expressing how the visit<br />
has changed his perception about the approach and value of paediatric<br />
research.<br />
• SJM and Jane Powell, Health Advocacy Lead, took part in the SHA Making<br />
Every Contact Count launch day. Of the four organisations that presented we<br />
were the only West Midlands hospital and the only acute hospital that are<br />
using MECC. Most of the public health attendees were impressed with the<br />
level of work we are doing as an acute organisation and other organisations<br />
were keen to work with us on their own schemes.<br />
• JAG and SJM attended the Annual Memorial Service at St Chad’s Cathedral,<br />
which was a beautiful event for bereaved families, very well supported by<br />
staff, especially the Chaplaincy team. SJM read to the <strong>Board</strong> a letter of<br />
thanks from a Sikh family who had attended the service.<br />
• BCH hosted the Association of Paediatric Anaesthetics Annual Conference,<br />
which was attended by anaesthetists from all over the world. There was real<br />
warmth in the room for <strong>Birmingham</strong> and BCH and the President stated that<br />
BCH leads the way in paediatric anaesthesia, supporting other organisations.<br />
• David Barron, Cardiac Surgeon, was awarded the ITV1 Daybreak Health<br />
Heroes Award. Dr Hillary Jones made a surprise visit to the Trust to present<br />
the award live on national TV. David received more nominations than anyone<br />
else in the country.<br />
With all of these events, it feels as though we are starting to fulfil our objective of<br />
throwing our doors open and getting the BCH message as far as we can.<br />
The <strong>Board</strong> noted the verbal report.<br />
There were no questions from the Public.<br />
Every child and young person requiring access to care at <strong>Birmingham</strong> Children’s <strong>Hospital</strong> will be<br />
admitted in a timely way, with no unnecessary waiting along their pathway<br />
12.085 Position Statement<br />
TA presented the report with the following highlights;<br />
• Emergency Department (ED): whilst general waiting times have improved<br />
over the last two months we are still struggling to meet our local standard of<br />
triage and the national standard for average treatment times.<br />
• This month we admitted all emergency and tertiary patients, and we are now<br />
starting to measure non-West Midlands requests, all of which were also<br />
admitted.<br />
• CAMHS: 9 patients could not be supported directly; all were admissions for<br />
Ashfield Unit.<br />
CAMHS have seen a 40% increase in demand over the last few years, partly<br />
due to wider service changes which mean other organisations are no longer<br />
supporting older adolescents, so we have picked up that support. The<br />
Community CAMH Service is also seeing an increase in demand at a time<br />
3
Ref. Item Action<br />
when <strong>Birmingham</strong> City Council is reducing funding for some aspects of<br />
CAHMS and other related services. Both services are looking at current<br />
demand and where they need to be in five years.<br />
• Cancelled Operations continue to be a concern, with 38 operations cancelled<br />
on the day, which was 2.1% of our activity, and a further 25 operations<br />
cancelled the day before. The reasons generally relate to a lack of PICU and<br />
theatre capacity. Gill Derrick, Clinical Director of Specialised Services has<br />
produced a detailed analysis which demonstrates that most cancelled<br />
operations are driven by urgent demand. Urgent unplanned patients are<br />
prioritised to the front of the planned list, which means we cannot always<br />
complete the list. There can also be issues relating to complex patients,<br />
where an operation takes longer than planned. Less complex electives at the<br />
end of the list are then cancelled.<br />
Because we have focused on improving quality through specialist based<br />
theatre teams there is also less flexibility to more patients around.<br />
DE added that theatres run at maximum capacity and the challenge is to<br />
create sufficient headroom within the system to be able to respond to these<br />
urgencies. We could reduce the patient flow, but this would affect our 18-<br />
week wait performance which affects the patient experience in another way.<br />
There are two ways to resolve this problem:<br />
1. Build more operating theatre capacity,<br />
2. Look at operating in ‘retail hours’, later into the evening and on<br />
Saturdays as routine. We do currently do some Saturday lists, but as<br />
it is not routine we pay premium rates.<br />
Work on adopting retail hours has now begun, based on the analysis<br />
undertaken by the directorate.<br />
VD added that the Productive Operating Theatre work may also help address<br />
some of these issues.<br />
The <strong>Board</strong> raised the following points in relation to cancelled operations:<br />
o<br />
o<br />
o<br />
o<br />
Whether we can learn from practices of other organisations.<br />
Whether as a <strong>Board</strong> we should consider an acceptable minimum<br />
number of cancellations, particularly in view of reputational issues.<br />
The level of confidence that the expansion of PICU will start to<br />
address this issue.<br />
The issues relating to a patient with learning disabilities referred to in<br />
the report.<br />
The Executive Team responded as follows:<br />
o<br />
o<br />
A lot of organisations have looked to industry for learning around<br />
cancelled operations. Sherwood Forest <strong>Hospital</strong> for example has<br />
partnered with Unipart and they are starting to learn from their<br />
approach to business. This is something we can look at.<br />
We put the patient at the centre of our decision making about<br />
prioritisation. The Executive Team has discussed in depth with the<br />
specialists in the hospital a potential tolerance level and they are very<br />
4
Ref. Item Action<br />
concerned with the idea. There is a risk that a target would distort<br />
clinical prioritisation, which could create a clinical risk far greater than<br />
the reputational risk.<br />
o<br />
o<br />
The impact of increased physical capacity takes time to be felt as<br />
specialist staff need to be recruited, trained and developed.<br />
The patient with learning disabilities was coming in for repeat tests<br />
and did receive treatment.<br />
• 18 weeks: we are meeting the elective standard, but this has been a real<br />
challenge. Despite increased theatre capacity and productivity, the size of the<br />
surgical waiting lists hasn’t moved over the last twelve months because<br />
demand has increased by 9%, predominantly from the non <strong>Birmingham</strong> area.<br />
Future demand modelling suggests an increase by 20% over the next seven<br />
years.<br />
PICU: 10 West Midlands patients and 4 non West Midlands’s patients could<br />
not be supported by PICU in April, although we did support 9 non West<br />
Midland’s patients.<br />
SJM stated this indicates PICU capacity pressures are not just a local issue<br />
as London, Wales and Gloucestershire are asking BCH for relief. We need to<br />
acknowledge to staff that we recognise that we do not think we have yet<br />
sorted the capacity problem and the physical expansion alone will not resolve<br />
it. KL expressed that he would like to be more visible around the hospital,<br />
and it may be beneficial to arrange to visit some of these areas.<br />
The <strong>Board</strong> noted the performance and the plans for improvement.<br />
There were no questions from the Public.<br />
Every child and young person cared for by <strong>Birmingham</strong> Children’s <strong>Hospital</strong> will be provided with<br />
safe, high quality care, and a fantastic patient and family experience<br />
12.086 Patient Safety Report<br />
VD presented the report to the <strong>Board</strong> with the following highlights:<br />
• VD explained the background to 3 incidents last year which were regarded as<br />
‘Never Events’. They involved the retention of an item after surgery without<br />
the patient’s knowledge or consent. These related to the removal of devices<br />
that were inserted just beneath the skin for intravenous antibiotics. On<br />
removal a tiny piece become detached and was not removed. In the majority<br />
of these types of case it is better to leave the item in place as is does not<br />
cause any harm and may cause more harm to remove.<br />
As a result of these incidents, Tony Lander, Clinical Director for Surgery, has<br />
revised the process to ensure the operating surgeon is familiar with the<br />
device and all its parts, and that the possibility of a piece remaining after<br />
removal is explained to the patient when consent is taken. Since those steps<br />
have been in place there have been no further events. This issue has gained<br />
national attention and there is now a focus on these types of cases across<br />
the NHS.<br />
• Mortality: no concerns.<br />
5
Ref. Item Action<br />
• Respiratory arrests, Acute Life Threatening Events and Unplanned<br />
Admissions to ICU: The data shows an increase in Cardiac Arrests, as we<br />
are now including arrests in ICU. We will be separating this data from arrests<br />
on wards to provide clarity. On the wards they have monitoring to prevent<br />
cardiac arrests, so we should see a low incidence but on PICU there are<br />
occasions where the heart may stop suddenly due to the severe nature of the<br />
patient’s condition or where the patient is recovering from surgery. As yet we<br />
don’t fully understand the measures we can put in place to prevent those<br />
cases from happening. This is the same in children’s hospitals worldwide.<br />
• Pressure sores: we are focusing on reducing grade 2 pressure sores and we<br />
are working to ensure we have the correct data to make sure the grading is<br />
done correctly.<br />
• We had two incidents on PICU over recent months, where antibiotics were<br />
not administered until a few hours after diagnosis. In response, as part of a<br />
National Campaign called ‘Surviving Sepsis’ we are piloting an Antibiotic<br />
Care Bundle in ED before roll out to more complex clinical areas. The<br />
process is appended to the report.<br />
KL queried the selection of ED for the pilot rather than a more complex area<br />
where the incidents occurred. VD responded that it was important to test the<br />
scheme in a lower risk environment to ensure it is safe.<br />
• Handover: VD and his team will be speaking at the National Patient Safety<br />
Congress on the work they are doing to improve the quality of handover.<br />
This is a good opportunity to highlight the Trust’s work on patient safety and<br />
for BCH to learn from other organisations.<br />
The <strong>Board</strong> received and noted the report.<br />
There were no questions from the Public.<br />
12.087 Paediatric Safety Thermometer<br />
MM gave a presentation to the <strong>Board</strong>, with the following highlights:<br />
The Safety Thermometer was launched across the region in March <strong>2012</strong>. This is a<br />
tool which measures harm in 4 areas on one day each month:<br />
• Pressure sores<br />
• Urinary Tract Infections<br />
• VTE<br />
• Falls<br />
We piloted the scheme last year and the clinical teams felt that the process could be<br />
valuable. The SHA have now agreed to support the development of a Safety<br />
Thermometer more pertinent to paediatrics.<br />
MM’s team worked with Governance and VD’s team to identify our top 4 areas of<br />
harm and how they could be measured. The SHA then hosted an event to open the<br />
debate to a wider national audience. All organisations identified pressure sores and<br />
extravasation injuries as vital areas, and additionally agreed a measure for ‘no<br />
avoidable pain’. The group also discussed medication omissions but it was felt that<br />
more time is needed to produce a definition for this measure. The group therefore<br />
agreed that the fourth measure will be the paediatric early warning system (PEWS)<br />
6
Ref. Item Action<br />
as some children’s units do not have this working well yet.<br />
The group also debated the possibility of introducing age categories to reflect the<br />
range from neonatal to adolescent patients. However, it was agreed that this would<br />
complicate the process and at this stage the tool should be a single Paediatric Safety<br />
Thermometer for patients under the age of 18.<br />
An expert reference group has now been set up to set the definitions for the<br />
thermometer and the Trust’s informatics team is working with the SHA to develop an<br />
electronic process to reduce the levels of administration involved.<br />
BCH will be one of 10 national pilot sites for the new process, which will commence<br />
in September <strong>2012</strong> before full roll-out in March 2013.<br />
The <strong>Board</strong> discussed the following matters:<br />
• The benefit to us of measuring PEWS as we already do this well.<br />
This is a national initiative so needs to be relevant to the majority. Other<br />
trusts don’t have the same level of monitoring as BCH and we have set an<br />
objective to take a leadership role for children and young people. We have<br />
other additional ways of measuring harm such as the Nursing Care Quality<br />
Indicators (NCQIs) which we will continue.<br />
• How mental health services are being included.<br />
An adult mental health group is developing a separate process and MM’s<br />
team and the CAMHS team are working with them to develop 4 safety<br />
measures.<br />
• Any risks connected with the process.<br />
There are potential reputational risks when the results are in the public<br />
domain.<br />
• How performance will be improved on the back of data.<br />
As a Trust we are ahead, as we have implemented the NCQIs and we have a<br />
process already in place for pressure ulcers. We will be sharing good practice<br />
with other organisations.<br />
• The way the outcomes will be linked with other data, such as incidents, and<br />
reported to <strong>Board</strong>.<br />
This will come through to the <strong>Board</strong> as part of the Quality Report, which<br />
will integrate all safety and quality data.<br />
MM<br />
• The leadership and cultural challenges involved in introducing this kind of<br />
process.<br />
The <strong>Board</strong> received and noted the report.<br />
There were no questions from the Public.<br />
7
Ref. Item Action<br />
12.088 Infection Control Annual Report<br />
MM and DJG presented the report to the <strong>Board</strong> with the following highlights:<br />
• Last year was the start of a new era for infection control. We had previously<br />
put a lot of time and resource into getting the basics right. Last year we felt<br />
ready to set some challenging objectives, particularly around reducing central<br />
line infections, which is one of the most common types of healthcare<br />
associated infections we see, and reducing antibiotic usage.<br />
• These stretch objectives have been met with room to spare. We aimed to<br />
achieve 25% reduction in line infections and we achieved 33%; we aimed to<br />
achieve 10% reduction in antibiotics and achieved 14%.<br />
• There is a lot more we can do and we have set a further objective that no<br />
child will experience an avoidable infection at BCH. First we have to define<br />
what is ‘avoidable’.<br />
• There is also more we can do on antibiotic usage, ensuring there is no delay<br />
in getting antibiotics and discontinuing them as soon as appropriate.<br />
• The DoH mandatory surveillance changed focus last year from MRSA which<br />
has a low prevalence in paediatrics, to MSSA, which is in the top three<br />
causes of bacteraemia within BCH and most other children’s hospitals. The<br />
target concerned us but by working with parenteral nutrition and<br />
gastroenterology we were able to meet it. Learning from this work will be<br />
applied to Haematology/Oncology.<br />
The <strong>Board</strong> discussed the following points:<br />
• How we compare to other hospitals and is there anything we can learn from<br />
them.<br />
We have been consistently the best performing of the paediatric hospitals in<br />
relation to the DoH measures. It is difficult to compare ourselves on MSSA<br />
with other hospitals because the figures in the public domain are unclear.<br />
• The need to continue to embed the message that infection control is<br />
everyone’s responsibility and that by taking simple measures we can meet<br />
our targets.<br />
• Whether further improvements can be made in relation to blood culture<br />
contamination.<br />
Unnecessary laboratory investigations are bad for the patient and for the<br />
hospital. This is a cultural issue and DJG’s team is working with clinicians to<br />
make use of labs more appropriate.<br />
• Whether there is any cause for concern about infection control compliance<br />
connected with our capacity pressures.<br />
There are no concerns. We have a larger population of infected patients than<br />
most organisations and have a cultural appreciation of infection as a risk. All<br />
infections are monitored weekly and any hospital acquired investigations are<br />
investigated through root cause analysis.<br />
The <strong>Board</strong> congratulated DJG and MM on the successes; approved the report<br />
and confirmed support of the plans to develop infection prevention and control<br />
in line with the Trust’s strategic objectives.<br />
8
Ref. Item Action<br />
There were no questions from the public.<br />
A local Operating Framework & Financial Plan to ensure we move from strategy to action<br />
12.089 Resources Report – month 1 position<br />
David Melbourne presented the report to the <strong>Board</strong> with the following highlights:<br />
• This is the first of a new style report which aims to bring all the threads<br />
together. The Finance and Resources Committee has agreed to meet more<br />
regularly to enable the production of a monthly summary report and a<br />
quarterly, more detailed report for the <strong>Board</strong>.<br />
• Activity: There has been a significant increase in elective activity at 20%<br />
higher than last year. Outpatient activity has also increased, though<br />
unplanned activity is a little lower.<br />
• Monitor: at quarter 1 we are predicting green in all Monitor risk ratings, albeit<br />
there are no finance figures yet.<br />
• Workforce: we are developing a narrative on the implications for staff of the<br />
increase in activity. There was a small decrease in staff from March to April.<br />
Sickness absence has reduced to below the Trust 3% target. Productivity<br />
has improved significantly. Non-consultant appraisals are disappointing,<br />
though some of this maybe related to access to the system. TN added that<br />
the new appraisal system was launched last month, which is essential to our<br />
engagement with staff.<br />
The <strong>Board</strong> discussed the following points:<br />
• The approach to a more lightweight report was commended.<br />
• Adding forecast data would improve the report by acting as an accuracy<br />
gauge and to highlight potential risks.<br />
• The full performance data will not be included next month but a patient<br />
experience section will be introduced.<br />
The <strong>Board</strong> noted and approved the new format of reporting, and noted the<br />
performance concerns and the progress against the <strong>2012</strong>/13 CIP programme.<br />
There were no questions from the public.<br />
12.090 Capital Programme<br />
David Melbourne presented the Capital Programme <strong>2012</strong>/13 to the <strong>Board</strong>, with the<br />
following highlights:<br />
• The report sets out the challenges we have had to face in managing our cash<br />
balances and meeting our short-term and long-term ambitions. The <strong>Board</strong><br />
has approved a Financial Strategy that requires us to develop cash balances<br />
to ensure we can meet our goal of a new hospital facility.<br />
• The financial plan for the year sets aside capital of £10.5 million, the majority<br />
of which is already committed to a range of schemes already approved.<br />
• A Capital Prioritisation Framework has been developed by the Capital<br />
Planning Group to guide investment decisions. This has been applied to the<br />
range of schemes set out in the report, which will come to the <strong>Board</strong> for<br />
approval over the next 18 months.<br />
9
Ref. Item Action<br />
KL added that the Finance and Resources Committee has looked very closely at this<br />
and as chair of that Committee he was happy that there was a robust and rigorous<br />
process. The <strong>Board</strong> needed to consider the following:<br />
1. Whether it approved to the £10.5 million being invested.<br />
2. The process for allocation.<br />
3. The allocated schemes.<br />
The <strong>Board</strong> discussed the following points:<br />
• The framework was robust and gave confidence.<br />
• The need to develop a timeframe for borrowing and investments on the<br />
current site if we move to a new site.<br />
The <strong>Board</strong>:<br />
Approved the approach taken to developing the Capital Programme.<br />
Approved that £10.5 million be set aside for investment in capital projects.<br />
Approved the allocation of the £10.5 million to the schemes identified.<br />
There were no questions from the Public.<br />
Governance<br />
12.091 Report on the use of the Trust Seal<br />
GS presented the report to the <strong>Board</strong>.<br />
The Trust Seal has been used this month on the leasing of premises to provide office<br />
accommodation, freeing up space in the hospital main site to enable expansion of<br />
the PICU and provide additional capacity for CAHMS, KIDS and fundraising.<br />
The <strong>Board</strong> approved the use of the Trust Seal.<br />
There were no questions from the Public.<br />
Date of next Public <strong>Board</strong> <strong>Meeting</strong>: Tuesday, 31 st <strong>July</strong> <strong>2012</strong>.<br />
10
<strong>Board</strong> of Directors<br />
Public <strong>Meeting</strong><br />
Tuesday 31 <strong>July</strong> <strong>2012</strong><br />
Item 12.130 Enc 02<br />
Strategic Objective/ Enabler<br />
Every child and young person requiring access to<br />
care at BCH will be admitted in a timely way, with no<br />
unnecessary waiting along their pathway<br />
Report Title<br />
Strategic Objective 1 - June <strong>2012</strong> Performance Report<br />
Sponsoring Director<br />
Director of Performance & ICT<br />
Author(s)<br />
Director of Performance & ICT<br />
Previously considered by<br />
Executive Management Team<br />
Situation<br />
This report provides the June update on this Trust strategic objective supporting improving<br />
our patient experience. The report highlights where performance is not being met and any<br />
concerns or improvements.<br />
The attachments provide further details on our current and comparative performance.<br />
Background<br />
June overall has seen an improvement in our performance standards, set against a<br />
reduction in demand, in part due to the Whitsun half-term holiday.<br />
Access Standards<br />
ED waits reduced, however, we continue to not meet 2 key standards:<br />
• The local Emergency Department (ED) triage objective was not met (all within 15<br />
minutes), the 95 percentile performance being 30 minutes.<br />
• The ED treatment time standard (average within 60 minutes) was not met, our<br />
performance being 60 minutes.<br />
All ED emergencies were admitted.<br />
A total of 3 tertiary admissions (all from the West Midlands) could not be supported and had<br />
to be admitted to out of region tertiary paediatric centres. 6 patients that were admitted had<br />
to wait over 24 hours before a BCH bed was provided.
CAMHS Tier-4 (Child & Adolescent Mental Health Service)<br />
The West Midlands service is provided by BCH and other providers (some private) with BCH<br />
providing the assessment of all requests.<br />
7 patients could not be supported by BCH CAMHS.<br />
Flow<br />
3 patients’ discharge was delayed due to non-hospital reasons and all 3 patients have<br />
discharge plans.<br />
Cancelled Operations remains as the key performance concern with 23 patients or 1.2% of<br />
all operations cancelled on the day due to hospital reasons. This is above the national 0.8%<br />
standard. The reasons for this are broken down as:<br />
No PICU (Paediatric Intensive Care Unit) bed 11<br />
Operation overrun 9<br />
Staff sickness 2<br />
More urgent patient 1<br />
No patients with Learning Disabilities had their operation cancelled and the ethnic<br />
breakdown of the 23 patients is:<br />
15 - white/British, 1 – asian/asian British Indian, 3 - asian/asian British Pakistani, 1 -<br />
mixed white/Caribbean, 1 – not stated, 2 – white/any other white<br />
A further 4 patients had their operation cancelled by the hospital before the day of the<br />
operation.<br />
Whilst the 18-week standards were met, a total of 46 patients had to wait over 18-weeks for<br />
treatment to start. During the month, 1 urology patient was treated at their 34 th week, the<br />
delay in part due to not being fit for previous operation dates. At the end of June 1 ENT<br />
patient (33 rd week) and 1 cardiology patient (35 th week) have requested to wait longer.<br />
The total surgical elective waiting list is 15% higher than this time last year (due to demand).<br />
When the plans to increase capacity come to fruition, this will lead to a short-term drop in 18-<br />
week performance as we treat all the patients waiting > 18 weeks.<br />
The local 90% CAMHS 18-week standard was not met, performance being 88.8%. With<br />
support from commissioners, additional staffing is being recruited to reduce waiting times.<br />
PICU (Paediatric Intensive Care Unit)<br />
The West Midlands (WM) PICU service is provided by BCH, University <strong>Hospital</strong>s of North<br />
Staffordshire NHS Trust and the KIDS (Kids Intensive care Decision Support) service run by<br />
BCH.<br />
PICU has remained under significant demand. A new KIDS activity graph is included that<br />
demonstrates the increase in demand over the past year.<br />
2 WM patients could not be supported with 1 patient going to Leicester and 1 out of region.<br />
1 non-WM request could not be supported, however a total of 5 non-WM requests were
supported (1 by BCH PICU, 3 by BCH non-PICU beds and 1 by North Staffs PICU).<br />
Assessment<br />
Waits and cancellations generally improved in June. Key actions to improve performance<br />
include:<br />
Emergency Department (ED):<br />
• The Emergency Care Pathway project has been re-energised with a new Project<br />
Manager and additional support to ED.<br />
• Supported by new Trauma Centre funding, an additional ED consultant and additional<br />
senior registrars have been recruited. The staff will be fully in place by January 2013 and<br />
will provide enhanced senior medical input into ED including 24-hour dedicated ED<br />
senior registrar cover.<br />
• Additional Advanced Nurse Practitioners have been appointed.<br />
• Development of the ED estate, including improvements to treatment rooms and waiting<br />
areas.<br />
• Plans have been developed to expand the general paediatric team to provide extended<br />
evening and 7-day consultant support to the Paediatric Assessment Unit and ED.<br />
PICU Capacity:<br />
• The first 4 of the 9 additional PICU beds open in September, with the remaining beds<br />
opening over the following year as new staff become fully PICU trained. This takes PICU<br />
up to 31 beds. 2 flex beds have opened in the interim.<br />
• In the autumn a new High Dependency support service is in place, providing support to<br />
all ward areas.<br />
• We aim to have in place by the winter a new enhanced 4-bedded Medical High<br />
Dependency Unit, co-located by PICU, to manage patients currently supported by PICU.<br />
This development is being discussed with the NHS Specialist Commissioning Team.<br />
We continue to work with commissioners to review the ongoing growth in demand, and<br />
establish short and long term plans to increase our capacity to support this demand and<br />
ensure our standards are met.<br />
Recommendations<br />
Trust <strong>Board</strong> is asked to note the performance and plans for further improvement.<br />
Key Risks<br />
Risk Description Controls Assurances<br />
Insufficient capacity in place<br />
to meet service demands<br />
Appropriate escalation<br />
systems in place<br />
Capacity plans being<br />
renewed and developed.<br />
This includes modelling<br />
capacity/demand between<br />
now and 2020 (new hospital)<br />
Daily, weekly and monthly<br />
reporting in place.<br />
Revised capacity plans being<br />
produced.
PICU capacity task group<br />
established<br />
Key Impacts<br />
Strategic Objectives<br />
This reports covers progress against meeting the strategic<br />
objectives linked to supporting improving our patient<br />
experience.<br />
CQC Registration (state<br />
outcome)<br />
Not directly<br />
NHS Constitution<br />
Yes – treatment within 18-weeks is a requirement within the<br />
NHS Constitution.<br />
Other Compliance (e.g.<br />
NHSLA, Information<br />
Governance, Monitor)<br />
Many of the indicators are local or national standards<br />
monitored by the Department of Health, Monitor and our<br />
Commissioners.<br />
Equality, diversity & human<br />
rights<br />
No<br />
Trust contracts<br />
Some of the planned improvements support delivery of QIPP<br />
initiatives and non-delivery of NHS standards can result in<br />
financial penalties<br />
Other<br />
<strong>Meeting</strong> the strategic objectives raises the profile of Trust<br />
locally, regionally and nationally
Strategic Objective Report<br />
Every child and young person requiring access to<br />
care at <strong>Birmingham</strong> Children’s <strong>Hospital</strong> will be<br />
admitted in a timely way, with no unnecessary<br />
waiting along their pathway<br />
June <strong>2012</strong><br />
Tim Atack<br />
Director of Performance & ICT<br />
1
Our Performance Dashboard – June <strong>2012</strong><br />
2
ACCESS<br />
Emergency Department – Transfers Out<br />
No patients were transferred out during June.<br />
3
Emergency Department<br />
4
Tertiary Referrals<br />
IP Tertiary<br />
•There were 161 referrals for specialist beds at<br />
BCH.<br />
• 3 patients were unable to get a bed at BCH<br />
• 6 patients had to wait over 24 hours to be<br />
offered a bed at BCH.<br />
• 18 patients were deemed to no longer require<br />
a bed at BCH<br />
5
Tertiary Referrals<br />
( ) = not hospital delays/out of region patients/referred from home patients<br />
6
CAMHS Referrals<br />
Delayed Discharges<br />
7 patients could not be supported by<br />
BCH CAMHS<br />
3 patients discharge is delayed due to<br />
non-medical reasons. All patients are<br />
due to be discharged in <strong>July</strong> or August<br />
7
FLOW<br />
Cancelled Operations<br />
Cancelled Operations<br />
23 for June (1.22%) above the national 0.8% target.<br />
The ethnic breakdown of the patients is:<br />
15 - white/British, 1– asian/asian British Indian, 3- asian/asian<br />
British Pakistani, 1 –– mixed white/Caribbean, 1 – not stated,<br />
2 –white/any other white.<br />
No patients with Learning Disabilities were cancelled.<br />
A further 4 patients had their operation cancelled by the hospital<br />
before the day of the operation.<br />
8
Cancelled Operations<br />
9
18-weeks<br />
The standards were met for June 90.2% admitted, 98.6 % non-admitted and 98.4%<br />
incomplete patients, however a total of 46 patients were not treated within 18-weeks due<br />
to a lack of hospital capacity.<br />
Patients waiting over 30 weeks<br />
1 urology patient was treated at their<br />
34 th week, the delay in part due to<br />
not being fit for previous operation<br />
dates.<br />
1 ENT patient (33 rd week) and 1<br />
cardiology patient (35 th week) have<br />
requested to wait longer.<br />
1 urology patient (34 th week) waiting<br />
for treatment, in part due to not<br />
being fit for treatment<br />
10
18-weeks - CAMHS<br />
The local 90% standard was not met in June, actual performance was 88.8%. Additional<br />
staffing (funded by commissioners) is being recruited to address waiting time concerns.<br />
11
PICU Demand<br />
PICU has remained under significant demand<br />
which has impacted on both the ability to<br />
admit emergency patients and support complex<br />
elective surgery. The financial implications of<br />
this are explored in more detail later.<br />
A total of 2 WM patients could not be<br />
supported with 1 patients going to Leicester<br />
and 1 out of region.<br />
A further 1 non-WM requests could not be<br />
supported, however a total of 5 non-WM<br />
requests were supported (1 BCH PICU, 3 BCH<br />
non-PICU beds and 1 other WM PICU).<br />
12
Strategic Objectives<br />
Category Performance Indicator Performance Target<br />
Discharge<br />
Delays<br />
Discharge<br />
Delays<br />
No patient will leave the emergency<br />
department without being seen<br />
Lead<br />
Chief<br />
Officer<br />
R A G Apr-12 May-12 Jun-12 YTD<br />
Last year<br />
position<br />
Median time from arrival COO 9 9 8 9 11<br />
95th percentile COO >15 15 32 34 30 32 42<br />
Single longest total time COO 250 75 399 250 107<br />
Median time from arrival COO >60 - 4 4 4 4 5 - 0 0 0 6 3 9 4<br />
% of patients COO >0 0 0 3.04 1.86 4.2 0.22<br />
Number of patients COO 7 23 6 36 53<br />
% of patients COO 5.2 11.7 3.7 7.3 2.9<br />
Number of patients COO >0 0 0 7 3 10 NA<br />
% of patients COO >0 0 0 3.6 1.86 2 NA<br />
Number of patients not<br />
admitted to a CAMHS bed<br />
COO 9 4 7 23 75<br />
% of patients not admitted to<br />
a CAMHS bed.<br />
COO 47.4 36.4 53.8 51 48.2<br />
FLOW<br />
Delayed discharge total patients Total patients COO 2 1 3 6 NA<br />
Delayed discharge total bed days Total bed days COO 60 31 81 172 NA<br />
Comments<br />
Every child and young person requiring access to care at <strong>Birmingham</strong> Children’s <strong>Hospital</strong> will be admitted in a timely way, with no unnecessary waiting<br />
along ACCESS their pathway<br />
ED deflections Number of patients deflected COO 0 0 0 0 0<br />
Emergency<br />
Department<br />
Tertiary<br />
Referrals<br />
Tertiary<br />
Referrals<br />
CAMHS<br />
No patient (All patients) will wait more<br />
than 15 minutes for initial full<br />
assessment<br />
No patient will wait more than 1 hour to<br />
start of definitive treatment from a<br />
decision making clinician<br />
No patient will spend more than 4<br />
hours in total in the emergency<br />
department<br />
Tertiary Refusals (Number/%)<br />
Tertiary Referrals - Patients that did<br />
not get a bed within 24 hours of asking<br />
Tertiary Tertiary Refusals (Number/%)<br />
Referrals - ALL<br />
Patients that requested a BCH T4<br />
CAMHS bed and were not admitted<br />
following a gateway assesment<br />
Excludes non-BCH<br />
catchment<br />
Excludes non-BCH<br />
catchment<br />
ALL requests
Strategic Objectives continued …<br />
Category Performance Indicator Performance Target<br />
Cancelled<br />
Operations<br />
Cancelled<br />
Operations<br />
RTT Waiting<br />
Times<br />
Diagnostic<br />
Waits<br />
PICU<br />
Provider cancellation of Elective Care<br />
operation for non-clinical reasons<br />
either before or after Patient admission<br />
Breach of clause 40.5 (Admitted patient<br />
and had operation cancelled for non clinical<br />
reasons. The provider needs to offer them a<br />
date within 5 operational days which falls within<br />
28 days from cancellation.)<br />
Lead<br />
Chief<br />
Officer<br />
R A G Apr-12 May-12 Jun-12 YTD<br />
Last year<br />
position<br />
Comments<br />
FLOW<br />
Number of cancellations COO 38 39 23 77 347 June 2011 - 20<br />
% of cancellations COO 1.5 - 0.8 2.1 1.96 1.22 1.76 1.6<br />
100% compliance COO 90 - 90 90.7 90.3 90.2 90.4 91.6<br />
% of non admitted over 18 weeks 95% non admitted COO >95 - 95 99.3 99.3 98.6 99.1 98.9<br />
% of incomplete over 18 weeks 92% incomplete COO >92 - 92 97.7 97.7 98.4 98 97.9<br />
CAMHS - number of non admitted over<br />
18 weeks<br />
COO Trend<br />
33 31 64<br />
CAMHS - % of non admitted over 18<br />
weeks<br />
90% non admitted COO 90 88.6 87.6 88.8 88.6<br />
Diagnostic waits number >6 weeks COO 0 0 0 0<br />
Diagnostic waits % >6 weeks Operating Standard 99% COO
Category Performance Indicator Performance Target<br />
Lead<br />
Chief<br />
Officer<br />
R A G Apr-12 May-12 Jun-12 YTD<br />
Expanding our <strong>Hospital</strong> at Home Services<br />
CPO<br />
Local strategy for children’s general services<br />
CMO<br />
Working in partnership to develop new and innovative<br />
COO<br />
CAMHS models<br />
ENABLERS<br />
Our ‘people strategy’ so everyone knows what role they have to play and how they will be supported<br />
People Strategy<br />
CWD<br />
A local Operating Framework & Financial Plan to ensure we move from strategy to action<br />
Resources report<br />
CFO<br />
A strategy to deliver a modern environment, fit for an ambitious 21st century hospital<br />
New <strong>Hospital</strong> Project<br />
CFO<br />
Brand and Reputation<br />
150 years celebrations<br />
CEO<br />
Last year<br />
position<br />
Comments<br />
Every child and young person cared for by <strong>Birmingham</strong> Children’s <strong>Hospital</strong> will be provided with safe, high quality care, and a fantastic patient and family<br />
experience<br />
Every member of staff working for <strong>Birmingham</strong> Children’s <strong>Hospital</strong> will be looking for, and delivering better ways of providing outstanding care, at better<br />
value<br />
Emergency Care pathway<br />
COO<br />
June-Sept<br />
Research Output profile<br />
CMO<br />
Sept – Nov<br />
Equipping staff to create value<br />
CWO<br />
Nov-Jan<br />
Better use of staff and physical resources<br />
CFO<br />
Feb-March<br />
Every member of staff working for <strong>Birmingham</strong> Children’s <strong>Hospital</strong> will be a champion for children and young people<br />
National Strategy for Children’s specialised services<br />
CEO<br />
June-<strong>July</strong><br />
Making every contact count<br />
CNO<br />
Oct-Dec<br />
YPAG<br />
CNO<br />
Dec-March<br />
We will strengthen <strong>Birmingham</strong> Children’s <strong>Hospital</strong>’s position as a provider of Specialised and Highly Specialised Services, so that we become the<br />
leading provider of Children’s Healthcare in the UK<br />
Safe & Sustainable Designation<br />
CMO<br />
June – <strong>July</strong><br />
National Centre for rare diseases<br />
CMO<br />
Sept-Nov<br />
Children’s surgery review<br />
CMO<br />
Jan-Feb<br />
We will continue to develop <strong>Birmingham</strong> Children’s <strong>Hospital</strong> as a provider of outstanding local services: ‘a hospital without walls’, working in close<br />
partnership with other organisations<br />
Jan-March<br />
June-<strong>July</strong><br />
<strong>July</strong>-Sept<br />
June<br />
Monthly<br />
April<br />
May?
<strong>Board</strong> of Directors<br />
Public <strong>Meeting</strong><br />
31 <strong>July</strong> <strong>2012</strong><br />
Item 12.131 Enc 03<br />
Every child and young person cared for by <strong>Birmingham</strong><br />
Strategic Objective Children’s <strong>Hospital</strong> will be provided with safe, high quality care,<br />
and a fantastic patient and family experience<br />
Report Title<br />
Sponsoring Director<br />
Contributors<br />
Previously considered by<br />
Quality Report<br />
Dr Vinod Diwakar, Chief Medical Officer & Michelle<br />
McLoughlin, Chief Nurse<br />
Associate Chief Medical Officer (Safety), Governance<br />
Services, Corporate Nursing, Education & Learning<br />
EMT<br />
Situation<br />
The enclosed report provides a monthly update on key clinical safety topics.<br />
Background<br />
The report is collated from a number of information sources and provides assurance that key<br />
risks to quality and safety are being escalated and monitored until sufficient action has been<br />
taken to address the concerns.<br />
The report includes information on key risks, serious incidents, mortality data, cardiac arrest,<br />
respiratory arrest and other acute life threatening events. Information on Never Events and<br />
other safety information is included by exception.<br />
The report also includes other key information about quality, including infection control rates,<br />
Safety Thermometer outcomes, formal complaints, PALS and other patient experience data.<br />
Assessment<br />
Please see the enclosed report for a discussion of the key risks.<br />
Review the enclosed report.<br />
Recommendations
Key Risks<br />
Risk Description Controls Assurances<br />
Failure to correctly identify the<br />
greatest risks to the quality of<br />
care and safety of our<br />
patients.<br />
• Directorate<br />
Governance systems<br />
• <strong>Board</strong> Assurance<br />
Framework<br />
• Risk Register<br />
• Safety Strategy<br />
• Safety Dashboard<br />
Key Impacts<br />
• Monthly <strong>Board</strong> Safety Report<br />
• Mortality Review<br />
• Monitoring of incident<br />
trends<br />
• Monitoring of complaints<br />
trends<br />
Strategic Objectives<br />
The information provided in this report contributes to the<br />
delivery of our strategic objective that Every child and<br />
young person cared for by <strong>Birmingham</strong> Children’s <strong>Hospital</strong><br />
will be provided with safe, high quality care, and a fantastic<br />
patient and family experience.<br />
CQC Registration (state<br />
outcome)<br />
All, but particularly:<br />
Standard 16 Assessing & monitoring the quality of service<br />
provision could be affected by a failure to manage risks<br />
highlighted by the report.<br />
NHS Constitution<br />
None<br />
Other Compliance (e.g.<br />
NHSLA, Information<br />
Governance, Monitor)<br />
This report includes key quality information which should be<br />
considered by the <strong>Board</strong>. Failure to do so could impact on<br />
maintaining NHSLA level 3 compliance for Standard 1<br />
(Governance).<br />
Equality, diversity & human<br />
rights<br />
None<br />
Other<br />
None
Quality Report:<br />
Safety & Patient Experience<br />
<strong>July</strong> <strong>2012</strong><br />
Vin Diwakar, Chief Medical Officer<br />
Michelle McLoughlin, Chief Nurse
The BCH Vision of Quality<br />
Strategic Objectives which reflect our commitment to Quality, Safety and a fantastic patient Experience.<br />
Every child and<br />
young person<br />
requiring access to<br />
care at <strong>Birmingham</strong><br />
Children’s <strong>Hospital</strong><br />
will be admitted in a<br />
timely way, with no<br />
unnecessary waiting<br />
along their pathway<br />
Every child and<br />
young person cared<br />
for by <strong>Birmingham</strong><br />
Children’s <strong>Hospital</strong><br />
will be provided<br />
with safe, high<br />
quality care, and a<br />
fantastic patient and<br />
family experience<br />
Every member<br />
of staff working<br />
at <strong>Birmingham</strong><br />
Children’s<br />
<strong>Hospital</strong> will be<br />
looking for, and<br />
delivering better<br />
ways of<br />
providing care,<br />
at better value<br />
<strong>Birmingham</strong> Children’s<br />
<strong>Hospital</strong>’s leaders will<br />
work hard to strengthen<br />
its position as a provider<br />
of Specialised and Highly<br />
Specialised Services, so<br />
that it becomes the<br />
national provider of<br />
Children’s Healthcare<br />
Services in the UK<br />
<strong>Birmingham</strong><br />
Children’s<br />
<strong>Hospital</strong> will<br />
continue to<br />
develop as ‘a<br />
hospital without<br />
walls’, working in<br />
close partnership<br />
with other<br />
organisations<br />
<strong>Birmingham</strong><br />
Children’s<br />
<strong>Hospital</strong> will be<br />
a champion for<br />
children and<br />
young people.<br />
Clinical Quality is our organising principle. It has always<br />
been our mission to provide outstanding care and<br />
treatment to all children and young people who choose<br />
and need to use our services, and to share and spread new<br />
knowledge and practice, so we are always at the forefront<br />
of what is possible. Our vision is to be the leading provider<br />
of healthcare for children and young people, giving them<br />
care and support – whatever treatment they need – in a<br />
hospital without walls<br />
The physical capacity of the estate is the biggest challenge<br />
to this vision. Thus, our clinical quality strategy is founded<br />
on capital investment in our estate, modernisation of care<br />
pathways, equipping our staff with the skills to use our<br />
existing resources more safely, effectively and efficiently,<br />
and partnership working to deliver healthcare for children<br />
and young people closer to their home wherever possible.<br />
We have built in a relentless focus on the experiences of our children,<br />
young people and families at every level.<br />
We want to be a place where safety is everyone’s top priority and<br />
have set the following 3yobjectives to reflect this:<br />
• Continue development of tools to prevent predictable and<br />
preventable cardiac and respiratory arrests, reduce extravasation<br />
injuries and medication incidents, improve time from decision to<br />
administration of antibiotics, and prevent Grade 2 pressure sores<br />
• Reduce risks in the handover of patients between services and<br />
caregivers during their inpatient stay<br />
• Develop a Trust wide quality outcomes dashboard<br />
• Introduce new methods of collecting and responding to the<br />
experience of our patients and families in real time using web<br />
technology
High Risks<br />
One high clinical risk is recorded on the risk register, this relates to the cardiac waiting list.<br />
Specialty<br />
/Area<br />
Issue<br />
Consequence<br />
Likelihood<br />
Action<br />
Cardiac Services<br />
RISK No: 1234<br />
There are a number of patients<br />
defined as clinically urgent that are<br />
awaiting cardiac surgery. Continued<br />
capacity issues in PICU mean that<br />
these patients cannot be offered<br />
dates for their operations.<br />
4 4 There are a number of ongoing actions to manage this risk, and the length of<br />
the waiting list has decreased over the last two weeks.<br />
Continued close monitoring of patients and availability of PICU beds.<br />
Reassessment of patients by cardiologists. Reprioritisation of patients based<br />
on changes to clinical condition. Restrictions on out of region referrals.<br />
Waiting list management has been reviewed by NHS IMAS to ensure that this<br />
is optimal. Additional PICU beds will open in September <strong>2012</strong> which will<br />
increase capacity. There are also longer term plans to explore the potential to<br />
expand the PIC network and to explore a further increase the number of PIC<br />
beds at BCH over the next 10 years.<br />
A critical care outreach team (PACE), an increase in MHDU beds and increased<br />
Consultant General Paediatrician posts will also increase PICU capacity for<br />
cardiac patients.
Learning from Incident<br />
Investigations (Closed cases)<br />
Two Serious Incident Requiring Investigation (SIRI) were completed in June <strong>2012</strong>.<br />
Investigation 1<br />
This case involved a noted increase in diarrhoea<br />
and vomiting symptoms on Ward 5, and was<br />
treated as an outbreak of Norovirus.<br />
The investigation was unable to identify the Root<br />
Cause of the outbreak and no failures in care were<br />
identified.<br />
The review did identify a number of areas of good<br />
practice.<br />
Investigation 2<br />
This case also involved an outbreak of diarrhoea and vomiting symptoms, and<br />
was treated as an outbreak of Norovirus. This case involved Ward 9 (surgical<br />
ward). The outbreak lasted 10 days but affected fewer patients and staff than<br />
the outbreak on Ward 5.<br />
Again, the investigation was unable to identify the Root Cause of the outbreak.<br />
The only possible contributory factor identified was the fact that we were not<br />
able to carry out a rolling cleaning programme on this ward due to the layout<br />
of the ward.<br />
In future we will consider ‘zoning’ patients to allow this.<br />
Areas of good practice identified by these two investigations included:<br />
•High levels of cleaning - stepped up as required.<br />
•The responsiveness of our domestic team was excellent.<br />
•Visiting restrictions were adhered to and hand hygiene of visitors was very good. The use of posters had a big impact.<br />
•The quality and regularity of internal communication was excellent.<br />
•Introducing alcohol gel in Ronald McDonald House (Parent accommodation) as well as in-house parent accommodation.<br />
•Restricting movement of staff and patients between wards<br />
•Communication with external agencies (the PCT and the HPU) was excellent, as was the support that was provided by these agencies.
Learning from Incident<br />
Investigations (New Cases)<br />
There have been two new Serious Incidents Requiring Investigation since the last report.<br />
Both involved care delivered in the Emergency Department (ED).<br />
12/13:12<br />
A patient presented at the ED with a swollen leg. It was not possible to reach a diagnosis that day,<br />
therefore the patient was reviewed in a clinic 2 days later. Unfortunately, a diagnosis was still not<br />
possible, as an MRI scan was required and the patient would need a general anaesthetic for this<br />
scan. The patient was handed over to the general paediatrics team.<br />
There appeared to be delays in carrying out the MRI scan, and this was not completed for a<br />
number of weeks. The patient is now under the care of the Trauma and Orthopaedics team. It is<br />
not clear if the delay has led to the patient suffering additional harm.<br />
There were no<br />
new Never<br />
Events in June<br />
<strong>2012</strong><br />
12/13:18<br />
A patient attended the ED with upper respiratory symptoms. This patient was an ex pre-term 26 week gestation baby with chronic<br />
lung disease, on home oxygen with a congenital cardiac condition of Atrial Septal Defect (ASD), pulmonary valve stenosis and<br />
moderate pulmonary hypertension. Following review and assessment by a medic, the patient was discharged home.<br />
The patient was found unresponsive at home the following day, and could not be resuscitated. We will review whether there are<br />
any concerns with the discharge. (Please note that this case is included under the Mortality Details section)
Mortality<br />
Mortality data is presented in a number of ways, and an overall picture can only be gained by using a<br />
number of indicators. These are:<br />
•Absolute number of deaths per time period.<br />
•Number of deaths per time period per 1000 admissions.<br />
•Standardised mortality ratio.<br />
•Cumulated sum (CUSUM) charts.<br />
•Review of individual deaths.<br />
Inpatient deaths per 1000 admissions<br />
This is a simple calculation to overcome any<br />
variations in admission numbers over time<br />
(e.g. the hospital may have more admissions in<br />
the winter months) or between hospitals of<br />
different sizes. Data can be compared<br />
between organisations by this method as it<br />
allows for different admission numbers but it<br />
is limited as a tool for comparison as there is<br />
no modification for case mix. The graph on the<br />
right shows the number of inpatient deaths<br />
per 1000 inpatient admissions at BCH since<br />
March 2011. Please note that the figure below<br />
does not include deaths which occurred in the<br />
Emergency Department.<br />
14<br />
12<br />
10<br />
8<br />
6<br />
4<br />
2<br />
0<br />
Absolute Number of Deaths<br />
The simplest way to represent mortality is as an<br />
absolute number of deaths in a particular time<br />
period; however it does not take into consideration<br />
either the number of admissions to the hospital or<br />
the case mix of patients. It is useful only as a sense<br />
guide to other data as it has not been modified in<br />
any way. Data cannot be compared between<br />
organisations in this format.<br />
Deaths<br />
Deaths per 1000 Admissions
Standardised Mortality Ratio (SMR)<br />
In order to account for differences in case mix for different organisations the idea of standardised<br />
mortality ratios has been developed. This attempts to account for differences in patients, such as<br />
diagnosis, age and pre-existing medical problems, and allows for comparisons between hospitals.<br />
A standardised mortality ratio (SMR) is the ratio of the actual number of deaths in a hospital within a<br />
given time period, to the number that might be expected if the hospital had the same death rates as a<br />
larger reference population (e.g. all English <strong>Hospital</strong>s).<br />
The SMR scores can be presented in a number of ways.<br />
Run Chart<br />
This shows how the standardised<br />
mortality rate of a hospital changes over<br />
time. If there are a small number of<br />
deaths in each time period then the<br />
month to month variation can be quite<br />
wide (as is the case with BCH where<br />
there are on average 4-12 deaths a<br />
month).<br />
The spikes in April and May 2011’s SMR<br />
have been reviewed and did not raise<br />
any concerns. The SMR over the last year<br />
has returned to normal levels.
Bar chart presenting data comparing a number<br />
of hospitals:<br />
This shows the position of an individual hospital in comparison<br />
with its peer group. It is easy to understand but does not give<br />
much information about whether our outcomes are unusual. The<br />
graph presented below shows 6 month’s worth of data rather<br />
than 12 as previously presented. This means that the impact of<br />
the increased SMR in April and May 2011 has reduced and our<br />
SMR has fallen from 140 to 124.<br />
August 2011 - February <strong>2012</strong><br />
BCH<br />
Funnel plot<br />
This shows the standardised mortality ratio on the Y axis, and the<br />
number of expected deaths on the X axis. Control limits can be<br />
applied, so that it is possible to see how likely that the variation<br />
from a score of 100 is by chance only. In the example below an<br />
amber dot occurs if there is between a 0.3% (1 in 330) and 5% (1 in<br />
20) likelihood that the score is different from 100 by chance and a<br />
red dot if there is less than a 0.3% likelihood that the score is<br />
different from 100 by chance. Such warnings should be investigated<br />
as to cause.<br />
The funnel plot below is presented using 6 month’s worth of data<br />
which means that the increase in SMR which resulted from the spike<br />
in April and May 2011 has decreased and we have returned to the<br />
green section of the plot.
Deaths in the Paediatric Intensive Care Unit (PICU)<br />
CUSUM Charts<br />
Another way of representing outcome data is by cumulated sum charts. These can be used where there is<br />
a score available to give a risk of mortality for each individual patient. Currently this method is in use at<br />
BCH for intensive care and cardiac surgery patients.<br />
The charts use data from all patients, not just deaths, so are more powerful than SMR in detecting<br />
problems.<br />
For BCH, the PICU CUSUM<br />
is a good reflection of<br />
overall hospital mortality<br />
as over 70% of deaths at<br />
the hospital occur on<br />
PICU. There is no<br />
evidence of systemic care<br />
failures which could have<br />
contributed to deaths on<br />
PICU.
Respiratory Arrests, ALTEs and<br />
Unplanned Admissions to PICU<br />
Explanation of Data<br />
Unplanned admissions to PICU are a measure of<br />
how well we are monitoring patients on the wards.<br />
Good monitoring on the wards means that we will<br />
pick up deteriorating patients more quickly<br />
therefore allowing us to admit them to PICU when<br />
required. A combination of high levels of<br />
unplanned admissions and low levels of cardiac<br />
arrests, respiratory arrests and acute life<br />
threatening events (ALTEs) means that we are<br />
monitoring and escalating clinical deterioration in a<br />
timely manner.<br />
Number<br />
40<br />
35<br />
30<br />
25<br />
20<br />
15<br />
10<br />
5<br />
0<br />
Jul-11<br />
Aug-11<br />
CRQAC Data: Arrests/ Unplanned PICU Admissions<br />
Sep-11<br />
Oct-11<br />
Nov-11<br />
Dec-11<br />
Jan-12<br />
Feb-12<br />
Mar-12<br />
Apr-12<br />
May-12<br />
Jun-12<br />
Cardiac arrests<br />
Respiratory<br />
Arrests<br />
ALTES<br />
Unplanned<br />
admissions to PIC<br />
PIC Cardiac<br />
Arrests<br />
August 2011: PICU<br />
cardiac arrests<br />
included in data set<br />
Details of Cardiac Arrests<br />
There were 4 ED reported cardiac arrests in June <strong>2012</strong>. However, all of these were out of hospital arrests.<br />
There were no ward based cardiac arrests in June.<br />
PICU based cardiac arrests – May <strong>2012</strong><br />
In line with the revised review process for PICU cardiac arrests, the arrests that took place in May have now been<br />
reviewed at the PICU Mortality and Morbidity (M&M) meeting.<br />
All 3 cases were found to be not predictable and not preventable.
Monitoring Infection control<br />
June <strong>2012</strong><br />
• MRSA bloodstream infections: zero<br />
• MSSA bloodstream infections: one post-48hour<br />
case<br />
• E. coli bacteraemia: zero<br />
• Glycopeptide-resistant enterococci: zero<br />
• C. difficile: zero<br />
However, one case of C.diff was diagnosed in<br />
another hospital within 24 hours of discharge<br />
from BCH. The rationale for testing for C.diff in<br />
this case is currently not understood as the<br />
patient was reported not to have symptoms<br />
indicative of C.diff<br />
E-Coli - Pre 48 hours<br />
MSSA - Pre 48 hours<br />
4<br />
3<br />
2<br />
1<br />
0<br />
2011/…<br />
<strong>2012</strong>/…<br />
5<br />
4<br />
3<br />
2<br />
1<br />
0<br />
2011/12<br />
<strong>2012</strong>/13<br />
E-Coli Post 48 hours<br />
MSSA - Post 48 hours<br />
4<br />
5<br />
3<br />
4<br />
2<br />
3<br />
1<br />
0<br />
2011/12<br />
<strong>2012</strong>/13<br />
2<br />
1<br />
0<br />
2011/12<br />
<strong>2012</strong>/13
Safety<br />
Thermometer<br />
The monthly point prevalence of the four<br />
adult harm groups (Pressure ulcers,<br />
Catheter associated Urinary Tract<br />
Infections, Falls, VTEs) continues.<br />
Graph1<br />
We now ensure that when a pressure<br />
ulcer is identified a clinical expert reviews<br />
the care. So far, care has been<br />
appropriate in all cases. The slight<br />
increase in prevalence of pressure ulcers<br />
(Graph 1) could be attributed to an<br />
increased awareness amongst nursing<br />
staff.<br />
The percentage of harm free care has not varied<br />
over time and remains high, although it should be<br />
remembered that this is an adult tool not<br />
sensitive to a paediatric case load (Graph 2).<br />
Graph2<br />
Development of a paediatric version of this safety<br />
tool continues. The four paediatric harms have now<br />
been agreed by an expert reference group and are:<br />
extravasation, Paediatric Early Warning Scores, pain,<br />
and pressure ulcers. Testing will commence in<br />
August <strong>2012</strong> .
Complaints<br />
Key facts:<br />
•16 Formal Complaints in Q1<br />
•111 Formal Complaints Received in 2011/12<br />
•33 individual issues were identified within the 16 complaints received in Q1.<br />
•In Q1, 1 complainant made a referral to the Ombudsman<br />
Frequency of Complaints over 6 years<br />
40<br />
30<br />
20<br />
10<br />
0<br />
No of Formal Complaints<br />
Complaints per 1000 admissions in the last 12 months<br />
14<br />
12<br />
10<br />
8<br />
6<br />
4<br />
2<br />
0<br />
Complaints<br />
Complaints per 1000<br />
Admissions
Complaints According to Theme<br />
Quarter 1<br />
5<br />
6<br />
5<br />
6<br />
Waiting, delays,<br />
cancelations and access<br />
to services<br />
Staff Attitude<br />
2<br />
1<br />
2<br />
Outpatient delays &<br />
cancellations<br />
Inpatient delays &<br />
cancellations<br />
Access to services<br />
Quality of treatment<br />
Admission Discharge &<br />
Transfer<br />
11<br />
Communication<br />
Other<br />
2<br />
1 Nursing<br />
3<br />
Medical<br />
Patient's<br />
Status,Discrimination<br />
AHP<br />
Pattern over 15 months<br />
30<br />
25<br />
20<br />
Waiting, delays &<br />
cancellations<br />
Staff Attitude<br />
2 Oral<br />
Communication<br />
3 Written<br />
Communication<br />
15<br />
Quality of Treatment<br />
10<br />
5<br />
0<br />
Q4 1011 Q1 1112 Q2 1112 Q3 1112 Q4 1112 Q1 1213<br />
Communication<br />
Other<br />
2<br />
1 Quality of Nursing Care<br />
2<br />
Quality of Medical Care<br />
6<br />
Quality of overall service<br />
Appropriateness of<br />
Treatment
Some Complaints Issues<br />
Quality of Nursing Care<br />
•Nurse behaving in an ‘inappropriate<br />
manner’<br />
Quality of Medical Care<br />
•‘Lack of supervision throughout’<br />
•Concerns about misdiagnosis of fracture<br />
•Concerns raised about problems<br />
following surgery<br />
Oral Communication<br />
•Poor communication regarding feeding<br />
•Lack of communication with the child by a<br />
Consultant<br />
Written Communication<br />
•Conflicting information given about<br />
endoscopes<br />
An Example of how we<br />
classify Complaints<br />
A family’s concerns are<br />
summarised below*:<br />
•An HDU bed was only made<br />
available when the family<br />
raised concerns<br />
•Concerns were raised about<br />
the length of time alarms<br />
were continually sounding on<br />
the ward<br />
•Ratio of nursing staff during<br />
breaks<br />
•Overheard nursing staff<br />
complaining about working<br />
conditions<br />
•Concerns about the volume<br />
of feed being administered<br />
*Please note that this<br />
complaint has been<br />
investigated as a SIRI<br />
Waiting, delays,<br />
cancellations & access to<br />
services<br />
•Surgery cancelled on 2 occasions<br />
•Concerns that lack of qualified staff<br />
caused delays<br />
•Concerns about delays in listing a patient<br />
for cardiac surgery<br />
Nursing Attitude<br />
•Concerns raised about unhelpful<br />
comments made by nursing staff<br />
•Nursing staff felt to be dismissive<br />
Medical Attitude<br />
•Father felt that a doctor had been rude,<br />
did not listen and acted unprofessionally
Actions Arising from<br />
Complaints<br />
Key Facts:<br />
44 individual recommendations made resulting from complaints responded to in Quarter 1<br />
<strong>2012</strong>/13<br />
At the time of writing:<br />
32 actions have been closed<br />
12 actions remain open<br />
Action Type by<br />
Directorate<br />
All actions arising from<br />
complaints are followed up<br />
by the Governance Services<br />
Unit on a quarterly basis.<br />
The Investigating Manager<br />
is asked for confirmation<br />
that each action has been<br />
completed and, where it<br />
has not proven possible to<br />
do so, provide details of<br />
alternative actions taken.
Complaints Aligned to Trust Values<br />
0<br />
Breakdown by Complaint<br />
0<br />
5<br />
9<br />
5<br />
10<br />
16<br />
10<br />
15<br />
20<br />
1. Commitment/Trust<br />
2. Trust<br />
3. Trust/Commitment<br />
4. Trust/Respect/Compassion<br />
5. Trust/Respect/Commitment/Compassion<br />
6. Commitment/Trust<br />
7. Respect/Trust<br />
8. Commitment/Compassion/Respect/Trust<br />
9. Commitment/Compassion/Respect/Trust<br />
10. Respect/Trust<br />
11. Respect/Trust<br />
12. Respect/Trust/Commitment<br />
13. Respect/Trust<br />
14. Respect/Trust/Commitment<br />
15. Trust/Compassion<br />
16. Trust/Commitment
PALS Contacts<br />
70<br />
60<br />
50<br />
40<br />
30<br />
20<br />
10<br />
0<br />
Our PALS service was redesigned in 2011 to make it<br />
easier for families to raise issues. Our analysis does<br />
not reveal any systemic deterioration in clinical care<br />
Waiting, delays & cancellations<br />
4<br />
6<br />
6<br />
15<br />
Outpatient delays &<br />
cancellations<br />
Inpatient delays &<br />
cancellations<br />
Admission discharge<br />
and transfer<br />
Access to services<br />
Oct-10<br />
12<br />
Nov-10<br />
Dec-10<br />
Jan-11<br />
Feb-11<br />
Mar-11<br />
Apr-11<br />
May-11<br />
Jun-11<br />
Jul-11<br />
1 Quality of Nursing<br />
6<br />
Care<br />
Quality of Medical<br />
Care<br />
Aug-11<br />
Sep-11<br />
Oct-11<br />
Nov-11<br />
Quality of Treatment Staff Attitude Communication<br />
8<br />
5<br />
6<br />
Dec-11<br />
Jan-12<br />
Feb-12<br />
Mar-12<br />
Apr-12<br />
May-12<br />
Jun-12<br />
Attitude of Nursing<br />
Staff<br />
Attitude of Medical<br />
Staff<br />
Attitude of AHP<br />
14<br />
18<br />
Oral<br />
Written<br />
Other<br />
1<br />
Attitude of other<br />
Quality of Medical Care<br />
Oral Communication<br />
Outpatient/Inpatient delays and cancellations<br />
e.g. concerns about treatment received, including misdiagnosis<br />
e.g. lack of information about delays, treatment, procedure and<br />
conflicting information between medics<br />
e.g. delays and cancellations of appointments, cancellations of surgery<br />
and difficulties in obtaining surgery date
Net promoter question (NPQ)<br />
Or Friends and Family Test<br />
From 1 April <strong>2012</strong> until 31 March<br />
2013 we are required, as part of<br />
this year’s patient experience<br />
CQUIN, to ask 10% of all our inpatients,<br />
with a length of stay<br />
greater than 24 hours, on their<br />
day of discharge:<br />
How likely is it you would<br />
recommend this service to<br />
friends and family?<br />
The responses can be: ‘extremely<br />
likely’ ‘likely’, ‘unsure’, ‘unlikely’<br />
and ‘not at all’.<br />
‘Extremely likely’ is considered a<br />
promoter; ‘likely’ and ‘unsure’ are<br />
passive and ‘unlikely’ and ‘not at<br />
all’ are detractors. A score is<br />
determined by the number of<br />
detractors being subtracted from<br />
the number of promoters. As the<br />
guidance directs the question to<br />
be asked of over 18s this in reality<br />
is asked to parents and carers.<br />
The information is then reported to the Commissioners on a monthly basis, where a monthly net<br />
promoter score is calculated and compared against all acute trusts across the West Midlands and East<br />
Cluster. The CQUIN guidelines also direct that the result is reported to <strong>Board</strong> on a monthly basis along<br />
with other patient experience information, and the minutes of that meeting, demonstrating response<br />
and challenge are submitted on a monthly basis.<br />
The final target of the CQUIN will be aligned to a maintenance or an improvement on the net promoter<br />
score, dependent upon the first quartile score.<br />
74 75<br />
41<br />
9<br />
April <strong>2012</strong><br />
31<br />
5<br />
May <strong>2012</strong><br />
All responses received YTD by month<br />
118<br />
23<br />
2<br />
June <strong>2012</strong><br />
<strong>July</strong> <strong>2012</strong><br />
August <strong>2012</strong><br />
September<br />
<strong>2012</strong><br />
October<br />
<strong>2012</strong><br />
November<br />
<strong>2012</strong><br />
Promoters<br />
Passive<br />
Detractors<br />
December<br />
<strong>2012</strong><br />
January<br />
2013<br />
February<br />
2013<br />
March 2013<br />
In addition to asking the<br />
parents/carers a question has<br />
been developed with young<br />
people to ask of children and<br />
young people: I would tell my<br />
friends and family this is a good<br />
hospital.<br />
With the responses being: I agree<br />
a lot, I agree a bit, I’m in the<br />
middle, I disagree a bit, I disagree<br />
a lot.<br />
To date a smaller number of<br />
children and young people have<br />
been asked but of this number<br />
90% have said they would agree a<br />
lot and 10% agree a bit.
In order to provide our children and young<br />
people with a means of communicating that<br />
is familiar to them and which appeals to<br />
them, we have developed the BCH ‘Feedback<br />
App’.<br />
This contemporary approach to collecting<br />
patient feedback will be trialled in August on<br />
Wards 8 and 5. Users will also be given the<br />
option to answer the Friends and Family Test<br />
via this method.<br />
This approach will be a ‘live’ way of gaining<br />
patient experience feedback with comments<br />
appearing on the BCH Internet site.<br />
The App is available from the ‘App Store’ or<br />
from ‘Google Play’ now.<br />
We are publicising the App through poster<br />
displays, leaflets and life size cut outs in the<br />
clinical areas.
Patient Experience Database (PED)<br />
Feedback is entered on to the PED from a variety of<br />
sources including: feedback cards (both paper and<br />
electronic), text, email, ward manager walkabouts,<br />
verbal comments, thank you cards and letters, and<br />
websites such as NHS Choices and Patient Opinion.<br />
Social network sites, facebook and twitter are also<br />
being monitored and responded to.<br />
A feedback App is to be piloted this month as an<br />
additional tool for children, young people and<br />
families to give feedback and rate the hospital as<br />
part of the ‘friends and family test’<br />
The data in the graphs is from the development<br />
from Informatics who are further developing the<br />
PED reports to create clear, concise reports of<br />
activity; these will be introduced into formal reports<br />
as they become available.<br />
Parents consistently offer the highest number of<br />
comments using the methods that are recorded on<br />
the PED. Interestingly when numbers fall there<br />
appears to be a correlation between parent and<br />
young people’s feedback. A young person has been<br />
recruited to help support the Young person’s<br />
‘friends and family test’ and also increase feedback<br />
from both children up to 10 years and young<br />
people 11 years and over.
PED Results<br />
87% of the positive comments relate to either quality of care or attitude of staff, with a further 5% relating to communication and information<br />
- a hugely positive picture. It is encouraging to see 5% (n 77.25) of the positive comments relate to toys and entertainment, a slight increase to<br />
the last report.<br />
The highest need to improve comments related to facilities and accommodation. A combination of parent and patient remain very similar at<br />
37%. The comments regarding parent facilities are predominantly about eating, drinking and sleeping ,and issues impacting on being able to<br />
do these in the clinical areas.<br />
The need to improve comments on toys has a higher percentage than the positive comments but to balance this the actual number of<br />
comments is higher, 39 positive versus 32 need to improve.<br />
The number of need to improve comments relating to food and drink remains relatively high at 14%; the majority of comments were about<br />
choice for patients but with a few comments about vending machines being made available out of hours for parents. It is anticipated that the<br />
introduction of MAPLE (Menu Acquisition Portal Live Entry) for ordering food, which is currently being rolled out across the organisation, will<br />
help to address the issue of choice. YPAG undertook a quality walkabout relating to MAPLE in <strong>July</strong>, the outcome of which will be included in<br />
the next report. Additionally two YPAG members are working with the Head of Facilities to support the development of MAPLE.
<strong>Board</strong> of Directors<br />
Public <strong>Meeting</strong><br />
Tuesday 31 <strong>July</strong> <strong>2012</strong><br />
Item 12.134 Enc 04<br />
Strategic Objective/ Enabler<br />
A local Operating Framework & Financial Plan to<br />
ensure we move from strategy to action<br />
Report Title Resources report period 1 st April <strong>2012</strong> – 30 th June <strong>2012</strong><br />
Sponsoring Director<br />
Chief Finance Officer<br />
Author(s)<br />
Chief Officer for Workforce, Director of Performance &<br />
ICT, Deputy Chief Finance Officer<br />
Previously considered by<br />
Discussed with Chair of Finance and Resource<br />
Committee<br />
Executive Management Team<br />
Situation<br />
This report is to communicate the various aspects of Trust performance in the financial<br />
year to date, period ending 30 June <strong>2012</strong>, and to identify any key risks that are evident<br />
within the organisation.<br />
The contents of this report will form the basis of the Trust’s Quarter 1 (Q1) Return to Monitor.<br />
The Trust is also required to report its predicted status for Governance and Mandatory<br />
Services.<br />
Background<br />
The Trust is required to comply with the finance related legal issues contained within our<br />
Terms of Authorisation as well as other key financial targets. This includes:<br />
• Not breaching the Private Patient Cap (a legal requirement);<br />
• Not breaching the Prudential Borrowing Limit (a legal requirement);<br />
• Not utilising the Working Capital Facility;<br />
• Performing at or above plan for Monitor’s financial metrics leading to an overall<br />
Financial Risk Rating of 4 or 5; and<br />
• Minimising triggering the additional financial indicators introduced as part of the<br />
<strong>2012</strong>/13<br />
• Compliance Framework, which may result in formal discussions with Monitor.<br />
The Trust is also required to report its predicted status for Governance and Mandatory Service
Delivery against these targets is driven by:<br />
• The volume and mix of demand experienced by the Trust.<br />
• How the Trust uses its most valuable resource, its staff, in responding to that<br />
demand.<br />
The report explores each of these areas in turn and the impact on the financial position<br />
and performance.<br />
Assessment<br />
The Trust has seen demand for its services increase in the first three months of the<br />
financial year, whether that is compared to plans agreed with commissioners or with<br />
levels last year. However, activity in June was lower for most areas, with average income<br />
per spell also reduced. This cumulative increase is being experienced in most areas,<br />
from outpatients and the emergency department to planned care, with only emergency<br />
admissions lower than last year. Unlike last year, a significant increase in demand is also<br />
being experienced from the <strong>Birmingham</strong> area.<br />
This increase in demand has brought into sharp focus the short to medium term capacity<br />
issues faced by the Trust. <strong>Meeting</strong> this demand will increase pressures felt by staff.<br />
Sickness rates are at 3.1%, above the 3% which indicates that the impact may be a<br />
contributory factor in increased absence levels. Engaging with staff, especially during<br />
periods of pressure, is important and appraisals are one indication of how well this is<br />
working in the Trust. Whilst the reported appraisal rate has increased to 67% from 55% in<br />
the last month it is still short of the 90% target. There is a continued focus through the<br />
performance management system to improve this.<br />
Due to the reductions in activity, income was lower in June and that has had an impact<br />
on the financial performance, which was just below the budget but ahead of our Monitor<br />
target at £2.3 million. Notwithstanding this, there are some significant pressures in<br />
Specialised Services, Medicine and Estates, all of which require addressing in order to<br />
avoid further financial difficulties later in the year. In these areas support is being<br />
provided to develop recovery plans, and all areas of the Trust have been asked to refresh<br />
year-end financial forecasts.<br />
Recommendations<br />
The <strong>Board</strong> note the emerging risks associated with increased demand and the knock on<br />
effect on the capacity of the Trust and consequent impact on resources.<br />
The <strong>Board</strong> of Directors is asked to approve Governance (Green), Mandatory Services<br />
(Green), Safety Assurance Systems in place (Green) and Financial Risk rating (“4”) for<br />
inclusion in the Monitor Q1 Return, which must be submitted by <strong>July</strong> 31.
Key Impacts<br />
Strategic Objectives<br />
Staff and finance are key enablers to meeting the Trust’s strategic<br />
objectives.<br />
CQC Registration (state<br />
outcome)<br />
N/A<br />
NHS Constitution<br />
NHS Constitution has a pledge regarding 18-week waits.<br />
Other Compliance (e.g.<br />
NHSLA, Information<br />
Governance, Monitor)<br />
Monitor metrics are considered in the report.<br />
Equality, diversity & human<br />
rights<br />
N/A<br />
Trust contracts<br />
N/A<br />
Other<br />
N/A
Resources Report<br />
<strong>July</strong> <strong>2012</strong><br />
David Melbourne<br />
Theresa Nelson<br />
Tim Atack<br />
Chief Financial Officer<br />
Chief Officer for Workforce<br />
Director of Performance & ICT<br />
1
Reporting on resources use<br />
1. Summary of Monitor Declarations<br />
2. Volume and mix of activity<br />
3. Our performance dashboard<br />
4. Access<br />
5. Flow<br />
6. The impact on our workforce<br />
7. The financial consequences<br />
2
Summary for the month.<br />
June <strong>2012</strong><br />
Activity was lower in June in most areas compared with the same time last year and this has generally<br />
translated into a reduced financial performance. PIC remained extremely busy and highlights the<br />
impact of changes in the case-mix of patients on the flows in some patient pathways through the<br />
hospital. For the year to date the Trust is still above last years out-turn level of activity and plans agreed<br />
with commissioners with only emergency admissions falling below target.<br />
Staff numbers increased as a result of a combination of delivering the increased activity and some early<br />
recruitment of staff in Specialised Services in anticipation of service expansion later in the year.<br />
Appraisal rates continue to improve and the sickness rate has slightly increased compared to month<br />
two it is now above three percent. This will continue to be monitored closely to assess whether there is<br />
a trend.<br />
Due to the reductions in activity income was lower in June that has had an impact on the financial<br />
performance which was just below the budget but ahead of our Monitor target at £2.3million.<br />
Notwithstanding this, there are some significant pressures in specialised services, medicine and estates<br />
all of which require addressing in order to avoid further financial difficulties later in the year. In these<br />
areas support is being provided to develop recovery plans and all areas of the Trust have been asked to<br />
refresh year end financial forecasts.<br />
For our Q1 Monitor declaration we are reporting a Green rating against all the latest Monitor Finance<br />
and Governance risk ratings<br />
3
Monitor assessment and declarations.<br />
Our overall performance position remains broadly<br />
positive.<br />
Our key concern remains cancelled operations which is<br />
also being monitored by commissioners.<br />
For our Q1 Monitor declaration we are reporting a<br />
Green rating against the latest Monitor risk ratings.<br />
Monitor Quarter 1 <strong>2012</strong>/13 (predicted)<br />
Finance risk rating<br />
Governance risk rating<br />
Mandatory Services risk rating<br />
Safety Assurance System in place risk rating<br />
G(4)<br />
G<br />
G<br />
G<br />
Monitor Quarter 4 2011/12 (confirmed)<br />
Finance risk rating<br />
Governance risk rating<br />
Mandatory Services risk rating<br />
Safety Assurance System in place risk rating<br />
G(4)<br />
G<br />
G<br />
G<br />
4
Emergency activity profile.<br />
June <strong>2012</strong> saw a 5.2% increase in Emergency Department (ED) activity compared to June last year<br />
however there was a 6.0% decrease in emergency admissions. The <strong>2012</strong>/13 contract plan is based on<br />
the 11/12 outturn and YTD ED is 4.7% higher and emergency admissions 0.3% lower than last year.<br />
However the mix of emergency admissions has shifted between specialist commissioning to PCT cluster<br />
commissioning that has a consequent financial impact<br />
Whilst June performance improved, the Trust continues to not meet its local standard of all patients<br />
triaged within 15 minutes (the 95 percentile performance was 30 minutes) and the national standard<br />
of average treatment start times within 60 minutes of arrival (actual was 69 minutes). Plans are in place<br />
to further reduce waits in ED.<br />
5
Planned activity profile.<br />
June <strong>2012</strong> has seen a 8.9% decrease in planned<br />
activity compared to last year. This is due to the<br />
Whitsun break (with an additional bank<br />
holiday) moving from May to June and the<br />
additional Diamond Jubilee celebrations. In<br />
addition five lists were lost as a result of the<br />
BMA day of action.<br />
The 12/13 contract plan was based on 11/12<br />
outturn plus a ~3.5% non recurrent increase in<br />
activity to reduce waiting times. YTD activity is<br />
6.9% higher.<br />
As a result of higher than expected demand<br />
total waiting list numbers have increased by<br />
10% and there continues to be pressure on<br />
meeting the 18-week admitted standard.<br />
Options to reduce the size of the waiting list<br />
and waiting times are being explored.<br />
6
Outpatients (OP).<br />
June <strong>2012</strong> saw a 11.6% decrease of new OP activity and a decrease in follow-up OP activity 11.4%<br />
compared to last year, due to the Whitsun break. The 12/13 plan is based on 11/12 outturn. YTD<br />
activity is 7.9% higher for new OP and 0.2% higher for follow-ups.<br />
7
Our Performance Dashboard – June <strong>2012</strong><br />
8
ACCESS<br />
Emergency Department – Transfers Out<br />
No patients were transferred out during June.<br />
9
Emergency Department<br />
10
Tertiary Referrals<br />
IP Tertiary<br />
•There were 161 referrals for specialist beds at<br />
BCH.<br />
• 3 patients were unable to get a bed at BCH<br />
• 6 patients had to wait over 24 hours to be<br />
offered a bed at BCH.<br />
• 18 patients were deemed to no longer require<br />
a bed at BCH<br />
11
Tertiary Referrals<br />
( ) = not hospital delays/out of region patients/referred from home patients<br />
12
CAMHS Referrals<br />
Delayed Discharges<br />
7 patients could not be supported by<br />
BCH CAMHS<br />
3 patients discharge is delayed due to<br />
non-medical reasons. All patients are<br />
due to be discharged in <strong>July</strong> or August<br />
13
FLOW<br />
Cancelled Operations<br />
Cancelled Operations<br />
23 for June (1.22%) above the national 0.8% target.<br />
The ethnic breakdown of the patients is:<br />
15 - white/British, 1– asian/asian British Indian, 3- asian/asian<br />
British Pakistani, 1 –– mixed white/Caribbean, 1 – not stated,<br />
2 –white/any other white.<br />
No patients with Learning Disabilities were cancelled.<br />
A further 4 patients had their operation cancelled by the hospital<br />
before the day of the operation.<br />
14
Cancelled Operations<br />
15
18-weeks<br />
The standards were met for June 90.2% admitted, 98.6 % non-admitted and 98.4%<br />
incomplete patients, however a total of 46 patients were not treated within 18-weeks due<br />
to a lack of hospital capacity.<br />
Patients waiting over 30 weeks<br />
1 urology patient was treated at their<br />
34 th week, the delay in part due to<br />
not being fit for previous operation<br />
dates.<br />
1 ENT patient (33 rd week) and 1<br />
cardiology patient (35 th week) have<br />
requested to wait longer.<br />
1 urology patient (34 th week) waiting<br />
for treatment, in part due to not<br />
being fit for treatment<br />
16
18-weeks - CAMHS<br />
The local 90% standard was not met in June, actual performance was 88.8%. Additional<br />
staffing (funded by commissioners) is being recruited to address waiting time concerns.<br />
17
PICU Demand<br />
PICU has remained under significant demand<br />
which has impacted on both the ability to<br />
admit emergency patients and support complex<br />
elective surgery. The financial implications of<br />
this are explored in more detail later.<br />
A total of 2 West midlands (WM) patients could<br />
not be supported with 1 patient going to<br />
Leicester and 1 out of region.<br />
A further 1 non-WM requests could not be<br />
supported, however a total of non-WM<br />
requests were supported (1 BCH PICU, 3 BCH<br />
non-PICU beds and 1 other WM PICU).<br />
18
Workforce Dashboard<br />
BCH NHS Foundation Trust - HR Workforce Key Performance Indicators<br />
Retention & Turnover<br />
Sickness Absence<br />
Other Workforce KPI's<br />
Whole Time Equivalent (WTE) Monthly Sickness Absence %<br />
Medical Appraisals Completed<br />
Previous<br />
Month<br />
Latest<br />
Months<br />
Difference<br />
Trend<br />
Previous<br />
Month<br />
Latest<br />
Months<br />
Implications on our workforce.<br />
Total staffing increased by 47.48 wte compared<br />
to May <strong>2012</strong>.<br />
Overall staffing increased in the past year due to<br />
planned increases in PICU and Theatre capacity.<br />
The largest increase in numbers is within<br />
specialised services as a result of these service<br />
expansions.<br />
The patient access team has moved from<br />
Corporate to Clinical Support in June which<br />
explains this change in staff numbers<br />
3050.00<br />
3000.00<br />
2950.00<br />
wte<br />
2900.00<br />
2850.00<br />
2800.00<br />
Workforce WTE (including Bank)<br />
Apr May Jun Jul Aug Sep Oct Nov Dec Jan Feb Mar<br />
2011/12 <strong>2012</strong>/13<br />
Directorate May-11 Jun-11 Jul-11 Aug-11 Sep-11 Oct-11 Nov-11 Dec-11 Jan-12 Feb-12 Mar-12 Apr-12 May-12 Jun-12<br />
D1 Clinical Support Services 389.44 393.03 390.56 390.92 390.76 388.64 390.51 388.61 390.81 384.90 389.69 389.89 390.42 410.04<br />
D2 Medical Directorate 627.33 636.01 640.22 645.74 650.38 639.21 643.52 644.11 648.57 646.55 638.88 640.80 639.33 653.69<br />
D3 Specialised Services 687.51 692.17 697.24 702.15 705.68 715.94 728.02 717.60 730.12 730.31 725.83 729.86 744.50 762.30<br />
D4 Surgical Directorate 399.38 400.00 399.99 392.51 399.91 400.87 409.56 397.29 402.11 405.85 403.35 391.46 393.21 403.55<br />
D5 CAMHS Services 323.27 325.37 324.07 321.93 316.81 308.92 310.59 310.79 313.91 314.45 318.20 318.26 312.76 311.59<br />
D6 Corporate 460.09 463.10 466.17 467.77 453.79 454.19 450.94 451.03 472.33 474.77 468.71 471.48 468.07 454.61<br />
Total 2887.01 2909.69 2918.25 2921.02 2917.33 2907.78 2933.15 2909.44 2957.85 2956.83 2944.66 2941.75 2948.29 2995.77<br />
In-Month Movement 22.67 8.56 2.77 -3.69 -9.55 25.38 -23.72 48.41 -1.02 -12.17 -2.91 6.54 47.48<br />
20
Implications on our workforce.<br />
May sickness has increased to 3.1% which is above<br />
the Trust 3% target however the annual cumulative<br />
rate is continuing to drop. (Data is reported one<br />
month in arrears). The top four reasons recorded<br />
for sickness absence are:<br />
• Anxiety.<br />
• Gastrointestinal reasons.<br />
• Muscular related.<br />
• Cancer related.<br />
Appraisal performance continues to rise, 66.8% for<br />
June and on track to exceed our 90% standard by<br />
the end of September<br />
Sickness data is reported one month in arrears<br />
21
Workforce summary.<br />
April – June <strong>2012</strong><br />
Staff numbers have increased by 1.2 per cent year on year yet as indicated in the previous analysis<br />
increases in demand has fed into the Trust treating significantly more patients over the same period.<br />
However, the pay rather than staff numbers is the key determinant of the measure of workforce<br />
productivity and this has remained at the the level required for the delivery of Trust plans. (see analysis<br />
below).<br />
During a period of increased demands on staff sickness levels have not deteriorated and are slightly<br />
above our 3% standard. The major theme recorded for sickness absence is anxiety and stress albeit case<br />
review indicates that this can often relate to personal domestic circumstances.<br />
Effectively managing the workforce during these difficult periods requires regular good quality<br />
engagement and conversations with staff. One measure of this is the regularity of annual appraisals;<br />
these levels have improved to 67% and further improvement is expected over the coming months. This<br />
is an area of focus both within the Trust and by the Cluster and SHA.<br />
Updated workforce plans have been produced, raising a number of long terms challenges (i.e.<br />
reductions in trainees and junior doctors, potential retirements) that are also opportunities for new<br />
work force solutions. The workforce plans are being actively worked through within each Directorate<br />
and plans are in place to monitor these through a number of workforce forums.<br />
22
Financial Performance Summary<br />
Monitor Financial Performance Framework<br />
Criteria Metric Plan Actual Status Direction<br />
of Travel<br />
Financial Performance<br />
Underlying Performance EBITDA margin 3 3 Income and Expenditure 2,304 2,347 43 <br />
Achievment of Plan EBITDA, % achieved 5 5 Cash Balance 34,464 32,179 -2,285 <br />
Financial Efficiency Return on Assets 5 5 Capital Programme 2,598 2,138 -460 <br />
Financial Efficiency I&E surplus margin 5 5 CIP 2,254 1,914 -340 <br />
Liquidity Liquidity ratio 4 4 <br />
Issue<br />
Plan<br />
£'000<br />
Actual<br />
£'000<br />
Variance<br />
£'000<br />
Status<br />
Direction of<br />
Travel<br />
Overall 4 4 Year to date surplus is performing slightly ahead ahead of the Monitor Plan but is now below the<br />
The Monitor Risk Rating is per the Plan of 4. This is forecast to continue through to year-end<br />
Foundation Trust Requirements<br />
(Monitor assesses financial risk on a scale from 1 (high risk) to 5 (low risk)<br />
FINANCIAL PERFORMANCE REPORT<br />
Month 03 - Period Ending 30 June <strong>2012</strong><br />
Issue Measure Plan Actual Status Direction<br />
of Travel<br />
Income and Expenditure<br />
Revised Plan (£26k).<br />
Cash Balance<br />
At the end of June w as behind plan due to low er creditors, higher debtors, delays in raising some S<br />
and the nature of the Trust's contracting portfolio.<br />
Capital Programme<br />
Prudential Borrow ing Limit Not to exceed £38.3m £2m £2m The Trust is performing below its original plan to Monitor w ith the strategic investment schemes<br />
Private Patient Cap Not to exceed 1% 0.4% 0.2% <br />
progressing w ell. This remains w ell w ithin the 75-125% parameters set by Monitor.<br />
Working Capital Facility Not to use Not Used Not Used CIP<br />
All categories are performing to or w ithin plan although from an I&E perspective a close w atch needs to The year to date performance is ashortfall of 15% or £340k.<br />
be maintained on Private Patient income<br />
The concern w ith the CIP delivery is that this w as a shortfall against a low plan w ith actual delivery<br />
being underpinned by performance monies and slippage from 11/12 schemes.<br />
23
Income and Expenditure against Plan<br />
The Trust is performing slightly above the plan<br />
submitted to Monitor but below the revised plan.<br />
June has been a difficult month financially with<br />
pressures exerted on both income and expenditure.<br />
Capacity pressures are being reflected in the activity<br />
being undertaken. The average income per spell has<br />
reduced in June whilst the Trust has already “lost”<br />
£0.4m in the Marginal Reduction in Emergency Tariff<br />
(MRET) due being paid at 30% for overperformance.<br />
There are real financial pressures in both Medicine and<br />
Specialised Services. With the Marginal Performance<br />
Adjustment being in place for the first time this year,<br />
SSD has felt the full weight of the Cardiac<br />
underperformance. However, with waiting list costs<br />
(circa £0.12m despite surgical underperformances),<br />
medical staff, CIP, PICU and junior doctor pressures<br />
being exerted the deficit has risen to £1.3m, a rise of<br />
£0.7m. A fuller briefing has been prepared on this.<br />
The EBITDA position is marginally above the Monitor<br />
Plan but below the revised plan. As a % against plan,<br />
this is the lowest EBITDA performance since 2008/09.<br />
<strong>2012</strong>/13 I&E to June <strong>2012</strong> Annual<br />
Plan per<br />
LTFM<br />
Revised<br />
Annual<br />
Plan<br />
YTD Plan<br />
per LTFM<br />
Revised<br />
YTD Plan<br />
YTD<br />
Actual<br />
Variance<br />
£'000 £'000 £'000 £'000 £'000 £'000<br />
Income from activities 193,902 194,107 49,233 48,108 48,526 419<br />
Other Income 24,268 25,356 6,067 7,104 7,048 -56<br />
Operating Expenses -204,006 -204,307 -51,001 -50,843 -51,269 -425<br />
EBITDA 14,165 15,155 4,299 4,369 4,306 -63<br />
Interest Receivable 265 265 67 66 147 81<br />
Depreciation -5,400 -5,400 -1,350 -1,350 -1,356 -6<br />
Profit/(Loss) on Asset Disposal 0 0 0 0 0<br />
Impairment 0<br />
PDC Dividend -2,520 -2,520 -630 -630 -670 -40<br />
Interest Paid -326 -326 -82 -82 -79 2<br />
Net Surplus/(Deficit) 6,183 7,173 2,304 2,373 2,347 -26<br />
Brackets indicate adverse<br />
Apr - June<br />
May In-month<br />
variance<br />
Income<br />
Variance<br />
Pay<br />
Variance<br />
Non-Pay<br />
Variance<br />
Total<br />
Variance<br />
Variance<br />
£000<br />
Moveme<br />
nt £000<br />
Clinical Support Services -9 -82 27 -64 -23 -42<br />
Medical Directorate -107 -160 -66 -333 -260 -73<br />
Specialised Services -103 -438 -748 -1,288 -570 -718<br />
Surgical Directorate -42 -10 23 -29 7 -36<br />
CAMHs -20 64 -27 17 9 8<br />
Corporate 224 -139 -180 -95 -21 -74<br />
Total Operational Budgets -56 -765 -971 -1,793 -858 -935<br />
Bad Debts 0 0 0 0<br />
Operating Leases 61 61 41 20<br />
Teaching & Research 0 0 0 0<br />
Reserves and Provisions 500 750 1,250 250 1,000<br />
Total Other Budgets 0 500 811 1,311 291 1,020<br />
Total Budgets -56 -265 -160 -482 -567 86<br />
24
Specialised Services<br />
The table opposite outlines the position against budget of the<br />
services within the Directorate.<br />
The key points to note are:<br />
Cardiac<br />
• activity underperformance has led to a £0.24m funding reduction;<br />
• £0.05m CIP shortfall;<br />
Theatres<br />
•activity underperformance has led to a £0.16m funding reduction;<br />
• £0.12m of WL costs have been incurred without generating surgical<br />
overperformance;<br />
•£0.10 CIP shortfall;<br />
Livers<br />
• £0.10m loss due to no small bowel transplants being undertaken;<br />
• £0.07m junior doctors pressures;<br />
PICU<br />
• Nursing variance of £0.10m due to maternity leave and<br />
supernumerary trainees in advance of bed openings.<br />
• Junior Medic pressures £0.07m<br />
Service<br />
YTD Budget<br />
£k<br />
YTD Actual<br />
£k<br />
YTD Variance<br />
£k<br />
YTD %<br />
Variance<br />
Cardiac Services 1,995 2,422 -427 -22%<br />
Theatres & Anaesthetics 3,465 3,901 -436 -13%<br />
Liver Services 1,892 2,110 -218 -12%<br />
PICU 3,394 3,596 -202 -6%<br />
SSD Management 74 78 -4 -5%<br />
KIDS 553 554 -1 0%<br />
Total 11,373 12,661 -1,288 -11%<br />
YTD Budget<br />
£k<br />
YTD Actual<br />
£k<br />
YTD Variance<br />
£k<br />
YTD %<br />
Variance<br />
Income -530 -428 -103 -19%<br />
Pay 8,865 9,302 -438 -5%<br />
Non-Pay 3,038 3,786 -748 -25%<br />
Total 11,373 12,661 -1,288 -11%<br />
780<br />
Workforce WTE (including Bank)<br />
Adjustments for underperformance have been predominantly been<br />
charged against non-pay, which gives a disproportionate position<br />
against the £3.0m budget.<br />
wte<br />
760<br />
740<br />
720<br />
700<br />
Staffing levels have increased in each of the last 3 months. This is<br />
expected as any PICU expansion would exceed any CIP workforce<br />
reductions. However, mean salaries have also risen over the same<br />
period, which, when combined with CIP delivery shortfalls and<br />
income pressures, generates a significant cost pressure.<br />
680<br />
660<br />
640<br />
Apr May Jun Jul Aug Sep Oct Nov Dec Jan Feb Mar<br />
2011/12 <strong>2012</strong>/13<br />
25
Medicine<br />
The table opposite outlines the position against budget of the cost<br />
categories within the Directorate.<br />
The key points to note are:<br />
• CIP £0.10m shortfall – relates to sickness absence reductions, nonpay<br />
consumables and R&D contribution.<br />
• £0.09mMedical staff coverage of maternity leave and rota<br />
shortfalls;<br />
• £0.06m BMT and Anthony Nolan storage.<br />
Other issues to note are:<br />
• Costs incurred in deliver emergency activity not covered by income<br />
due to the Emergency Care Threshold 30% adjustment;<br />
• Minor shortfalls on coding CIPs.<br />
Estates<br />
The table opposite outlines the position against budget of the<br />
services within the Estates Department.<br />
The key points to note are:<br />
• Unmet CIP £0.05m;<br />
• Agency costs covering Senior Managers and Tradesmen £0.13m;<br />
• Contracts and Consultancy £0.05m.<br />
Medicine<br />
YTD Budget YTD Actual YTD Variance YTD %<br />
£k £k<br />
£k Variance<br />
Income -519 -413 -107 -21%<br />
Pay 7,575 7,735 -160 -2%<br />
Non-Pay 4,336 4,402 -66 -2%<br />
Total 11,391 11,724 -333 -3%<br />
3050.00<br />
3000.00<br />
2950.00<br />
wte<br />
2900.00<br />
2850.00<br />
2800.00<br />
Medicine Workforce WTE (including Bank)<br />
Apr May Jun Jul Aug Sep Oct Nov Dec Jan Feb Mar<br />
2011/12 <strong>2012</strong>/13<br />
Estates<br />
YTD Budget YTD Actual YTD Variance YTD %<br />
£k £k<br />
£k Variance<br />
Income -31 -43 12 39%<br />
Pay 309 436 -127 -41%<br />
Non-Pay 707 851 -144 -20%<br />
Total 985 1,244 -259 -26%<br />
26
Profitability against Target<br />
The EBITDA (Earnings Before Interest, Taxation, Depreciation and<br />
Amortisation) Margin is 1.4% below target due to the<br />
tight financial position at Month 3 but remains<br />
fractionally above (0.16%) the Monitor Plan level.<br />
Both positions have worsened since Month 2.<br />
In Month 2 gains on income offset expenditure<br />
pressures. In Month 3, it is income where the<br />
pressures have been exerted. The mix of activity<br />
including low cardiac workload due to PICU<br />
pressures, a lower income per spell and the<br />
reduced income recovery through the Emergency<br />
Care Threshold have impacted upon the Trust.<br />
Of concern is the relatively light CIP performance<br />
against a low target. A failure to improve this<br />
position will result in further deteriorations in<br />
financial performance.<br />
The I&E Surplus Margin shows a slight<br />
improvement on the Monitor Plan, but like the<br />
EBITDA performance, this is marginal.<br />
9.0%<br />
8.0%<br />
7.0%<br />
6.0%<br />
5.0%<br />
4.0%<br />
3.0%<br />
2.0%<br />
1.0%<br />
0.0%<br />
5.0%<br />
4.5%<br />
4.0%<br />
3.5%<br />
3.0%<br />
2.5%<br />
2.0%<br />
1.5%<br />
1.0%<br />
0.5%<br />
0.0%<br />
EBITDA Margin<br />
7.7% 7.7%<br />
May Jun Jul Aug Sep Oct Nov Dec Jan Feb Mar<br />
4.3% 4.2%<br />
I&E Surplus Margin<br />
Actual<br />
Plan for<br />
Year<br />
Actual<br />
Plan<br />
for<br />
Year<br />
May Jun Jul Aug Sep Oct Nov Dec Jan Feb Mar<br />
27
Financial Workforce metrics<br />
Given the financial positions previously reported it is expected that<br />
workforce metrics will be close to the plan for the year. Both elements of<br />
the Clinical Income:Pay ratio are performing below plan. At this early stage<br />
of the year figures pro-rata’d to year-end can give exaggerated results but<br />
the June position does highlight the tightness of the Trust’s margins,<br />
especially if CIP schemes are not delivered. This is particularly the case for<br />
Clinical Income.<br />
The Trust however is also experiencing an increase in both the median<br />
salary (a mandatory Annual Report requirement) and the mean salary<br />
(although June’s position was slightly down on May’s). These are<br />
measures that will need to be contained given that workforce CIPs are a<br />
mix of reducing posts and reducing average costs, and discussions with<br />
Clinical Directorates point to workforce reduction schemes being put on<br />
hold in light of capacity issues.<br />
33.0<br />
32.0<br />
31.0<br />
30.0<br />
£k<br />
29.0<br />
28.0<br />
27.0<br />
26.0<br />
<strong>2012</strong>/13 Average Salaries<br />
Period<br />
Median Mean<br />
£m<br />
250<br />
200<br />
150<br />
100<br />
50<br />
0<br />
Clinical Income:Pay Ratio<br />
£194 £195 £189 £194 £198 £198<br />
£180<br />
£171<br />
£136 £139 £141 £141 £141 £143 £143<br />
£128<br />
0910 Plan 1011 Plan 1112 Plan 1213 Plan 1213 M3 1213 YTD 1314 Plan 1415 Plan<br />
Year<br />
Clinical Income £m Pay £m<br />
£m<br />
200<br />
199<br />
198<br />
197<br />
196<br />
195<br />
194<br />
193<br />
192<br />
191<br />
190<br />
Clinical Income per wte YTD<br />
2,996<br />
2,942 2,948<br />
£194 £197 £194<br />
Plan May Jun Jul Aug Sep Oct Nov Dec Jan Feb Mar<br />
Year<br />
Clinical Income £m wte<br />
3040<br />
3020<br />
3000<br />
2980<br />
2960<br />
2940<br />
2920<br />
2900<br />
wte<br />
28
CIP<br />
CIP delivery is 15% below target at Month 2. This equates to £340k. The equivalent underperformance for the<br />
full year target of £10.8m would be circa £1.6m (a rise of £0.1m on Month 2).<br />
However, a straight line plan at Month 3 would require planned savings of £2.7m. The phased target is £2.3m.<br />
The underperformance is therefore against a back-ended programme, which amplifies the financial risk.<br />
Of the Directorates only Surgery is achieving its target although this is against a low target at Month 3. All<br />
Directorates, with the exception of Specialised Services have plans for their full CIP target.<br />
The concern is that in some areas the bulk of savings relate to performance monies or slippage relating to<br />
2011/12. This is the case in Medicine where £0.24m of the £0.29m achieved relates to Performance adjustment<br />
monies. Overall 30% of the savings identified to date are related to performance monies or slippage from<br />
2011/12. this means that there is a 20% shortfall against the <strong>2012</strong>/13 specific schemes.<br />
Specialised Services’ shortfall is predominantly within non-pay, UHB SLA and Private Patient income. Corporate’s<br />
shortfall is driven by Estates.<br />
Directorate<br />
Clinical Support Services<br />
Medical Directorate<br />
Specialised Services<br />
Surgical Directorate<br />
CAMHs<br />
Corporate<br />
Total<br />
all figures £k<br />
Plan Actual Variance % Achieved % Plan M1-3<br />
302 301 -1 99.7% 19.4%<br />
427 290 -137 68.0% 17.4%<br />
646 524 -122 81.1% 23.3%<br />
331 340 9 102.6% 18.7%<br />
164 148 -16 90.1% 32.8%<br />
384 312 -72 81.1% 22.5%<br />
2,254 1,914 -340 84.9% 20.9%<br />
29
Cash and Capital<br />
Cash is 7% below plan at £32.2m. This is due to:<br />
• higher than planned payment of creditors in<br />
Quarter One (capital creditors reduced by £1m)<br />
combined with an increasing level of aged debt;<br />
• delays in recovering income due to the nature of<br />
our contracting portfolio (a higher level of cost per<br />
case activity);<br />
• delays in invoicing for some SLA work; and<br />
• the capital performance below.<br />
£k<br />
38,000<br />
37,000<br />
36,000<br />
35,000<br />
34,000<br />
33,000<br />
32,000<br />
31,000<br />
30,000<br />
29,000<br />
<strong>2012</strong>/13 Cash Position and Rolling Forecast<br />
The Capital plan was only agreed at the end of May<br />
so expenditure in Q1 will be lower than in previous<br />
years. Of the £10.5m programme £2.1m has been<br />
incurred in the year to date, which is slightly behind<br />
the target – although this is partly down to VAT<br />
reclaims of 2011/12 expenditure.<br />
The Trust remains within the Monitor 75-125%<br />
margins.<br />
£k<br />
14,000<br />
12,000<br />
10,000<br />
8,000<br />
6,000<br />
4,000<br />
2,000<br />
Actual <strong>2012</strong>/13 Plan Rolling Forecast<br />
<strong>2012</strong>/13 Cumulative Capital Expenditure against Plan and Monitor<br />
Margins<br />
-<br />
Apr May Jun Jul Aug Sep Oct Nov Dec Jan Feb Mar<br />
12/13 Actual 12/13 75% 12/13 125% 12/13 Plan - Original<br />
30
Debtors and Creditors<br />
Debtors over 90 days have increased in June<br />
due to increased aged debts combined with a<br />
lower level of debt on the sales ledger. An<br />
action plan for recovering debts is being<br />
agreed with the Financial Controller. The<br />
Creditors position has improved in June as<br />
post annual accounts catch-up has taken<br />
place. The combination of these two<br />
measures obviously have an impact on the<br />
Trust’s cash position. the overall level of<br />
creditors reducing by 25% in May. The<br />
creditor position has improved following the<br />
clearance of significant debts with UHB.<br />
The Top 5 debts are a combination of R&D<br />
(Shire), Private Patient and NHS. The largest<br />
single debt, with Shire HGT, was paid in early<br />
<strong>July</strong>, so an improved position is expected in<br />
Month 4.<br />
30%<br />
25%<br />
20%<br />
15%<br />
10%<br />
5%<br />
0%<br />
% Debtors and Creditors over 90 days<br />
Apr May Jun Jul Aug Sep Oct Nov Dec Jan Feb Mar<br />
Debtors>90 days % Creditors>90 days % Target<br />
Top 5 Debts Over 90 Days Old<br />
Customer<br />
Shire HGT<br />
UHB NHSFT<br />
Private Patient - MK<br />
UHB NHSFT<br />
<strong>Birmingham</strong> Community Healthcare<br />
Scotland<br />
30 June <strong>2012</strong> 30 May <strong>2012</strong><br />
Value Age<br />
(£k) (Days)<br />
Age<br />
(Days)<br />
Value<br />
(£k)<br />
140 381 110 381<br />
108 159<br />
347 139 317 139<br />
151 113 121 113<br />
252 69 222 69<br />
110 67<br />
861 769<br />
31
Financial summary.<br />
April – June <strong>2012</strong><br />
The Monitor Financial Risk rating is 4 per plan, with Liquidity remaining strong.<br />
The EBITDA and Income Surplus margins are within 0.2% of the plan. This highlights that there<br />
is minimal flexibility for failing to deliver on Income and CIP targets.<br />
Clinical Income performance is lower than plan in June. Although activity performance is<br />
strong in some areas, high PbR emergency overperformance combined with<br />
underperformances in some surgical specialties and Cardiac Surgery is resulting in the in-month<br />
financial deficit. Expenditure is worse than plan, which is a result of a shortfall on CIP combined<br />
with Estates cost pressures and in some Directorates, overperformance and workforce related<br />
costs.<br />
CIP is the key concern with only 85% of the plan achieved to date but there are inherently<br />
greater risks than this headline figure.<br />
The variances from target of Cash and Capital are within acceptable levels with closer<br />
monitoring of these and other working capital areas now planned and agreed.<br />
32
<strong>Birmingham</strong> <strong>Children's</strong> <strong>Hospital</strong> Performance Report - Month 3 - June <strong>2012</strong><br />
Monitor Quarter 4 2011/12 (confirmed)<br />
Finance risk rating G(4) Finance risk rating G(4)<br />
Governance risk rating G Governance risk rating G<br />
Mandatory Services risk rating G Mandatory Services risk rating G<br />
Safety Assurance System in place risk rating G Safety Assurance System in place risk rating G<br />
Strategic Objectives<br />
Every child and young person requiring access to care at<br />
<strong>Birmingham</strong> Children‟s <strong>Hospital</strong> will be admitted in a timely way,<br />
with no unnecessary waiting along their pathway<br />
Every child and young person cared for by <strong>Birmingham</strong><br />
Children‟s <strong>Hospital</strong> will be provided with safe, high quality care,<br />
and a fantastic patient and family experience<br />
Every member of staff working for <strong>Birmingham</strong> Children‟s<br />
<strong>Hospital</strong> will be looking for, and delivering better ways of<br />
providing outstanding care, at better value<br />
Every member of staff working for <strong>Birmingham</strong> Children‟s<br />
<strong>Hospital</strong> will be a champion for children and young people<br />
We will strengthen <strong>Birmingham</strong> Children‟s <strong>Hospital</strong>‟s<br />
position as a provider of Specialised and Highly<br />
Specialised Services, so that we become the leading<br />
provider of Children‟s Healthcare in the UK<br />
We will continue to develop <strong>Birmingham</strong> Children‟s<br />
<strong>Hospital</strong> as a provider of outstanding local services: „a<br />
hospital without walls‟, working in close partnership with<br />
other organisations<br />
Enablers<br />
Our „people strategy‟ so everyone knows what role they<br />
have to play and how they will be supported<br />
A local Operating Framework & Financial Plan to ensure<br />
we move from strategy to action<br />
A strategy to deliver a modern environment, fit for an<br />
ambitious 21st century hospital<br />
Brand and Reputation<br />
National Measures<br />
Monitor Quarter 1 <strong>2012</strong>/13 (predicted)<br />
ED Triage within 15 minutes: 95th percentile < 15 minutes 30<br />
ED Time Seen within 60 minutes : median 69<br />
CAMHS Refusals 7<br />
Tertiary Refusals 3<br />
Tertiary Delays over 24 hours 6<br />
PICU<br />
Issues<br />
Every child and young person requiring access to care at <strong>Birmingham</strong><br />
Children’s <strong>Hospital</strong> will be admitted in a timely way, with no unnecessary<br />
waiting along their pathway<br />
Access<br />
PICU Refusals: West Midland Patients. 2
June Red Rated Performance<br />
Category<br />
Performance<br />
Indicator<br />
A&E<br />
No patient (All patients) will<br />
wait more than 15 minutes<br />
Flow<br />
Tertiary<br />
Referrals<br />
Tertiary<br />
Referrals<br />
Tertiary<br />
Referrals -<br />
ALL<br />
Camhs<br />
Tertiary<br />
Refusals<br />
(Number/%)<br />
Tertiary<br />
Referrals -<br />
Patients that<br />
did not get a<br />
bed within 24<br />
hours of<br />
asking<br />
Tertiary<br />
Refusals<br />
(Number/%)<br />
Provider failure to ensure<br />
that “sufficient appointment<br />
slots” are made available<br />
on the Choose & Book<br />
system<br />
Performance Target<br />
95th percentile<br />
< 15 mins<br />
Lead<br />
Chief<br />
Officer<br />
R A G Apr-12 May-12 Jun-12 YTD<br />
Last year<br />
position<br />
COO 32 34 30 32 42<br />
Number of patients COO >0 0 0 6 3 9 4<br />
% of patients COO >0 0 0 3.04 1.86 0.22<br />
Number of patients COO 7 23 6 36 53<br />
% of patients COO 5.2 11.7 3.7 7.3<br />
2.9<br />
Number of patients COO >0 0 0 7 3 10 NA<br />
% of patients COO >0 0 0 3.6 1.86 2<br />
Q1 trajectory to deliver<br />
0.03 by Q4 to be<br />
submitted Q2 – Q3<br />
delivery of trajectory Q4<br />
= 0.03 per month<br />
Strategic Objectives<br />
Contract<br />
COO >0.03 0.03 0.03 0.01 0.05 0.03 0.03<br />
NA<br />
Comments<br />
Also Quality Account indicator<br />
& Contractual obligation<br />
Excludes non-BCH<br />
catchment<br />
Excludes non-BCH<br />
catchment<br />
ALL requests<br />
CAMHS DNA Rate<br />
Less than 10% COO >10 -
June Red Rated Performance continued…<br />
Category<br />
Performance<br />
Indicator<br />
Performance Target<br />
Lead<br />
Chief<br />
Officer<br />
R A G Apr-12 May-12 Jun-12 YTD<br />
Safety, Governance & Patient Experience<br />
Last year<br />
position<br />
Comments<br />
Internal BCH<br />
target<br />
Internal BCH<br />
target<br />
Population of<br />
the risk<br />
register<br />
Actions to<br />
address risks<br />
Risks greater than or<br />
equal to 16 have an<br />
action plan recorded<br />
on the risk register (%)<br />
All risks have<br />
completed actions<br />
sections (%)<br />
CMO
Monitor<br />
Monitor Governance Risk Rating<br />
Performance<br />
Category<br />
Performance Target<br />
Indicator<br />
Growing a representative membership<br />
Lead<br />
Chief<br />
R A G Apr-12 May-12 Jun-12 YTD<br />
Last year<br />
position<br />
National target Overall numbers target 10,000 MCO Trend<br />
11,377 11,394 11,394 11,373<br />
Compliance framework - Targets, indicators and weightings<br />
Category<br />
Safety<br />
National target<br />
National target<br />
Performance<br />
Indicator<br />
C-Diff<br />
MRSA<br />
Patient Experience<br />
Performance Target<br />
0 cases per year - locally<br />
agreed threshold<br />
1 cases or less per year -<br />
locally agreed threshold<br />
Lead Chief<br />
Officer<br />
R A G Apr-12 May-12 Jun-12 YTD<br />
Monitor<br />
Weighting<br />
Last<br />
year<br />
position<br />
CNO >1 - 1 0 1 0 1 1 1<br />
CNO >0 - 0 0 0 0 0 1 0<br />
90% admitted COO
Department of Health<br />
Category<br />
Performance Indicator<br />
Preventing people form dying prematurely<br />
National<br />
Target<br />
National<br />
Target<br />
Performance<br />
Target<br />
Lead<br />
Chief<br />
Officer<br />
R A G Apr-12 May-12 Jun-12 YTD<br />
Last<br />
year<br />
position<br />
Surgery COO
Department of Health continued …<br />
Category<br />
Performance Indicator<br />
Performance<br />
Target<br />
Lead<br />
Chief<br />
Officer<br />
Helping people to recover from episodes of ill health or following injury<br />
Emergency<br />
Emergency Readmissions :<br />
National Target Readmissions COO<br />
after elective<br />
within 30 days<br />
National Target<br />
National Target<br />
Emergency Readmissions<br />
:after elective (with<br />
exclusions)<br />
Emergency Readmissions<br />
:after emergency<br />
admission<br />
Emergency<br />
Readmissions<br />
within 30 days<br />
Emergency<br />
Readmissions<br />
within 30 days<br />
COO<br />
COO<br />
R A G Apr-12 May-12 Jun-12 YTD<br />
69<br />
5.7%<br />
12<br />
0.99%<br />
125<br />
10.2%<br />
62<br />
4.9%<br />
3<br />
0.24%<br />
126<br />
10%<br />
53<br />
4.5%<br />
9<br />
0.76%<br />
95<br />
8.1%<br />
183<br />
5.0%<br />
24<br />
0.7%<br />
342<br />
9.4%<br />
Last<br />
year<br />
position<br />
NA<br />
NA<br />
NA<br />
Comments<br />
Exclusion Criteria: Regular<br />
Day Cases, Renal, Liver,<br />
Cancer Patients & Patients<br />
under 4 years.<br />
National Target<br />
Emergency<br />
Emergency Readmissions<br />
Readmissions<br />
:after emergency<br />
within 30 days<br />
admission (with exclusions)<br />
COO<br />
13<br />
1.1%<br />
29<br />
2.3%<br />
9<br />
0.76%<br />
50<br />
1.4%<br />
NA<br />
Exclusion Criteria: Regular<br />
Day Cases, Renal, Liver,<br />
Cancer Patients & Patients<br />
under 4 years.<br />
Ensuring that people have a positive experience of care<br />
National target 90% admitted COO >90 90 90.7 90.3 90.2 90.5 92.1<br />
National target 18 weeks<br />
95% non admitted COO >95 95 99.3 99.3 98.6 99.3 99.3<br />
National target 92% incomplete COO >92 92 99.7 99.7 98.4 99.7 98.2<br />
Diagnostic Tests within 6<br />
National target<br />
99% complete COO >99 99 100 100 100 100 81.2<br />
weeks<br />
Treating and caring for people in a safe environment and protecting them from avoidable harm.<br />
National Target<br />
National Target<br />
Health Care Acquired<br />
Infections<br />
<strong>Hospital</strong> related venous<br />
thromboembolism (VTE)<br />
No. of MRSA's CNO >0 - 0 0 0 0 0 0<br />
No. of CDiff CNO >1 - 1 0 1 0 1 1<br />
Risk Assesment CMO - - - 0 0 0 0 NA
Department of Health continued …<br />
Category<br />
Performance Indicator<br />
Performance<br />
Target<br />
Ensuring that people have a positive experience of care<br />
95% of patients time<br />
National Target Total time in A&E<br />
total time in A&E < 4<br />
hours.<br />
Unplanned reattendance<br />
Indicators<br />
required for<br />
local use and<br />
information<br />
should be<br />
published<br />
locally.<br />
National Target<br />
National Target<br />
rate<br />
Left department without<br />
being seen<br />
Time to initial assessment:<br />
ambulance borne patients<br />
Time to treatment in<br />
department<br />
Cancer: two week wait<br />
from referral to date first<br />
seen<br />
Mixed Sex Accomodation<br />
Breaches<br />
Lead<br />
Chief<br />
Officer<br />
R A G Apr-12 May-12 Jun-12 YTD<br />
Last<br />
year<br />
position<br />
COO >95 - 95 97.8 97.6 97.5 97.6 98.1<br />
5 -
No update<br />
No update<br />
No update<br />
CQC Quality and Risk Profile<br />
STANDARD JUNE JULY AUG SEPT OCT NOV DEC JAN FEB MARCH APRIL MAY JUNE Commentary<br />
1: Respecting & involving<br />
2: Consent<br />
4: Care & welfare<br />
5: <strong>Meeting</strong> nutritional needs<br />
6: Cooperating with other providers<br />
7: Safeguarding<br />
2011 <strong>2012</strong><br />
The only data available for this<br />
standard is the NHSLA level 3<br />
The only data available for this<br />
standard is the NHSLA level 3<br />
Additional information about<br />
serious case reviews not<br />
included<br />
8: Cleanliness & infection control<br />
„low green‟ (as green as can be)<br />
after having been „insufficient<br />
data‟. The change is due to new<br />
HPA data on MRSA and CDiff.<br />
9: Management of medicines<br />
10: Safety & suitability of premises<br />
11: Safety, availability & suitability of<br />
equipment<br />
12: Requirements relating to workers<br />
13: Staffing<br />
14: Supporting workers<br />
16: Assessing & monitoring quality<br />
17: Complaints<br />
21: Records<br />
ending towards better /better /much better than expected<br />
neutral/similar to expected<br />
tending towards worse than expected<br />
Negative/worse/much worse than expected<br />
Insufficient Data<br />
No Data<br />
There is no data for this<br />
standard<br />
Improvement relates to addition<br />
of NHSLA level 3 data<br />
Improvement relates to addition<br />
of NHSLA level 3 data<br />
Improvement relates to addition<br />
of NHSLA level 3 data<br />
Improvement relates to<br />
improved data quality.
Quality Accounts<br />
Quality Account indicators (Trust Priorities)<br />
Category<br />
Reducing<br />
Infection<br />
Reducing<br />
Healthcare<br />
Associated<br />
Infections in<br />
Paediatric<br />
Intensive Care<br />
Overall BCH<br />
mortality<br />
Performance Indicator<br />
Performance<br />
Target<br />
Lead Chief<br />
Officer<br />
R A G Apr-12 May-12 Jun-12 YTD<br />
MRSA 0 per year CNO >0 - 0 0 0 0 0 0<br />
Last<br />
year<br />
perfo<br />
rman<br />
Comments<br />
Local target with<br />
commissioners 0 per<br />
year<br />
MSSA<br />
Pre 48 hours CNO 1 2 0 3 16 YTD June 2011 - 9<br />
Post 48 hours CNO 1 4 1 6 11 YTD June 2011 - 2<br />
Below 1.4<br />
Reduce incidence of CVC<br />
infections per<br />
infections<br />
1000 CVC patient<br />
CNO 1.1<br />
Reduce and sustain the<br />
incidence of Ventilator<br />
days. Below 1.73 per<br />
1,000 ventilator CNO 0.7<br />
Associated Pneumonia (VAP) days<br />
No. of mortality's CMO 4 9 2 15<br />
Each patient mortality is<br />
See monthly safety<br />
investigated by a nurse and<br />
CMO<br />
report<br />
clinician<br />
Investigation information is<br />
provided to trust board<br />
CMO<br />
See monthly safety<br />
report<br />
Asthma<br />
Processes discussed at our<br />
Nurse and Doctor meetings<br />
Teaching sessions for new<br />
doctors<br />
Review our asthma care teams<br />
to ensure sustainability and<br />
resilience<br />
Amend the new care pathway<br />
documentation<br />
CMO<br />
CMO<br />
CMO<br />
CMO
Quality Account indicators (Trust Priorities) continued …<br />
Category<br />
Medication<br />
Incidents<br />
Staff survey<br />
Performance Indicator<br />
Develop electronic prescribing<br />
for paediatric care<br />
Introduce Smart Pump<br />
technology for infusions<br />
Continue to develop staff<br />
awareness about medicine<br />
safety<br />
Continue to review all serious<br />
medication incidents to identify<br />
areas to improve<br />
Raise awareness about timely<br />
antibiotic administration through<br />
our Surviving Sepsis campaign<br />
Staff would be happy with the<br />
standards of care given to<br />
friends and family<br />
Staff feel that care of children<br />
and young people is the trusts<br />
top priority<br />
Performance<br />
Target<br />
Lead Chief<br />
Officer<br />
CFO<br />
CMO<br />
CMO<br />
CMO<br />
CMO<br />
Monitored through patient &<br />
Food and nutrition<br />
family feedback & food<br />
CNO<br />
walkabouts.<br />
Activities and play NCQI Performance CNO
Quality Account indicators (Trust Priorities) continued …<br />
Category<br />
ED transfers<br />
Peer Review<br />
Publications.<br />
Pressure Ulcers<br />
WHO Safe<br />
Surgery Checklist<br />
Nursing Care<br />
Quality Indicators<br />
Acute Life<br />
Threatening<br />
Events, Cardiac &<br />
Respiratory<br />
Arrests<br />
Performance Indicator<br />
Fewer patients transferred out<br />
of BCH Emergency department<br />
Performance<br />
Target<br />
No patient<br />
transferred out of<br />
BCH<br />
Lead Chief<br />
Officer<br />
R A G Apr-11 May-12 Jun-12 YTD<br />
Last<br />
year<br />
perfo<br />
rman<br />
Comments<br />
COO >0 - 0 0 0 0 0 0 May 2011 - 0<br />
No. of Peer Reviews Research<br />
Publications<br />
CMO 271<br />
Number of Pressure Ulcers at<br />
Grade 3 and above<br />
Trend CNO 0 0 0 0 1<br />
100% compliance with checklist<br />
% of checks 100%<br />
completed<br />
CMO
Quality Account indicators (Trust Priorities) continued …<br />
Category<br />
Health Promotion<br />
Data Quality<br />
Category<br />
For records<br />
submitted to SUS<br />
for inclusion in<br />
HES<br />
Information quality<br />
for records<br />
management<br />
using the<br />
Information<br />
Governance Tool<br />
Kit<br />
Performance Indicator<br />
25% of people who come to our<br />
main Outpatients Department are<br />
asked about health behaviours<br />
We will give brief advice about<br />
smoking to 50% of parents and<br />
carers who tell us they smoke<br />
We will give brief advice about<br />
alcohol to 70% of children and<br />
young people who tell us they drink<br />
alcohol<br />
We will give brief advice about<br />
smoking to 90% of children and<br />
young people who tell us they<br />
smoke<br />
Performance Indicator<br />
% that had a valid patient NHS<br />
number<br />
% that had a valid general<br />
practitioner registration code<br />
Performance<br />
Target<br />
Performance<br />
Target<br />
Lead Chief<br />
Officer<br />
R A G Apr-12 May-12 Jun-12 YTD<br />
Last<br />
year<br />
perfo<br />
rman<br />
CNO 25 NA<br />
CNO 50 NA<br />
CNO 70 100<br />
CNO 90 83<br />
Lead Chief<br />
Officer<br />
R A G Apr-12 May-12 Jun-12 YTD<br />
Last<br />
year<br />
perfo<br />
rman<br />
Admitted patient<br />
care<br />
CFO 97.7% 97.8% NA<br />
Outpatient care CFO 98.8% 98.5% NA<br />
ED care CFO 96.2% 97.0% NA<br />
Admitted patient<br />
care<br />
CFO 100% 100% NA<br />
Outpatient care CFO 100% 100% NA<br />
ED care CFO 100% 100% NA<br />
CFO<br />
Comments<br />
Comments<br />
Performance<br />
reported 1 month in<br />
arrears.
Strategic Objectives<br />
Category Performance Indicator Performance Target<br />
Discharge<br />
Delays<br />
Discharge<br />
Delays<br />
No patient will leave the emergency<br />
department without being seen<br />
Lead<br />
Chief<br />
Officer<br />
R A G Apr-12 May-12 Jun-12 YTD<br />
Last year<br />
position<br />
Median time from arrival COO 9 9 8 9 11<br />
95th percentile COO >15 15 32 34 30 32 42<br />
Single longest total time COO 250 75 399 250 107<br />
Median time from arrival COO >60 - 4 4 4 4 5 - 0 0 0 6 3 9 4<br />
% of patients COO >0 0 0 3.04 1.86 4.2 0.22<br />
Number of patients COO 7 23 6 36 53<br />
% of patients COO 5.2 11.7 3.7 7.3 2.9<br />
Number of patients COO >0 0 0 7 3 10 NA<br />
% of patients COO >0 0 0 3.6 1.86 2 NA<br />
Number of patients not<br />
admitted to a CAMHS bed<br />
COO 9 4 7 23 75<br />
% of patients not admitted to<br />
a CAMHS bed.<br />
COO 47.4 36.4 53.8 51 48.2<br />
FLOW<br />
Delayed discharge total patients Total patients COO 2 1 3 6 NA<br />
Delayed discharge total bed days Total bed days COO 60 31 81 172 NA<br />
Comments<br />
Every child and young person requiring access to care at <strong>Birmingham</strong> Children’s <strong>Hospital</strong> will be admitted in a timely way, with no unnecessary waiting<br />
along ACCESS their pathway<br />
ED deflections Number of patients deflected COO 0 0 0 0 0<br />
Emergency<br />
Department<br />
Tertiary<br />
Referrals<br />
Tertiary<br />
Referrals<br />
CAMHS<br />
No patient (All patients) will wait more<br />
than 15 minutes for initial full<br />
assessment<br />
No patient will wait more than 1 hour to<br />
start of definitive treatment from a<br />
decision making clinician<br />
No patient will spend more than 4<br />
hours in total in the emergency<br />
department<br />
Tertiary Refusals (Number/%)<br />
Tertiary Referrals - Patients that did<br />
not get a bed within 24 hours of asking<br />
Tertiary Tertiary Refusals (Number/%)<br />
Referrals - ALL<br />
Patients that requested a BCH T4<br />
CAMHS bed and were not admitted<br />
following a gateway assesment<br />
Excludes non-BCH<br />
catchment<br />
Excludes non-BCH<br />
catchment<br />
ALL requests
Strategic Objectives continued …<br />
Category Performance Indicator Performance Target<br />
Cancelled<br />
Operations<br />
Cancelled<br />
Operations<br />
RTT Waiting<br />
Times<br />
Diagnostic<br />
Waits<br />
PICU<br />
Provider cancellation of Elective Care<br />
operation for non-clinical reasons<br />
either before or after Patient admission<br />
Breach of clause 40.5 (Admitted patient<br />
and had operation cancelled for non clinical<br />
reasons. The provider needs to offer them a<br />
date within 5 operational days which falls within<br />
28 days from cancellation.)<br />
Lead<br />
Chief<br />
Officer<br />
R A G Apr-12 May-12 Jun-12 YTD<br />
Last year<br />
position<br />
Comments<br />
FLOW<br />
Number of cancellations COO 38 39 23 77 347 June 2011 - 20<br />
% of cancellations COO 1.5 - 0.8 2.1 1.96 1.22 1.76 1.6<br />
100% compliance COO 90 - 90 90.7 90.3 90.2 90.4 91.6<br />
% of non admitted over 18 weeks 95% non admitted COO >95 - 95 99.3 99.3 98.6 99.1 98.9<br />
% of incomplete over 18 weeks 92% incomplete COO >92 - 92 97.7 97.7 98.4 98 97.9<br />
CAMHS - number of non admitted over<br />
18 weeks<br />
COO Trend<br />
33 31 64<br />
CAMHS - % of non admitted over 18<br />
weeks<br />
90% non admitted COO 90 88.6 87.6 88.8 88.6<br />
Diagnostic waits number >6 weeks COO 0 0 0 0<br />
Diagnostic waits % >6 weeks Operating Standard 99% COO
Category Performance Indicator Performance Target<br />
Lead<br />
Chief<br />
Officer<br />
R A G Apr-12 May-12 Jun-12 YTD<br />
Expanding our <strong>Hospital</strong> at Home Services<br />
CPO<br />
Local strategy for children‟s general services<br />
CMO<br />
Working in partnership to develop new and innovative<br />
COO<br />
CAMHS models<br />
ENABLERS<br />
Our ‘people strategy’ so everyone knows what role they have to play and how they will be supported<br />
People Strategy<br />
CWD<br />
A local Operating Framework & Financial Plan to ensure we move from strategy to action<br />
Resources report<br />
CFO<br />
A strategy to deliver a modern environment, fit for an ambitious 21st century hospital<br />
New <strong>Hospital</strong> Project<br />
CFO<br />
Brand and Reputation<br />
150 years celebrations<br />
CEO<br />
Last year<br />
position<br />
Comments<br />
Every child and young person cared for by <strong>Birmingham</strong> Children’s <strong>Hospital</strong> will be provided with safe, high quality care, and a fantastic patient and family<br />
experience<br />
Every member of staff working for <strong>Birmingham</strong> Children’s <strong>Hospital</strong> will be looking for, and delivering better ways of providing outstanding care, at better<br />
value<br />
Emergency Care pathway<br />
COO<br />
June-Sept<br />
Research Output profile<br />
CMO<br />
Sept – Nov<br />
Equipping staff to create value<br />
CWO<br />
Nov-Jan<br />
Better use of staff and physical resources<br />
CFO<br />
Feb-March<br />
Every member of staff working for <strong>Birmingham</strong> Children’s <strong>Hospital</strong> will be a champion for children and young people<br />
National Strategy for Children‟s specialised services<br />
CEO<br />
June-<strong>July</strong><br />
Making every contact count<br />
CNO<br />
Oct-Dec<br />
YPAG<br />
CNO<br />
Dec-March<br />
We will strengthen <strong>Birmingham</strong> Children’s <strong>Hospital</strong>’s position as a provider of Specialised and Highly Specialised Services, so that we become the<br />
leading provider of Children’s Healthcare in the UK<br />
Safe & Sustainable Designation<br />
CMO<br />
June – <strong>July</strong><br />
National Centre for rare diseases<br />
CMO<br />
Sept-Nov<br />
Children‟s surgery review<br />
CMO<br />
Jan-Feb<br />
We will continue to develop <strong>Birmingham</strong> Children’s <strong>Hospital</strong> as a provider of outstanding local services: ‘a hospital without walls’, working in close<br />
partnership with other organisations<br />
Jan-March<br />
June-<strong>July</strong><br />
<strong>July</strong>-Sept<br />
June<br />
Monthly<br />
April<br />
May?
Contractual agreements and requirements<br />
Section B Part 8.1: Quality Requirements<br />
Performance Indicator<br />
Performance Target<br />
Lead<br />
Chief<br />
Officer<br />
R A G Apr-12 May-12 Jun-12 Quarter<br />
to Date<br />
YTD<br />
Last year<br />
position<br />
MRSA bacteraemia 0 post 48 hour MRSA CNO >0 - 0 0 0 0 0 0 0<br />
A&E measures<br />
Total time spent in A&E<br />
95% admitted and nonadmitted<br />
within 4 hours<br />
COO 5.5 - 5.5 - 15 - 60 -
Section B Part 8.1: Quality Requirements continued…<br />
Performance Indicator<br />
Performance Target<br />
Lead<br />
Chief<br />
Officer<br />
R A G Apr-12 May-12 Jun-12 Quarter<br />
to Date<br />
Choose and Book<br />
C&B: % of services directly<br />
>95% by June <strong>2012</strong> COO
Section B Part 8.1: Quality Requirements continued…<br />
Performance Indicator<br />
SUS<br />
Performance Target<br />
Lead<br />
Chief<br />
Officer<br />
R A G Apr-12 May-12 Jun-12 Quarter<br />
to Date<br />
YTD<br />
Last year<br />
position<br />
Comments<br />
Percentage of SUS data altered.<br />
% of SUS data altered in<br />
period between 5<br />
Operational Days after<br />
month-end<br />
CFO<br />
Requirements currently being<br />
clarified with commissioners.<br />
Locally Agreed KPIs<br />
Performance Indicator<br />
Performance Target<br />
Lead<br />
Chief<br />
Officer<br />
R A G Apr-12 May-12 Jun-12 Quarter<br />
to Date<br />
YTD<br />
Last year<br />
position<br />
DNA<br />
Patient DNA New patient 11 -
Locally Agreed KPIs continued …<br />
Performance Indicator<br />
Infection Control<br />
Performance Target<br />
Lead<br />
Chief<br />
Officer<br />
R A G Apr-12 May-12 Jun-12 Quarter<br />
to Date<br />
YTD<br />
Last year<br />
position<br />
PICU - 95% CNO
Locally Agreed KPIs continued …<br />
Performance Indicator<br />
Complaints responded to within<br />
agreed timeline<br />
Commissioner complaints to be<br />
responded to within agreed timeline<br />
External Reviews: Commissioners<br />
should be informed of unplanned<br />
reviews.<br />
External Reviews: Reports of<br />
reviews to be shared with<br />
commissioners<br />
Resulting action plans and progress<br />
made to be shared with<br />
commissioners<br />
Performance Target<br />
Lead<br />
Chief<br />
Officer<br />
R A G Apr-12 May-12 Jun-12 Quarter<br />
to Date<br />
YTD<br />
Last year<br />
position<br />
95% CMO 95 100 100 100 100 100 100<br />
90% CMO 90 NA<br />
Within 48 hours of<br />
occurrence<br />
Within 10 working days<br />
of receipt of the final<br />
report.<br />
Within 1 month of receipt<br />
of report.<br />
CMO<br />
CMO<br />
CMO<br />
Schedule B Part 8.2: Nationally Specified Events<br />
Performance Indicator<br />
Other National Indicators<br />
Performance Target<br />
Lead<br />
Chief<br />
Officer<br />
NA<br />
NA<br />
NA<br />
R A G Apr-12 May-12 Jun-12 Quarter<br />
to Date YTD Last<br />
Year<br />
CDIFF 1 CNO >1 - 1 0 1 0 1 1 1<br />
4 hour maximum time in A&E<br />
Operating standard of<br />
95%<br />
COO
Schedule B Part 8.2: Nationally Specified Events<br />
Performance Indicator<br />
Patients seen within 2 weeks of an<br />
urgent GP referral for suspected<br />
cancer<br />
Patients with breast symptoms<br />
seen within two weeks of referral<br />
Patients receiving first definitive<br />
treatment for cancer within 62 days<br />
of an urgent GP referral<br />
Proportion of patients receiving first<br />
definitive treatment for cancer within<br />
62 days of a referral from an NHS<br />
Cancer screening Screening<br />
Service Proportion of patients receiving first<br />
definitive treatment for cancer within<br />
62 days following a consultant's<br />
decision to upgrade to patient<br />
priority<br />
Patients receiving first difinitive<br />
treatment within one month of<br />
diagnosis<br />
Patients waiting no more than 31<br />
days for second or subsequent<br />
cancer treatment - surgery<br />
Patients waiting no more than 31<br />
days for second or subsequent<br />
cancer treatment - drug treatments<br />
Patients waiting no more than 31<br />
days for second or subsequent<br />
cancer treatment - radiotherapy<br />
treatments<br />
Performance Target<br />
Operating standard of<br />
93%<br />
Operating standard of<br />
93%<br />
Operating standard of<br />
85%<br />
Operating standard of<br />
90%<br />
Operating standard of<br />
85%<br />
Operating standard of<br />
96%<br />
Operating standard of<br />
94%<br />
Operating standard of<br />
98%<br />
Operating standard of<br />
94%<br />
Lead<br />
Chief<br />
Officer<br />
R A G Apr-12 May-12 Jun-12 Quarter<br />
to Date<br />
Oncology<br />
YTD<br />
Last year<br />
position<br />
COO
Schedule B Part 8.2: Nationally Specified Events continued.<br />
Performance Indicator<br />
Waiting times<br />
Patients seen within 18 weeks<br />
across for admitted pathways<br />
Patients seen within 18 weeks<br />
across for non- admitted pathways<br />
Performance Target<br />
Operating standard of<br />
90%<br />
Operating standard of<br />
95%<br />
Lead<br />
Chief<br />
Officer<br />
R A G Apr-12 May-12 Jun-12 Quarter<br />
to Date<br />
COO 0 - 0 0 0 0 0 0 3<br />
Wrongly prepared high-risk injectable<br />
medication<br />
Target 0 CMO >0 - 0 0 0 0 0 0 0<br />
Maladministration of potassiumcontaining<br />
solutions (modified)<br />
Target 0 CMO >0 - 0 0 0 0 0 0 0<br />
Wrong route administration of<br />
chemotherapy (existing)<br />
Target 0 CMO >0 - 0 0 0 0 0 0 0<br />
Wrong route administration of<br />
oral/enteral treatment (new)<br />
Target 0 CMO >0 - 0 0 0 0 0 0 0<br />
Intravenous administration of epidural<br />
medication (new)<br />
Target 0 CMO >0 - 0 0 0 0 0 0 0<br />
Maladministration of Insulin (new) Target 0 CMO >0 - 0 0 0 0 0 0 0<br />
Overdose of midazolam during<br />
conscious sedation (new)<br />
Target 0 CMO >0 - 0 0 0 0 0 0 0<br />
Comments<br />
Compliance with Eliminating<br />
Single Sex Accomodation
Schedule B Part 8.2: Nationally Specified Events continued<br />
Performance Indicator<br />
Governance continued<br />
Never events (Schedule 3 part 4C)<br />
Suicide using non-collapsible rails<br />
(existing)<br />
Escape of a transferred prisoner<br />
(existing)<br />
Performance Target<br />
Lead<br />
Chief<br />
Officer<br />
R A G Apr-12 May-12 Jun-12 Quarter<br />
to Date<br />
YTD<br />
Last year<br />
position<br />
Target 0 CMO >0 - 0 0 0 0 0 0 0<br />
Target 0 CMO >0 - 0 0 0 0 0 0 0<br />
Falls from unrestricted windows (new) Target 0 CMO >0 - 0 0 0 0 0 0 0<br />
Entrapment in bedrails (new) Target 0 CMO >0 - 0 0 0 0 0 0 0<br />
Transfusion of ABO-incompatible blood<br />
components<br />
Target 0 CMO >0 - 0 0 0 0 0 0 0<br />
Transplantation of ABO or HLAincompatible<br />
Organs<br />
Target 0 CMO >0 - 0 0 0 0 0 0 0<br />
Misplaced naso- or oro-gastric tubes Target 0 CMO >0 - 0 0 0 0 0 0 0<br />
Wrong gas administered Target 0 CMO >0 - 0 0 0 0 0 0 0<br />
Failure to monitor and respond to<br />
oxygen saturation<br />
Target 0 CMO >0 - 0 0 0 0 0 0 0<br />
Air embolism Target 0 CMO >0 - 0 0 0 0 0 0 0<br />
Misidentification of patients Target 0 CMO >0 - 0 0 0 0 0 0 0<br />
Severe scalding of patients Target 0 CMO >0 - 0 0 0 0 0 0 0<br />
Maternal death due to post partum<br />
haemorrhage after elective Caesarean<br />
section<br />
Target 0 CMO >0 - 0 0 0 0 0 0 0<br />
Comments
Schedule B Part 14.2: National Requirements Reported Locally<br />
Performance Indicator<br />
Price Activity Matrix (PAM) submitted monthly.<br />
Performance Target<br />
HCAI Reduction Plan<br />
Contribution to the health economy strategic plan for HCAIs<br />
via attendance at health economy meetings<br />
Documented HCAI assurance framework/strategy –<br />
presentation of the Trust‟s internal action plan to the CQRG.<br />
Reporting outbreaks of infection – email from Trust to<br />
Infection Prevention Lead informing Cluster of outbreak<br />
MRSA bacteraemia and CDI deaths 100% within 2 working<br />
(part 1a&b)<br />
days.<br />
Demonstrate current cleaning standards within national<br />
cleaning guidance<br />
Compliance with Care Bundles (HII). In line with the<br />
Department of Health recommendations<br />
No. of ECOLI<br />
Lead<br />
Chief<br />
Officer<br />
R A G Apr-12 May-12 Jun-12 Quarter<br />
to Date<br />
YTD<br />
Last year<br />
position<br />
Comments<br />
CFO Contracting Team<br />
NA Monthly Monitoring Sheets<br />
CNO<br />
CNO<br />
CNO<br />
CNO 0 - 0 0 0 0 0 0 0<br />
Cancer Registration Data Set (ISN) Reporting on Staging.<br />
COO<br />
Infection Team<br />
Cancer<br />
Waiting Data<br />
Violence-related injury to staff CWD NA<br />
Report on Incidents CMO Governance<br />
NA<br />
NA<br />
Quarterly - via Clinical Quality<br />
Review Group<br />
Submitted through Cancer<br />
Waiting Database one month in<br />
arrears.<br />
Reported Quarterly through BCH<br />
Non-clinical risk co-ordinating<br />
committee<br />
See Governance Report/ Sefety<br />
& Governance Page
Schedule B Part 14.2: National Requirements Reported Locally<br />
Performance Indicator<br />
Data Quality<br />
Progress against milestones in Data<br />
Quality Improvement Plan<br />
Performance Target<br />
Annual Report on progress on climate change adaptation,<br />
Mitigation and sustainable performance.<br />
Report Against Performance of Service Development and<br />
Improvement Plan.<br />
Lead<br />
Chief<br />
Officer<br />
R A G Apr-12 May-12 Jun-12 Quarter<br />
to Date<br />
YTD<br />
Last year<br />
position<br />
A -GMP Organisation<br />
Code<br />
CFO<br />
NA<br />
B - Discharge Date CFO 100 100 100 NA<br />
C - NHS Number CFO 97.9 98.5 98.3 NA<br />
D - Contract Suffix CFO NA<br />
E- Discharge Ready Date CFO NA<br />
Schedule B Part 14.3: Local Requirements Reported Locally<br />
COO<br />
CFO<br />
European Working Directive Compliance CWD NA<br />
Patient Level Data SUS and Non-<br />
Sus<br />
Patient Transfers<br />
Non PBR variable data submitted<br />
Data Protection Act<br />
Detailing PCT, GP<br />
Practice & CCG<br />
No. of patients<br />
transferred out of BCH<br />
% of patients transferred<br />
out of BCH.<br />
HCS NON-pbr variable<br />
data<br />
Submission of toolkit self<br />
assesment scores<br />
CFO<br />
COO >0 - 0 0 0 0 0 0 0<br />
COO >0 - 0 0 0 0 0 0 0<br />
CFO<br />
Submit data.<br />
CFO Submit data.<br />
Level 2<br />
NA<br />
NA<br />
NA<br />
NA<br />
Comments<br />
Also Reported in Data Quality<br />
Indicators.<br />
Annual year end report (10<br />
working days after 31 st March<br />
2013)<br />
Reported via Contract Review<br />
<strong>Meeting</strong>s.<br />
Writtten report required on areas<br />
of non-compliance<br />
Monitored via data submission<br />
to SUS<br />
State reason for tranfer.<br />
Submitted monthly to HCS as<br />
per contract timetable<br />
Bi-annual submission. Provided<br />
10 working days after 31st Oct<br />
2011 and March 31st <strong>2012</strong><br />
PBR Audit CFO Annual<br />
Waiting Times Report for all<br />
breaches.in relation to Cancer<br />
COO NA Reported via SCT.<br />
Services.<br />
RTT Waits and Numbers -<br />
Spreadsheet<br />
COO Submit data.<br />
NA
Schedule B Part 14.3: Local Requirements Reported Locally continued.<br />
Performance Indicator<br />
HCAI - MRSA & CDIFF Exception<br />
Reports<br />
Safeguarding<br />
Performance Target<br />
Monthly exception<br />
Reports<br />
Lead<br />
Chief<br />
Officer<br />
R A G Apr-12 May-12 Jun-12 Quarter<br />
to Date<br />
YTD<br />
Last year<br />
position<br />
CNO 0 1 0 1 1 NA<br />
The number of DOLS<br />
authorised<br />
CNO<br />
NA<br />
% DOLS authorised CNO NA<br />
% compliance -<br />
safeguarding training<br />
CNO 99 98.2 98.2 97<br />
Comments<br />
Detailing breaches - anonymised<br />
Patient Level information/ GP<br />
Practice Code<br />
Reported via Clinical Quality<br />
Review <strong>Meeting</strong>.<br />
FNP Scorecard<br />
CAMHS - Caseload management<br />
CAMHS - Length of episodes<br />
CAMHS - Emergency Referrals<br />
CAMHS - Access<br />
PAN <strong>Birmingham</strong> Cancer Network<br />
% staff receiving<br />
safeguarding supervision<br />
Submit Dashboard<br />
monthly<br />
Policies and practices<br />
are in place for all staff<br />
ensuring caseload<br />
supervisions<br />
Report on length of<br />
episode in CAMHS by;<br />
diagnosis, severity and<br />
complexity<br />
CNO<br />
CNO<br />
COO<br />
COO<br />
Number of referrals COO NA<br />
Number of admissions<br />
from referrals<br />
COO<br />
NA<br />
Quarterly Report CAMHS<br />
Access across 16<br />
Localities as defined with<br />
Bham City Councils<br />
<strong>Children's</strong> Services.<br />
Position statement on<br />
compliance against<br />
tumour sites against IOG<br />
criteria<br />
COO<br />
CAMHS<br />
NA<br />
NA<br />
NA<br />
NA<br />
NA<br />
Reported via requirements as<br />
agreed with SCT.<br />
Quarterly Report - discussed at<br />
CAMHS performance<br />
management meeting,<br />
Bi Monthly. Discussed at<br />
CAMHS Performance<br />
Management <strong>Meeting</strong>.<br />
Bimonthly report. Discussed at<br />
CAMHS Performance<br />
Management <strong>Meeting</strong>.<br />
Quarterly Report discussed at<br />
CAMHS oerformance<br />
Management <strong>Meeting</strong>.<br />
COO NA Reported via SCT.
Schedule B Part 14.3: Local Requirements Reported Locally continued.<br />
Performance Indicator<br />
PAN <strong>Birmingham</strong> Cancer Network -<br />
Progress against Improving<br />
Outcomes Guidance<br />
Emergency Readmissions : after<br />
elective<br />
Emergency Readmissions :after<br />
elective (with exclusions)<br />
Emergency Readmissions :after<br />
emergency admission<br />
Emergency Readmissions :after<br />
emergency admission (with<br />
exclusions)<br />
QIPP Report<br />
Best Practice Tarriff - Paediatric<br />
Diabetes<br />
Equality and Diversity<br />
Lead Chief<br />
Performance Target<br />
Officer<br />
R A G Apr-12 May-12 Jun-12 Quarter<br />
to Date<br />
Progress Report COO NA<br />
Report and action plan to<br />
be collated by end April.<br />
Emergency<br />
Readmissions within 30<br />
days<br />
Emergency<br />
Readmissions within 30<br />
days<br />
Emergency<br />
Readmissions within 30<br />
days<br />
Emergency<br />
Readmissions within 30<br />
days<br />
QIPP Scheme reports for<br />
those that cannot be<br />
monitored via SUS<br />
BPT to commence in<br />
third quarter of <strong>2012</strong>/13<br />
or as defined in SDIP<br />
Q1 - Publish Information<br />
on Staff & Service Users<br />
to demonstrate<br />
Compliance<br />
Q1 - Publish Equality<br />
objectives & send to<br />
commissioners<br />
Q4 - Progress Report on<br />
Equality objectives to be<br />
sent to Commissioner.<br />
COO<br />
COO<br />
COO<br />
COO<br />
COO<br />
CFO<br />
COO<br />
CWD<br />
CWD<br />
CWD<br />
69<br />
5.7%<br />
12<br />
0.99%<br />
125<br />
10.2%<br />
13<br />
1.1%<br />
62<br />
4.9%<br />
3<br />
0.24%<br />
126<br />
10%<br />
29<br />
2.3%<br />
53<br />
4.5%<br />
9<br />
0.76%<br />
95<br />
8.1%<br />
9<br />
0.76%<br />
183<br />
5.0%<br />
24<br />
0.7%<br />
342<br />
9.4%<br />
50<br />
1.4%<br />
YTD<br />
Last year<br />
position<br />
NA<br />
183<br />
5.0% NA<br />
Comments<br />
Exclusion Criteria: Regular<br />
24<br />
0.7% NA Day Cases, Renal, Liver, Cancer<br />
Patients & Patients under 4<br />
years.<br />
342<br />
9.4% NA<br />
Exclusion Criteria: Regular<br />
50<br />
1.4% NA Day Cases, Renal, Liver, Cancer<br />
Patients & Patients under 4<br />
years.<br />
NA<br />
NA<br />
NA<br />
NA<br />
NA<br />
Reported via SCT.<br />
Trust agreed Business Case.<br />
Recruitment in progress. Trust &<br />
commissioners are working in<br />
line with SDIP.<br />
Reported via Quality Review<br />
<strong>Meeting</strong>
Equality and Diversity<br />
Reported via Quality Review<br />
<strong>Meeting</strong><br />
Q3 - Submit a list of all<br />
policies/decisions that<br />
have been subject to<br />
equality analysis.<br />
CWD<br />
NA<br />
Schedule B Part 14.3: Local Requirements Reported Locally continued.<br />
Performance Indicator<br />
Equality and Diversity - Workforce<br />
Training Report<br />
Equality and Diversity - New<br />
Information Requirement<br />
Executive leadership Safety<br />
Walkabouts<br />
Demonstrate learning from rule 43<br />
coroners<br />
Performance Target<br />
% of staff trained in<br />
Equality & Diversity<br />
% of staff trained in<br />
Communications & Care<br />
provision for pepole with<br />
Learning Disabilities<br />
% of staff trained in<br />
Human Rights Act 1998 -<br />
to cover aspects of<br />
dignity and respect<br />
Submit bi-monthly<br />
progress returns using<br />
SHA EDS progress<br />
reporting template.<br />
Commissioners to<br />
receive at least 4<br />
summary reports<br />
Rule 43 letter, response<br />
from trust and any<br />
subsequent action plan<br />
Lead<br />
Chief<br />
Officer<br />
CWD<br />
CWD<br />
CWD<br />
CWD<br />
R A G Apr-12 May-12 Jun-12 Quarter<br />
to Date<br />
YTD<br />
Last year<br />
position<br />
CNO/CMO 2 3 4 NA<br />
CMO<br />
NA<br />
NA<br />
NA<br />
NA<br />
NA<br />
Comments<br />
Mortality (HSMR relative risk) Quarterly Report CMO NA Monthly Safety Report<br />
Workforce Report CWO NA<br />
Statement of CAS alerts and rapid<br />
response reviews, outcomes, gap<br />
analysis and any action plans<br />
Reported via Clinical Quality<br />
Review <strong>Meeting</strong>s<br />
Workforce Page of Performance<br />
Report<br />
CMO NA Governance Report
Commissioning for Quality and Innovations (CQUIN)<br />
Category<br />
Performance<br />
Indicator<br />
Heart Of <strong>Birmingham</strong> PCT<br />
HoB 1<br />
HoB 2<br />
HoB 3 A<br />
Safety<br />
Thermometer<br />
National<br />
(Weighting = 10%.<br />
Value = £178,078)<br />
Safety<br />
Thermometer<br />
Paediatric<br />
Specific<br />
(Weighting = 10%.<br />
Value = £178,078)<br />
Friends and<br />
Family Test<br />
Regional<br />
(Weighting = 4%.<br />
Value = £71,235)<br />
Performance Target<br />
Lead<br />
Chief<br />
Officer<br />
R A G Apr-12 May-12 Jun-12 Quarter<br />
to Date<br />
YTD<br />
Last year<br />
position<br />
No. of pressure ulcers per month CNO 0.99 1.74 2.44 NA<br />
No. of falls per month CNO 0 0 0 0 0 NA<br />
No. of UTIs in patients with catheters per month CNO 0 0 0.35 0.35 0.35 NA<br />
No. of VTE per month CNO 0 0 0 0 0 NA<br />
Sample Size CNO 302 287 287 876 876 NA<br />
Percentage of patients with harm free care CNO 99.01 98.26 97.21 NA<br />
Q1 Report on Paediatric specific outcomes,<br />
rationale for inclusion and adapted NHS Safety<br />
Thermometer Tool.<br />
Q2 Pilot the metrics (agreed Q1) and provide<br />
the pilot results and details of any refinements.<br />
Q3 Provide a report detailing surveyed<br />
outcomes for all months in quarter.<br />
Q4 Provide a report detailing surveyed<br />
outcomes for all months in quarter.<br />
10% of inpatient discharges, with patients<br />
surveyed at or within 48 hours of discharge<br />
CNO<br />
CNO<br />
CNO<br />
CNO<br />
CNO
Commissioning for Quality and Innovations (CQUIN) continued …<br />
Category<br />
Performance<br />
Indicator<br />
Heart Of <strong>Birmingham</strong> PCT<br />
Friends and<br />
Family Test<br />
HoB 3 B Regional<br />
(Weighting = 4%.<br />
Value = £71,235)<br />
Weekly<br />
HoB3 C Reporting<br />
(Weighting = 4%.<br />
Value = £71,235)<br />
HoB 3 D<br />
HoB 4<br />
Performance<br />
Improvement<br />
(Weighting = 4%.<br />
Value = £71,235)<br />
Net Promoter -<br />
Paediatric<br />
Specific<br />
(Weighting = 16%.<br />
Value = £284,939)<br />
Performance Target<br />
<strong>Board</strong> Minutes evidence patient experience<br />
reporting, including Net Promoter Score<br />
(Organisation, Specialty & Ward level.<br />
Evidence of weekly collation and review of the<br />
Net Promoter Score from Quarter 2<br />
Monthly Net Promoter Score shows either:<br />
(A) A 10 point improvement in Net Promoter<br />
Score<br />
(B) Achievement or maintenance of top quartile<br />
performance throughout <strong>2012</strong>/13<br />
Q1 Provide a report demonstrating the<br />
developed questions appropriate for different<br />
age groups and an indication of the reporting<br />
mechanism that will be used through the<br />
organisation to inform the board.<br />
Q2 Pilot the developed questions and provide<br />
the pilot results and details of any refinements<br />
to the questions for roll-out across the whole<br />
organisation.<br />
Q3 Provide a report demonstrating that the<br />
questions are established and reported for 10%<br />
of inpatient discharges, with patients surveyed<br />
at or within 48 hours of discharge. Evidence of<br />
weekly data collection. Evidence of <strong>Board</strong><br />
reporting and any changes implemented as a<br />
result<br />
Lead<br />
Chief<br />
Officer<br />
CNO<br />
R A G Apr-12 May-12 Jun-12 Quarter<br />
to Date<br />
YTD<br />
Last year<br />
position<br />
NA<br />
Comments<br />
CNO NA Applicable from Q2.<br />
CNO<br />
CNO<br />
CNO<br />
CNO<br />
NA<br />
NA<br />
NA<br />
NA<br />
June has exceeded the<br />
SHA top quartile<br />
standard. May saw a 10<br />
point increase from April<br />
12.<br />
Q1 report ready and<br />
submitted.
Commissioning for Quality and Innovations (CQUIN) continued …<br />
Category<br />
Performance Performance Target<br />
Indicator<br />
Heart Of <strong>Birmingham</strong> PCT<br />
HoB 4<br />
HoB 5A<br />
Net Promoter -<br />
Paediatric<br />
Specific<br />
continued<br />
Healthy<br />
Lifestyles -<br />
Smoking<br />
(Weighting = 8%.<br />
Value = £142,470)<br />
Q4 Provide a report demonstrating that the<br />
questions are established and reported for 10%<br />
of inpatient discharges, with patients surveyed<br />
at or within 48 hours of discharge. Evidence of<br />
weekly data collection. Evidence of <strong>Board</strong><br />
reporting and any changes implemented as a<br />
result<br />
Q4 Smoking Status recorded children<br />
preadmission 90%<br />
Q4 Smoking Status recorded children<br />
outpatients 25%<br />
Q4 Smoking Status recorded parents<br />
preadmission 80%<br />
Q4 Smoking Status recorded parents<br />
outpatients 25%<br />
Q4 Brief advice to stop smoking children<br />
preadmission 90%<br />
Q4 Brief advice to stop smoking children<br />
outpatients 90%<br />
Q4 Brief advice to stop smoking adults<br />
preadmission 50%<br />
Q4 Brief advice to stop smoking adults<br />
outpatients 50%<br />
Lead<br />
Chief<br />
Officer<br />
CNO<br />
CNO<br />
CNO<br />
CNO<br />
CNO<br />
CNO<br />
CNO<br />
CNO<br />
CNO<br />
R A G Apr-12 May-12 Jun-12 Quarter<br />
to Date<br />
YTD<br />
Last year<br />
position<br />
NA<br />
Comments<br />
Combined Q1<br />
update report<br />
produced and<br />
submitted<br />
Q4 Alcohol Status Recorded Children<br />
Preadmission 70%<br />
CNO<br />
HoB 5B<br />
Healthy<br />
Lifestyles -<br />
Alcohol<br />
(Weighting = 6.4%.<br />
Value = £113,976)<br />
Q4 Alcohol Status Recorded Children<br />
Outpatients 25%<br />
Q4 Patient drinking (Brief advice to stop<br />
drinking and referral to specialist services) Preadmission<br />
70%<br />
Q4 Patient drinking (Brief advice to stop<br />
drinking and referral to specialist services)<br />
Outpatients 70%<br />
CNO 83<br />
CNO<br />
CNO<br />
Combined Q1<br />
update report<br />
produced and<br />
submitted
Commissioning for Quality and Innovations (CQUIN) continued …<br />
Category<br />
Performance<br />
Indicator<br />
Performance Target<br />
Heart Of <strong>Birmingham</strong> PCT<br />
a) Evidence of board level commitment to<br />
implementation<br />
HoB 5C<br />
HoB 6<br />
Healthy<br />
Lifestyles -<br />
Making Every<br />
Contact Count<br />
(Weighting = 1.6%.<br />
Value = £1,976)<br />
CAMHS QNCC<br />
(Weighting = 16%.<br />
Value = £284,939)<br />
Lead<br />
Chief<br />
Officer<br />
CNO/CWD<br />
R A G Apr-12 May-12 Jun-12 Quarter<br />
to Date<br />
YTD<br />
Last year<br />
position<br />
b) <strong>Board</strong> level lead / champion in place CNO/CWD NA<br />
c) Evidence of organisational policies and<br />
procedures in place, for example organisational<br />
health and wellbeing development strategy,<br />
suitable data collection and reporting<br />
mechanisms, use of induction<br />
d) Evidence of activity to support employees<br />
own health and wellbeing including<br />
implementation of NICE PH tobacco guidance<br />
for workplaces<br />
e) System to routinely record the number of<br />
NHS staff completing locally agreed training in<br />
delivering lifestyle brief advice<br />
CNO/CWD<br />
CNO/CWD<br />
CNO/CWD<br />
f) System to routinely record the number of<br />
referrals from NHS organisations to local stop<br />
CNO/CWD<br />
smoking services, as a key indicator for delivery<br />
of brief lifestyle advice from NHS staff.<br />
QNCC Standards Type 1 (Essential): These are<br />
standards that are critical to care. Failure to<br />
meet these standards would result in a<br />
significant threat to patient safety, rights or<br />
dignity and/or would breach the law<br />
Type 2 (Expected): These are standards that a<br />
CAMHS team providing a good service would<br />
be expected to meet.<br />
COO<br />
COO<br />
NA<br />
NA<br />
NA<br />
NA<br />
NA<br />
NA<br />
NA<br />
Comments<br />
Q1 update report<br />
produced and<br />
submitted.<br />
QNCC review is<br />
planned for Nov<br />
<strong>2012</strong>.<br />
Type 3 (Desirable): These are standards that<br />
an excellent team should meet or standards<br />
that are not the direct responsibility of the team.<br />
COO<br />
NA
Commissioning for Quality and Innovations (CQUIN) continued …<br />
Category<br />
HoB 7<br />
WMSCT -<br />
C1<br />
Performance<br />
Indicator<br />
Antimicrobial<br />
Stewardship<br />
(Weighting = 16%.<br />
Value = £284,939)<br />
Performance Target<br />
M2 Audit report with evidence of selfassessment<br />
score and action plan. Arrange a<br />
peer review with BSOL Associate Director<br />
M6 Audit report with evidence of selfassessment<br />
score. Arrange a peer review with<br />
BSOL Associate Director.<br />
M12 Audit report with supporting evidence of<br />
self-assessment score. As part of this scheme<br />
arrange a peer review with BSOL Associate<br />
Director<br />
West Midlands Specialised Commissioning Team<br />
WMSCT -<br />
C2<br />
Safety<br />
Thermometer<br />
(Weighting = 5%.<br />
Value = £84,228)<br />
Clinical<br />
Dashboard. To<br />
implement the<br />
routine use of<br />
specialised<br />
services<br />
clinical<br />
dashboards<br />
(Weighting = 10%,<br />
Value = £168,456)<br />
Complete record of safety thermometer survey<br />
data every quarter reported directly to the NHS<br />
Information Centre.<br />
Q1 1. Identify dashboards lead & dashboard<br />
lead in each clinical area<br />
2.Summary of plans for implementation of the<br />
dashboards within timescale<br />
Q2 1.Routine reporting against quality<br />
dashboard requirements for all relevant<br />
services<br />
2. Brief update for each clinical area<br />
Lead<br />
Chief<br />
Officer<br />
COO<br />
COO<br />
COO<br />
R A G Apr-12 May-12 Jun-12 Quarter<br />
to Date<br />
YTD<br />
Last year<br />
position<br />
NA<br />
NA<br />
NA<br />
Comments<br />
Report - 30/05/<strong>2012</strong><br />
Current score = 2<br />
Report - 30/09/<strong>2012</strong><br />
Payment is subject to<br />
achieving a score of at<br />
least 40.<br />
Report - 31/03/<strong>2012</strong><br />
Payment is subject to<br />
achieving a score of at<br />
least 65.<br />
CNO NA See HoB 1 for data.<br />
CMO<br />
CMO<br />
Q3 1.Brief update for each clinical area . CMO NA<br />
Q4 1. Evidence that all relevant dashboards<br />
have been considered by front line clinical staff<br />
with evidence of consideration of current<br />
performance and identification of plans for<br />
improvement, where appropriate.<br />
CMO<br />
NA<br />
NA<br />
NA<br />
Q1 report produced<br />
and submitted.
Commissioning for Quality and Innovations (CQUIN) continued …<br />
Category<br />
Performance Performance Target<br />
Indicator<br />
West Midlands Specialised Commissioning Team<br />
WMSCT -<br />
C3<br />
Minimise the<br />
number of<br />
patients<br />
accidently<br />
extubated<br />
(Weighting = 10%,<br />
Value = £168,456)<br />
90% of patients who were accidently extubated<br />
to have their cases reviewed and reported on<br />
West Midlands Specialised Commissioning Team<br />
Lead<br />
Chief<br />
Officer<br />
COO<br />
R A G Apr-12 May-12 Jun-12 Quarter<br />
to Date<br />
YTD<br />
Last year<br />
position<br />
NA<br />
Comments<br />
Q1 report produced<br />
and submitted.<br />
WMSCT -<br />
C4<br />
CAMHS T4 -<br />
Education,<br />
training and<br />
meaningful<br />
activity requires<br />
Providers to<br />
develop<br />
strategies to<br />
respond to the<br />
variety of age<br />
groups treated<br />
in Specialised<br />
Services<br />
specifically in<br />
respect of<br />
education,<br />
training and<br />
meaningful<br />
activity<br />
(Weighting = 5%,<br />
Value = £84,228)<br />
Q1 1. Consult Service Users as a group about<br />
their wishes and feelings about educational and<br />
other daytime activities.<br />
Q2 1. report describing contacts and<br />
negotiations with providers of educational,<br />
training and therapeutic services (both internal<br />
and external as appropriate) to address the<br />
need to provide (or enable access to)<br />
comprehensive age appropriate provision.<br />
COO<br />
COO<br />
Q3 1. Overall strategy document which<br />
addresses the arrangement of this provision COO NA<br />
Q4 1. Internal audit of percentage of Service<br />
Users who have accessed in excess of twenty<br />
hours [for local determination] educational,<br />
training or defined meaningful activity during<br />
each week of Quarter 4.<br />
COO<br />
NA<br />
NA<br />
NA<br />
Q1 report produced<br />
and submitted.<br />
Narrative report of<br />
no more than 500<br />
words<br />
To detail milestone<br />
and timelines in<br />
year and includes<br />
sample individual<br />
timetables.<br />
Target percentage<br />
to be locally<br />
determined.
Commissioning for Quality and Innovations (CQUIN) continued …<br />
Category<br />
Performance Performance Target<br />
Indicator<br />
West Midlands Specialised Commissioning Team<br />
Q1 Narrative report detailing current practices,<br />
discussion with Human Resource advisors &<br />
results of a minimum of two group meetings<br />
with service users<br />
WMSCT -<br />
C5<br />
WMSCT -<br />
C6<br />
CAMHS T4<br />
Patient<br />
Involvement in<br />
Recruitment<br />
(Weighting = 5%.<br />
Value = £84,228<br />
CAMHS T4<br />
Feasibility<br />
study -<br />
conversion of<br />
bedroom<br />
facilities to<br />
single room<br />
accommodation<br />
for adolescent<br />
wards<br />
(Weighting = 5%,<br />
Value = £84,228)<br />
Q2 Narrative that details the date and content<br />
of discussion at the unit‟s Clinical Governance<br />
forum about the development of a strategy to<br />
enable patient involvement, and plans for the<br />
training of patients in this role.<br />
Q3 Details of the number of patients who have<br />
engaged in the training by end of Q3.<br />
Qualitative report on their reaction to the<br />
Lead<br />
Chief<br />
Officer<br />
COO<br />
COO<br />
COO<br />
R A G Apr-12 May-12 Jun-12 Quarter<br />
to Date<br />
YTD<br />
Last year<br />
position<br />
Q4 Number of recruitment processes which<br />
featured patient involvement during Q3 and Q4. COO NA<br />
Q1 Completion of consultation exercise & a<br />
series of visits to other Tier 4 units. COO NA<br />
Q2 Consultations with other stakeholders to<br />
include CQC, QNIC, estates departments and<br />
planning authorities<br />
Q3 options paper to be considered at board<br />
level<br />
• Produce an options paper to be considered at<br />
board level by the Trust<br />
Q4 Report in the form of a feasibility study,<br />
options appraisal or business case to include<br />
the results on consideration at board level<br />
COO<br />
COO<br />
COO<br />
NA<br />
NA<br />
NA<br />
NA<br />
NA<br />
NA<br />
Comments<br />
Q1 report produced<br />
and submitted.<br />
Provide a copy of a<br />
Strategy and<br />
associated training<br />
material to be used.<br />
Narrative report of<br />
max 500 words<br />
Q1 report produced<br />
and submitted.<br />
Confirmation of the<br />
completion of the paper<br />
and its consideration at<br />
<strong>Board</strong> to be provided
Commissioning for Quality and Innovations (CQUIN) continued …<br />
Category<br />
Performance Performance Target<br />
Indicator<br />
West Midlands Specialised Commissioning Team<br />
WMSCT -<br />
C7<br />
Safety<br />
Thermometer -<br />
Paediatric<br />
Specific<br />
(Weighting = 5%<br />
Value = £84,228)<br />
Q1 report the proposed Paediatric specific<br />
outcomes, rationale for inclusion and adapted<br />
NHS Safety Thermometer Tool.<br />
Q2 report on the pilot implementation and from<br />
the lessons learnt, a revised set of metrics<br />
Q3 Provide a report detailing surveyed<br />
outcomes for all months in quarter<br />
Q4 Provide a report detailing surveyed<br />
outcomes for all months in quarter.<br />
Lead<br />
Chief<br />
Officer<br />
CNO<br />
CNO<br />
CNO<br />
CNO<br />
R A G Apr-12 May-12 Jun-12 Quarter<br />
to Date<br />
YTD<br />
Last year<br />
position<br />
NA<br />
NA<br />
NA<br />
NA<br />
Comments<br />
Q1 report produced<br />
and submitted.
Local Targets - Safety, Governance and Patient Experience<br />
Safety<br />
Category Performance Indicator Performance Target Lead R A G Apr-12 May-12 Jun-12 YTD<br />
Infection control<br />
National target<br />
Clostridium difficile<br />
infections<br />
1 cases in the<br />
financial year<br />
Last year<br />
position<br />
CNO >1 - 1 0 1 0 1 1<br />
Comments<br />
One case<br />
diagnosed in<br />
Coventry hospital<br />
within 24 h of<br />
discharge from<br />
BCH<br />
National target MRSA Bacteraemia 0 case per year CNO >0 - 0 0 0 0 0 0<br />
MSSA (Meticillin Pre 48 hours CNO T B A 1 2 0 3 16 June 2011 - 9<br />
National target Sensitive<br />
Post 48 hours (10%<br />
Staphylococcus Aureus) reduction)<br />
CNO 1 4 1 6 11 June 2011 - 2<br />
National target E-Coli<br />
Pre 48 hours CNO 0 1 0 0 5 June 2011 - 3<br />
Post 48 hours CNO T B A 2 0 0 2 13 June 2011 - 4<br />
Internal target Hand hygiene<br />
95% compliance with<br />
hand hygiene policy<br />
CNO 1 - 0 0 0 0 0 3<br />
Internal target<br />
Internal target<br />
National target<br />
All MRSA<br />
Patient to Patient<br />
Transmitted MRSA<br />
PICU<br />
National target Ward 11<br />
National target Ward 12<br />
Trend analysis CNO 8 13 13 21 101<br />
MRSA Admission<br />
Screening<br />
CNO 2 5 5 7 39<br />
New Isolates CNO 3 3 1 6 24<br />
Previous Isolates CNO 3 5 7 8 32<br />
0 cases per year CNO >0 - 0 0 0 0 0 0<br />
100% all admissions<br />
are screened<br />
100% all admissions<br />
are screened<br />
100% all admissions<br />
are screened<br />
CNO
Local Targets - Safety, Governance and Patient Experience continued …<br />
Category Performance Indicator Performance Target Lead R A G Apr-12 May-12 Jun-12 YTD<br />
Net App<br />
Local target<br />
Local target<br />
Total number of<br />
inpatients in period<br />
Total number of<br />
responses in period<br />
Number of<br />
discharges within the<br />
period<br />
Number of responses<br />
in period<br />
Last year<br />
position<br />
CNO 1018 1063 1272 2081 NA<br />
CNO 124 111 143 254 NA<br />
Local target Number of Promoters CNO 74 75 118 193 NA<br />
Local target Number of Passives CNO 41 31 23 54 NA<br />
Local target Number of Detractors CNO 9 5 2 16 NA<br />
Local target Overall Score CNO 52.4 63 81.1 NA<br />
Local target Average SHA Score CNO 52 62 NA<br />
Safety Thermometer<br />
Percentage of Patients<br />
Local Target<br />
with Harm free Care<br />
% CNO 99.0 98.3 97.2 NA<br />
Local Target Sample Size Number CNO 302 287 287 NA<br />
Local Target Pressure Ulcers CNO 0.99 1.74 2.44 NA<br />
Local Target Catheters & UTIs CNO 0 0 0.35 NA<br />
Local Target VTEs CNO 0 0 0 NA<br />
Local Target Falls CNO 0 0 0 NA<br />
Comments<br />
SHA upper<br />
quartile is 71
Local Targets - Safety, Governance and Patient Experience continued …<br />
Category Performance Indicator Performance Target Lead R A G Apr-12 May-12 Jun-12 YTD<br />
Risk register<br />
Last year<br />
position<br />
Comments<br />
Internal target<br />
Population of the risk<br />
register<br />
Risks greater than or<br />
equal to 16 have an<br />
action plan recorded<br />
on the risk register<br />
(%)<br />
CMO
Local Targets - Safety, Governance and Patient Experience continued …<br />
Category Performance Indicator Performance Target Lead R A G Apr-12 May-12 Jun-12 YTD<br />
SIRIs continued..<br />
Families are informed of<br />
Internal target the outcomes of SIRIs<br />
Internal target<br />
Families are informed of<br />
incidents that have been<br />
declared SIRIs<br />
within 28 days of the<br />
ratification of the final<br />
SIRI report<br />
within 7 days of the<br />
declaration<br />
Last year<br />
position<br />
CMO 100 100 100 100<br />
CMO 100 NA 0 95.8<br />
Comments<br />
Due to language<br />
issues with the<br />
family we have<br />
not yet informed<br />
them that there<br />
will be a SIRI<br />
investigation. A<br />
plan to inform<br />
them is being<br />
agreed.<br />
Internal target<br />
Completion of SUI<br />
actions<br />
Actions arising are<br />
completed within<br />
specified timeframe (%)<br />
CMO
Local Targets - Safety, Governance and Patient Experience continued …<br />
Category Performance Indicator Performance Target Lead R A G Apr-12 May-12 Jun-12 YTD<br />
Internal BCH<br />
target<br />
Escalation of serious<br />
incidents<br />
All red graded Serious<br />
Incidents escalated<br />
within 24 hours of<br />
becoming aware of the<br />
incident (%)<br />
Last year<br />
position<br />
CMO
Local Targets - Safety, Governance and Patient Experience continued…<br />
Category Performance Indicator Performance Target Lead R A G Apr-12 May-12 Jun-12 YTD<br />
Complaints<br />
Internal target Number of complaints CMO 7 1 8 16 111<br />
National target<br />
Internal target<br />
Internal target<br />
Internal target<br />
Timeliness of response<br />
Number of health<br />
service referrals to<br />
Ombudsmen<br />
Number of complaints<br />
requesting additional<br />
information after CEO<br />
response<br />
Manager contact with<br />
complainant<br />
100% within 25 days or<br />
negotiated timescale<br />
with the family<br />
Trend analysis<br />
Trend analysis<br />
When applicable, all<br />
relevant managers to<br />
make contact the<br />
complainant (%)<br />
Last year<br />
position<br />
CMO 90 95 100 100 100 100 100 100<br />
1 0 1 1 2<br />
0 0 0 0 0<br />
CMO 10 10 5 2 1 6 3 36<br />
formal complaints<br />
FOI<br />
Internal target Number of FOI's Trend analysis CMO TREND 18 28 19 65 273<br />
Number of FOIs<br />
National target responded to within 20<br />
working days<br />
100% CMO
Local Targets - Safety, Governance and Patient Experience continued…<br />
Category Performance Indicator Performance Target Lead R A G Apr-12 May-12 Jun-12 YTD<br />
Patient access<br />
Internal target<br />
Internal target<br />
Local<br />
commissioner<br />
target<br />
Local<br />
commissioner<br />
target<br />
Local<br />
commissioner<br />
target<br />
Call centre<br />
Convenience and<br />
choice (provider<br />
information on nhs.uk<br />
and availability of slots)<br />
90% all calls to be<br />
answered within 1<br />
minute<br />
80% all calls to be<br />
answered within 30<br />
seconds<br />
Last year<br />
position<br />
COO
Local Targets - Safety, Governance and Patient Experience continued…<br />
Nursing Indicators<br />
Category Performance Indicator Performance Target<br />
Clinical Support Services<br />
Lead<br />
Chief<br />
R A G Apr-12 May-12 Jun-12 YTD<br />
Internal target MDC >95% CNO 95 100 100<br />
Internal target SDC >95% CNO 95 97 99<br />
Internal target Directorate overall >95% CNO 95 99 99<br />
Medical Directorate<br />
Internal target MHDU >95% CNO 95 97 90<br />
Internal target Ward 15 >95% CNO 95 96 86<br />
Internal target Ward 2 >95% CNO 95 93<br />
Internal target Ward 6 >95% CNO 95 92<br />
Internal target Ward 7 >95% CNO 95 94 96<br />
Internal target Haemaglobinopathy >95% CNO 95 98 96<br />
Internal target ODC >95% CNO 95 100 92<br />
Internal target Ward 15 HDU >95% CNO 95 97 90<br />
Internal target Ward 15 TCT >95% CNO 95 99 90<br />
Internal target WTCRF >95% CNO 95 99 99<br />
Internal target Directorate overall >95% CNO 95 94 91<br />
Specialised Services<br />
Internal target PICU >95% CNO 95 94 95<br />
Internal target Recovery >95% CNO 95 97 84<br />
Internal target Ward 11 >95% CNO 95 96 92<br />
Internal target Ward 12 >95% CNO 95 88 92<br />
Internal target Ward 8 >95% CNO 95 95 95<br />
Internal target Directorate overall >95% CNO 95 94 92<br />
Surgical Directorate<br />
Last year<br />
position<br />
Internal target Burns >95% CNO 95 99 96<br />
Internal target Haemodialysis >95% CNO 95 100 100<br />
Internal target Ward 1 >95% CNO 95 99 99<br />
Internal target Ward 10 >95% CNO 95 99 92<br />
Internal target Ward 5 >95% CNO 95 92 92<br />
Internal target Ward 9 >95% CNO 95 90 93<br />
Internal target NSW >95% CNO 95 95 96<br />
Internal target Directorate overall >95% CNO 95 96 95<br />
BCH<br />
Internal target BCH overall >95% CNO 95 95 92<br />
Comments<br />
Reported<br />
Quarterly<br />
Reported<br />
Quarterly<br />
Reported<br />
Quarterly<br />
Reported<br />
Quarterly<br />
Reported<br />
Quarterly
Data Quality<br />
Performance Indicator Contracting SUS DQ IG<br />
Toolkit<br />
OVERALL RATING<br />
Good<br />
Practice<br />
To Reach<br />
Green<br />
Apr-12 May-12 Jun-12<br />
YTD<br />
Last<br />
Year<br />
Data Quality Rating x x x x Combines below metrics<br />
Admitted Patient Care<br />
Administrative Category x x<br />
Admission Method<br />
Birth Date x 99% 100 100 100<br />
Critical Care Discharge<br />
x x<br />
Date<br />
99% 100 100 100<br />
Critical Care Start Date<br />
Decision to admit Date<br />
x<br />
x<br />
x<br />
x<br />
99%<br />
99%<br />
100<br />
NA<br />
100<br />
91.5<br />
100<br />
93.8<br />
Discharge Date<br />
99%<br />
x x 99%<br />
Commissioner x x 99%<br />
Consultant Code x x 99%<br />
x<br />
x<br />
99%<br />
100<br />
100<br />
98.7<br />
100<br />
100<br />
100<br />
100<br />
98.8<br />
100<br />
100<br />
100<br />
100<br />
98.7<br />
100<br />
100<br />
100<br />
100<br />
100<br />
98.7<br />
100<br />
100<br />
100<br />
93.8<br />
100<br />
100<br />
100<br />
100<br />
98.7<br />
100<br />
100<br />
100<br />
92.9<br />
100<br />
Valid Code required; denotes<br />
Private/NHS mapped prior to external<br />
Valid Admission Method; mapped prior<br />
to external submission<br />
Patients with valid DOB<br />
Valid Commissioner Code<br />
Valid Consultant Code check against<br />
National ODS File<br />
>= Episode Start date and
Data Quality continued…<br />
Performance Indicator Contracting SUS DQ IG<br />
Toolkit<br />
Good<br />
Practice<br />
To Reach<br />
Green<br />
Apr-12 May-12 Jun-12 YTD Last<br />
Year<br />
Admitted Patient Care continued<br />
Intended Management<br />
x x 98% 99.3 99.6 99.5% 99.5% 99.6<br />
IPM record creation date<br />
>1 after admission date<br />
IPM record creation date<br />
>1 after discharge date<br />
Last Episode<br />
NHS Number (present) x x<br />
x<br />
x<br />
95% NA 92.4 92.5% 92.5% 92.6<br />
Operation Status x x 99% 100 100 100 100 100 Code identifies whether procedure<br />
Patient Classification x x 98% 100 100 100 100 100 Valid<br />
performed<br />
patient<br />
during<br />
classification<br />
episode<br />
PCT of Residence x 99% 99.5 99.6 99.5 99.5 99.2 Valid PCT Code<br />
Postcode<br />
x x Not NULL or invalid postcode (check<br />
100% 99.5 99.6 99.5 99.5 99.2<br />
against ODS file)<br />
Primary Diagnosis<br />
x x 99% 100 100 100 100 100 National file ICD10<br />
Sex x x 99% 100 100 100 100 100<br />
x<br />
x<br />
95%<br />
Primary Procedure x 99%<br />
Primary Procedure Date<br />
Site of Treatment<br />
x x 99%<br />
x 99%<br />
x 92%<br />
Source of Admission x x 99%<br />
Spell Start Date x 99%<br />
Trace Status on x x x 98%<br />
Treatment Function x x 99%<br />
Elective Waiting List<br />
Administrative Category x x 100%<br />
Birth Date x x<br />
Consultant Code x x<br />
x<br />
NA<br />
100<br />
98% 97.9<br />
99%<br />
99%<br />
100<br />
99.1<br />
100<br />
100<br />
100<br />
99.9<br />
100<br />
100<br />
100<br />
100<br />
60.7<br />
100<br />
98.5<br />
100<br />
98.0<br />
100<br />
100<br />
100<br />
99.8<br />
100<br />
100<br />
100<br />
100<br />
61.8% 61.8% 61.5<br />
100<br />
98.3<br />
98.3<br />
100<br />
100<br />
100<br />
99.9<br />
100<br />
100<br />
100<br />
100<br />
100<br />
98.3<br />
100 100<br />
98.3<br />
100<br />
100<br />
100<br />
99.9<br />
100<br />
100<br />
100<br />
100<br />
100<br />
98.1<br />
100<br />
97.2<br />
0<br />
100<br />
100<br />
100<br />
100<br />
100<br />
100<br />
100<br />
Patients with specified Intended<br />
Management Code<br />
Percentage of records entered same<br />
day as event<br />
Percentage of records entered same<br />
day as event<br />
Correct Last Episode number<br />
Valid NHS number for all inpatient<br />
admissions<br />
National file OPCS<br />
Date >= Episode StartDate,
Data Quality continued…<br />
Performance Indicator Contracting SUS DQ IG<br />
Toolkit<br />
Elective Waiting List continued..<br />
Count of Days<br />
x x<br />
Suspended<br />
Decided to Admit Date x x<br />
GP Practice x x<br />
Sex<br />
Trace Status on elective<br />
WL Suspensions with<br />
no comments<br />
Emergency Department<br />
Good<br />
Practice<br />
To Reach<br />
Green<br />
100%<br />
100%<br />
Intended Management x x 100%<br />
Intended Procedure<br />
98%<br />
NHS Number (present)<br />
x 98%<br />
Planned, no TCI date or<br />
x<br />
Admit by Date<br />
Original Decided to<br />
x x<br />
Admit Date<br />
100%<br />
90%<br />
Postcode x x 100%<br />
Attendance Disposal<br />
x<br />
Apr-12 May-12 Jun-12 YTD Last<br />
Year<br />
99.3<br />
x x 99% 100 100 100 100 100<br />
x x x 98% 99.8 99.9 99.9 99.9 99.8<br />
x<br />
99% 100 99.1 97.4% 97.4% 99.7<br />
x<br />
x<br />
99%<br />
99%<br />
Commissioner x x 99%<br />
100<br />
100<br />
97.1<br />
98.3<br />
100<br />
100<br />
100<br />
96.9<br />
98.3<br />
99.1<br />
98.6<br />
48.1<br />
100<br />
100<br />
98.5%<br />
41.2<br />
100<br />
100<br />
97.0<br />
98.5<br />
41.2<br />
100<br />
100<br />
97.3<br />
98.1<br />
99.3<br />
98.7 98.6 98.5 98.5 98.6<br />
100<br />
80.3<br />
99.6<br />
100<br />
97.0<br />
98.5<br />
99.0<br />
100<br />
79.8%<br />
99.6<br />
99.0<br />
79.8%<br />
99.6<br />
100<br />
37.3<br />
Patients with positive integer (Days<br />
suspended)<br />
Patients with valid Decision to Admit<br />
Date<br />
Valid GP Code check against National<br />
ODS File, nulls mapped to unknown<br />
Patients with specified Intended<br />
Management Code<br />
Patients with valid intended procedure<br />
code<br />
Valid NHS number for all waiting list<br />
patients<br />
Patients with valid Original Decided to<br />
Admit Date<br />
Planned patients with no TCI or Admit<br />
by Date<br />
Good practice<br />
Valid Commissioner Code<br />
Departure Time x 99% 100 100 100 100 100 Valid departure time for all ED records<br />
ED Activity 'treatment<br />
complete' with no coding<br />
ED Activity with no<br />
telephone numbers<br />
ED IPM record modified<br />
after arrival date<br />
x<br />
99%<br />
80%<br />
99%<br />
80.5<br />
99.7<br />
100<br />
99.8<br />
100<br />
98.8<br />
27.6<br />
100<br />
99.9<br />
100<br />
100<br />
99.8<br />
100<br />
99.8<br />
100<br />
98.5%<br />
100<br />
86.4<br />
99.7<br />
100<br />
99.9<br />
100<br />
98.6<br />
Not NULL or invalid postcode (check<br />
against ODS file)<br />
Valid Gender Code<br />
Patients with NHS number trace<br />
Data Dictionary codes for ED<br />
attendance disposal<br />
All patients treated should have<br />
treatment code<br />
Safeguarding issue, all should have<br />
telephone number<br />
Data entered same day as event
Data Quality continued…<br />
Performance Indicator Contracting SUS DQ IG<br />
Toolkit<br />
Good<br />
Practice<br />
To Reach<br />
Green<br />
Emergency Department continued..<br />
First Investigation<br />
x 99%<br />
x x x 99%<br />
Attended or Did Not x x x 99%<br />
Birth Date<br />
x x 99%<br />
Apr-12 May-12 Jun-12 YTD Last<br />
Year<br />
All records should have first<br />
100 100 100 100 100<br />
investigation where appropriate<br />
First Treatment x All records should have first treatment<br />
99% 100 100 100 100 100 where appropriate<br />
Patient Group x 99%<br />
PCT of Residence<br />
x<br />
99%<br />
Postcode x 99%<br />
Trace status on ED<br />
arrivals<br />
Referral/Outpatient<br />
Administrative Category<br />
Attendance Date<br />
Commissioner<br />
Consultant Code<br />
x x x Valid Consultant Code check against<br />
99% 100 100 100 100 100<br />
National ODS File<br />
Ethnic Category<br />
First Attendance<br />
x<br />
x x<br />
99%<br />
99%<br />
94.2<br />
100<br />
95.5<br />
100<br />
96.3<br />
100<br />
96.3<br />
100<br />
92.3<br />
100<br />
Valid ethnic group code, unknown<br />
invalid Specified First Attendance<br />
GP Practice<br />
x<br />
x<br />
x<br />
x<br />
x<br />
99%<br />
99%<br />
99%<br />
99%<br />
100<br />
99.4<br />
99.5<br />
99.8<br />
99.9<br />
99.9<br />
99.6<br />
100<br />
99.3<br />
98.5<br />
100<br />
99.1<br />
99.4<br />
99.7<br />
99.9<br />
100<br />
99.6<br />
100<br />
99.2<br />
98.4<br />
100<br />
99.3%<br />
99.6%<br />
99.8%<br />
100<br />
100<br />
98.9<br />
100<br />
99.3<br />
98.7<br />
100<br />
99.3%<br />
99.6%<br />
99.8%<br />
100<br />
100<br />
98.9<br />
100<br />
99.3<br />
98.7<br />
100<br />
99.5<br />
99.6<br />
99.8<br />
99.9<br />
100<br />
99.5<br />
100<br />
99.3<br />
98.5<br />
Valid PCT Code<br />
Not NULL or invalid postcode (check<br />
against ODS file)<br />
Patients with NHS number trace<br />
Valid Code required; denotes<br />
Private/NHS mapped prior to external<br />
submission<br />
All attended outpatient appointments<br />
Missing data mapped for external<br />
Patients submission with valid DOB<br />
Valid Commissioner Code<br />
Valid GP Code check against National<br />
ODS File, nulls mapped to unknown<br />
NHS number (present)<br />
on attended<br />
Operation Status<br />
x<br />
x<br />
x<br />
98% 99.0 99.3 99.5 99.5<br />
% 100 100 100 100<br />
99.0<br />
100<br />
Valid NHS number for all outpatient<br />
appointments<br />
Code identifies whether procedure<br />
performed during episode.<br />
Outcome of Attendence x x x 99% 96.3 90.5 87.2 87.2 91.8 Not specified code monitored internally<br />
Patients undeparted<br />
x<br />
Arrival time present but not departed<br />
where patient attended<br />
99% 96.5 89.9 87.1 87.1 91.5<br />
monitored internally<br />
on time
Data Quality continued…<br />
Performance Indicator Contracting SUS DQ IG<br />
Toolkit<br />
Good<br />
Practice<br />
To Reach<br />
Green<br />
Apr-12 May-12 Jun-12 YTD Last<br />
year<br />
Referral/Outpatient continued …<br />
position<br />
PCT of Residence x 99% 99.7 99.7 99.6 99.6 99.6 Valid PCT Code<br />
Postcode x x 100%<br />
Primary Procedure<br />
Priority Type<br />
Source of Referral for<br />
Outpatients<br />
Trace Status on<br />
Outpatients<br />
Treatment Function<br />
Code<br />
Registration<br />
Duplicate Registrations<br />
90%<br />
Referral Date x x 99%<br />
Sex x x 99%<br />
x<br />
x<br />
x<br />
x<br />
80%<br />
99%<br />
99.7<br />
100<br />
80.8<br />
99.7<br />
100<br />
99.3<br />
x x 98% 99.9 99.9 99.7 99.7 99.9 Patients with NHS number trace<br />
x x 99%<br />
99%<br />
99.7<br />
100<br />
79.9<br />
99.6<br />
100<br />
99.2<br />
99.1<br />
100<br />
99.1<br />
99.9<br />
99.6<br />
100<br />
80.7<br />
99.6<br />
100<br />
99.5<br />
99.3<br />
99.9<br />
99.6<br />
100<br />
80.7<br />
99.6<br />
100<br />
99.5<br />
99.3<br />
99.9<br />
99.6<br />
100<br />
79.6<br />
99.7<br />
100<br />
99.4<br />
99.2<br />
99.9<br />
Not NULL or invalid postcode (check<br />
against ODS file)<br />
National file OPCS<br />
Missing data mapped for external<br />
submission<br />
Patients with no Referral Date, or with<br />
invalid date<br />
Valid Gender Code<br />
Missing data mapped for external<br />
submission<br />
National file of Treatment Function<br />
Codes<br />
Duplicates against total registrations
Local Targets - Workforce<br />
Category Performance Indicator Performance Target<br />
Internal<br />
target<br />
Internal<br />
target<br />
Internal<br />
target<br />
All Staff to have an up to<br />
date PDR<br />
Lead Chief<br />
Officer<br />
R A G Apr-12 May-12 Jun-12 YTD<br />
Last year<br />
position<br />
3
Local Targets - Education<br />
Category Performance Indicator Performance Target<br />
Induction training<br />
Internal<br />
BCH target<br />
Corporate induction received<br />
by new staff<br />
Internal Local induction received by<br />
BCH target new staff<br />
Mandatory training<br />
Internal<br />
BCH target<br />
Conflict resolution<br />
Internal Information Governance<br />
BCH target training<br />
Internal<br />
BCH target<br />
Health and Safety Training<br />
Internal<br />
BCH target<br />
Fire training<br />
Internal<br />
BCH target<br />
Child Protection level 1<br />
Internal<br />
BCH target<br />
Moving and Handling training<br />
Internal<br />
BCH target<br />
Infection control<br />
100 % of staff who require it to have<br />
received training<br />
65% of staff who require it to have<br />
received training<br />
65% of staff who require it to have<br />
received training<br />
65% of staff who require it to have<br />
received training<br />
65% of staff who require it to have<br />
received training<br />
85% of staff who require it to have<br />
received training<br />
85% of staff who require it to have<br />
received training<br />
65% of staff who require it to have<br />
received theory training<br />
65% of staff who require it to have<br />
received training<br />
Lead<br />
Chief<br />
Office<br />
R A G April 12 May 12 June 12<br />
Last year<br />
position<br />
CWD
Local Targets - Efficiency and Operations<br />
Category Performance Indicator<br />
18 weeks<br />
Performance Target<br />
Lead<br />
Chief<br />
Officer<br />
R A G Apr-12 May-12 Jun-12 YTD<br />
Last year<br />
position<br />
Internal Mean treatment times COO 10.4 10.6 11.1 10.2<br />
Internal Admitted<br />
Median treatment times COO 10.5 11.2 12.4 10.9<br />
Internal 95th percentile treatment times COO >23 18.3 92<br />
%<br />
COO 132 99<br />
Local Targets - Efficiency and Operations continued …<br />
Stages of treatment - Internal targets<br />
Local Inpatient 26 week wait 100% at the end of each month COO 5.6 6 4.6 3.6 3.1 3 3.4 3.7 Non-elective & emergencies.<br />
Internal<br />
target<br />
Inpatient length of stay<br />
Current Inpatients over 7 days COO Trend<br />
NA<br />
Current Inpatients over 30<br />
days<br />
Current Inpatients over 60<br />
days<br />
Current Inpatients over 90<br />
days<br />
COO<br />
COO<br />
COO<br />
Trend<br />
Trend<br />
Trend<br />
NA<br />
NA<br />
NA<br />
Internal<br />
target<br />
Pre-operative bed days<br />
70% elective patients operated<br />
on day of admission.<br />
COO
<strong>Board</strong> of Directors<br />
Public <strong>Meeting</strong><br />
31 <strong>July</strong> <strong>2012</strong><br />
Item 12.135 Enc 5<br />
n/a<br />
Strategic Objective/ Enabler<br />
Report Title<br />
Sponsoring Director<br />
Author(s)<br />
Previously considered by<br />
Report on the Use of the Trust Seal<br />
n/a<br />
Gwenny Scott, Company Secretary<br />
n/a<br />
Situation<br />
The Trust’s Standing Orders require that the use of the seal is authorised by the <strong>Board</strong> of Directors and<br />
entered in the Register of Sealings. The seal is used to execute deeds (e.g. conveyances of land) or where it may<br />
be required by law.<br />
The Company Secretary is Custodian of the Trust Seal.<br />
The seal was used on the following documents:<br />
Lease of premises at Unit 7 Rowchester Court.<br />
Background<br />
Assessment<br />
The lease of Unit 7 Rowchester Court is a renewal of the lease for 10 years with a five year break clause. The<br />
premises provide office accommodation for the Finance department.<br />
The <strong>Board</strong> is asked to endorse the use of the Trust seal.<br />
Recommendations
<strong>Board</strong> of Directors<br />
Public <strong>Meeting</strong><br />
<strong>2012</strong><br />
Item 12.136 Enc 6<br />
Strategic Objective/ Enabler n/a<br />
Report Title<br />
Sponsoring Director<br />
Author(s)<br />
Previously considered by<br />
<strong>Hospital</strong>ity Register Review<br />
David Melbourne, Chief Finance Officer<br />
Gwenny Scott, Company Secretary<br />
n/a<br />
Situation<br />
In accordance with Trust policy and Standing Financial Instructions and with the Department of<br />
Health’s Standards of Business Conduct, the <strong>Hospital</strong>ity Register is presented for review.<br />
Background<br />
The Department of Health’s Standards of Business Conduct for NHS Staff provides that NHS staff<br />
must ensure that decisions are not improperly influenced by gifts or inducements. The Trust’s policy<br />
and Standing Financial Instructions therefore require any gift or hospitality of a value of £25 or<br />
above to be registered in the Trust’s <strong>Hospital</strong>ity Register, which must be maintained by the Director<br />
of Finance.<br />
Assessment<br />
The entries made in the <strong>Hospital</strong>ity Register since December 2011 are set out in the attached<br />
appendix.<br />
The majority of the entries relate to fees and expenses for staff attendance at conferences paid<br />
by private companies. There are also a number of entries relating to donations by companies to<br />
the KIDS service.<br />
There is no indication of any improper influence resulting from these gifts, donations and<br />
hospitality.<br />
Recommendations<br />
The <strong>Board</strong> is asked to review the contents of the <strong>Hospital</strong>ity Register.
Key Risks<br />
Risk Description Controls Assurances<br />
Failure to record gifts or<br />
donations on the <strong>Hospital</strong>ity<br />
Register may have a<br />
reputational impact.<br />
Regular review of the Register<br />
Bi-annual reports to <strong>Board</strong>.
Strategic Objectives<br />
CQC Registration (state<br />
outcome)<br />
NHS Constitution<br />
Other Compliance (e.g.<br />
NHSLA, Information<br />
Governance, Monitor)<br />
Equality, diversity & human<br />
rights<br />
Trust contracts<br />
None<br />
None<br />
None<br />
None<br />
None<br />
Potential<br />
Key Impacts
HOSPITALITY REGISTER <strong>2012</strong><br />
Date of Entry Name of Recipient Department <strong>Hospital</strong>ity Description Approx Value Date of Receipt Sponsor/Received From<br />
19 December 2011 Chris Kendriksz IMD<br />
Attendance at World <strong>Meeting</strong> in San Diego including<br />
registration and hotel<br />
$1200 Feb 12 Actelion UK<br />
19 December 2011 Chris Kendriksz IMD Neuro-paediatrics meeting in Portugal 900 Euros Jan 12 Actelion UK Portugal<br />
19 December 2011 Chris Kendriksz IMD NPC Forum in Greece 1000 Euros Mar 12 Actelion Global<br />
28 December 2011 Catherine Stewart Clinical Nurse Specialist Train fare to London to attend one day workshop £155 04 January <strong>2012</strong> Biomarin Drug Co<br />
06 February <strong>2012</strong> Dr Suresh Vijay IMD<br />
07 February <strong>2012</strong> Angela Horsburgh Deputy Perfusion Manager<br />
19 March <strong>2012</strong> Dr Saikat Santra Clinical IMD<br />
19 March <strong>2012</strong> Dr Saikat Santra Clinical IMD<br />
20 March <strong>2012</strong> David Melbourne CFO<br />
Attendance at World <strong>Meeting</strong> in San Diego including<br />
registration and hotel<br />
Attendance at symposium for ECMO & Advanced<br />
Therapies for Respiratory failure incl flights, course<br />
and accommodation<br />
Travelling expenses for home visits carried out in Jan<br />
12 for sponsored study on Cholesterol Ester Storage<br />
disease<br />
Training day in Amsterdam for Gaucher disease<br />
including flights, course and refreshments<br />
Box of Costa coffee goodies including coffee, muffins,<br />
flasks and a voucher<br />
£3,100 8-10 Feb 12 Genzyme Corporation<br />
Course $720<br />
Accom $1843<br />
Flights £721<br />
26 Feb 12 to 1 Mar<br />
12<br />
Chalice Medical<br />
£268 January <strong>2012</strong> Premier Research Group<br />
Approx £417 23 March <strong>2012</strong> Genzyme Ltd<br />
Approx £35 21 March <strong>2012</strong> Compass<br />
12 April <strong>2012</strong><br />
Cathy Griffiths<br />
Darren Redfern<br />
Glynis Kane<br />
Clare Murray<br />
Procurement<br />
Labs<br />
Labs<br />
Labs<br />
Visit to Roche facility including taxis, lunch, drinks and<br />
dinner<br />
£25 per person<br />
per head<br />
4/5 April <strong>2012</strong> Roche<br />
13 April <strong>2012</strong> Catherine Stewart Clinical Nurse Specialist Train and hotel £300 1/2 Mar <strong>2012</strong> Shire<br />
16 April <strong>2012</strong> Phil Wilson KIDS Intensive Care Donation towards the Paediatric Critical Care Forum £500 June <strong>2012</strong> Smiths Medical Ltd<br />
14 May <strong>2012</strong> Phil Wilson KIDS Intensive Care Donation towards Paediatric Forum £600 May <strong>2012</strong> Par Aid Limited<br />
17 May <strong>2012</strong> Phil Wilson KIDS Intensive Care Donation towards Paediatric Forum £250 May <strong>2012</strong> SP Services UK<br />
17 May <strong>2012</strong> Dr Chetan Mehta Cardiology<br />
Attending Association of European Paediatric<br />
Cardiologists meeting in Istanbul - flights, accomm and<br />
registration<br />
£1300 approx 23-26 May <strong>2012</strong> St Judes Medical<br />
24 May <strong>2012</strong> Colin Horwath NED Lunch with Deloitte £25 23 May <strong>2012</strong> Deloitte
28 May <strong>2012</strong> Phil Wilson KIDS Intensive Care Donation towards Paediatric Forum £500.00 May <strong>2012</strong> Timesco of London Ltd<br />
01 June <strong>2012</strong> Phil Wilson KIDS Intensive Care Donation towards Paediatric Forum £600 June 12 Ferno UK Ltd<br />
08 June <strong>2012</strong><br />
Rosy Rogers, Louise Kiely, Sarah<br />
Hart<br />
Nursing/Facilities<br />
Attendance at Hefma Annual Awards dinner in Telford<br />
@ £195 per person<br />
£195 pp 24 May <strong>2012</strong> Sodexho<br />
15 June <strong>2012</strong> Kate Parkes Radiology<br />
18 June 20912 Kate Hall<br />
West Midlands Newborn<br />
Screening Laboratory<br />
Attending UKRC exhibition in Manchester, inc meal<br />
and hotel.<br />
TBA 26-27 June <strong>2012</strong> Agfa<br />
Flights to Finland and return (conference): £697.64;<br />
Accommodation for 4 nights, transport and £1,348 01 June <strong>2012</strong> Perkin Elmer<br />
subsistence, estimated at £650.<br />
22 June <strong>2012</strong> Phil Wilson KIDS Intensive Care Donation towards Paediatric Forum £250 01 June <strong>2012</strong> Elgin Medical<br />
04 <strong>July</strong> <strong>2012</strong><br />
04 <strong>July</strong> <strong>2012</strong><br />
Dr Suresh Vijay, Dr Anupam<br />
Chakrapani, Louise Simmons and<br />
Catherine Stewart<br />
Dr Suresh Vijay, Dr Anupam<br />
Chakrapani, Louise Simmons and<br />
Catherine Stewart<br />
IMD Flights to Amsterdam for conference (£170 each) £680 30 June <strong>2012</strong> SHIRE<br />
IMD<br />
19 <strong>July</strong> <strong>2012</strong> Michelle Bignall Clinical Chemistry<br />
Hotel and registration for Amsterdam conference<br />
(£500 each)<br />
Travel and accommodation for educational seminar in<br />
Perth, Scotland<br />
£2,000 30 June <strong>2012</strong> BioMarin<br />
£543 08 September <strong>2012</strong> Randox Laboratories Ltd