Schweiger_ NUMGE_2002.pdf - Plaxis
Schweiger_ NUMGE_2002.pdf - Plaxis
Schweiger_ NUMGE_2002.pdf - Plaxis

You also want an ePaper? Increase the reach of your titles
YUMPU automatically turns print PDFs into web optimized ePapers that Google loves.
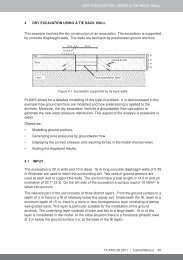
distance from tunnel axis [m]<br />
0 10 20 30 40 50 60 70 80 90 100<br />
0<br />
-5<br />
horizontal displacements [mm]<br />
-10<br />
-15<br />
-20<br />
-25<br />
-30<br />
-35<br />
-40<br />
-45<br />
-50<br />
-55<br />
ST1<br />
ST3<br />
ST4<br />
ST5<br />
ST6<br />
ST7<br />
ST8<br />
ST9<br />
ST10<br />
ST11<br />
ST12<br />
-60<br />
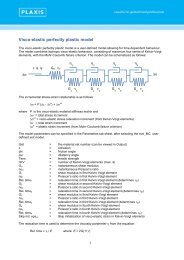
Figure 3. Calculated horizontal displacements at surface - analysis B<br />
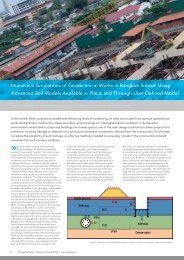
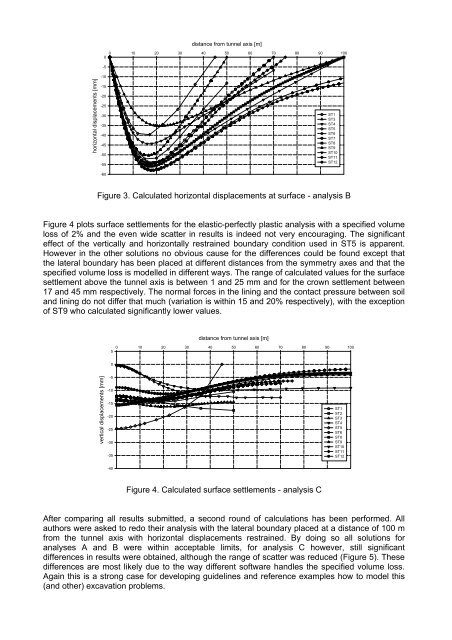
Figure 4 plots surface settlements for the elastic-perfectly plastic analysis with a specified volume<br />
loss of 2% and the even wide scatter in results is indeed not very encouraging. The significant<br />
effect of the vertically and horizontally restrained boundary condition used in ST5 is apparent.<br />
However in the other solutions no obvious cause for the differences could be found except that<br />
the lateral boundary has been placed at different distances from the symmetry axes and that the<br />
specified volume loss is modelled in different ways. The range of calculated values for the surface<br />
settlement above the tunnel axis is between 1 and 25 mm and for the crown settlement between<br />
17 and 45 mm respectively. The normal forces in the lining and the contact pressure between soil<br />
and lining do not differ that much (variation is within 15 and 20% respectively), with the exception<br />
of ST9 who calculated significantly lower values.<br />
distance from tunnel axis [m]<br />
0 10 20 30 40 50 60 70 80 90 100<br />
5<br />
0<br />
vertical displacements [mm]<br />
-5<br />
-10<br />
-15<br />
-20<br />
-25<br />
-30<br />
-35<br />
ST1<br />
ST2<br />
ST3<br />
ST4<br />
ST5<br />
ST6<br />
ST8<br />
ST9<br />
ST10<br />
ST11<br />
ST12<br />
-40<br />
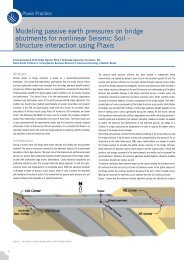
Figure 4. Calculated surface settlements - analysis C<br />
After comparing all results submitted, a second round of calculations has been performed. All<br />
authors were asked to redo their analysis with the lateral boundary placed at a distance of 100 m<br />
from the tunnel axis with horizontal displacements restrained. By doing so all solutions for<br />
analyses A and B were within acceptable limits, for analysis C however, still significant<br />
differences in results were obtained, although the range of scatter was reduced (Figure 5). These<br />
differences are most likely due to the way different software handles the specified volume loss.<br />
Again this is a strong case for developing guidelines and reference examples how to model this<br />
(and other) excavation problems.