Combining slash bundling with in-woods grinding operations
Combining slash bundling with in-woods grinding operations
Combining slash bundling with in-woods grinding operations

You also want an ePaper? Increase the reach of your titles
YUMPU automatically turns print PDFs into web optimized ePapers that Google loves.
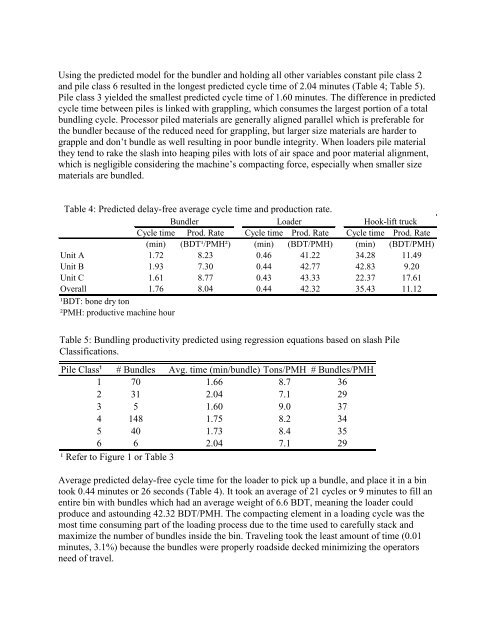
Us<strong>in</strong>g the predicted model for the bundler and hold<strong>in</strong>g all other variables constant pile class 2<br />
and pile class 6 resulted <strong>in</strong> the longest predicted cycle time of 2.04 m<strong>in</strong>utes (Table 4; Table 5).<br />
Pile class 3 yielded the smallest predicted cycle time of 1.60 m<strong>in</strong>utes. The difference <strong>in</strong> predicted<br />
cycle time between piles is l<strong>in</strong>ked <strong>with</strong> grappl<strong>in</strong>g, which consumes the largest portion of a total<br />
<strong>bundl<strong>in</strong>g</strong> cycle. Processor piled materials are generally aligned parallel which is preferable for<br />
the bundler because of the reduced need for grappl<strong>in</strong>g, but larger size materials are harder to<br />
grapple and don’t bundle as well result<strong>in</strong>g <strong>in</strong> poor bundle <strong>in</strong>tegrity. When loaders pile material<br />
they tend to rake the <strong>slash</strong> <strong>in</strong>to heap<strong>in</strong>g piles <strong>with</strong> lots of air space and poor material alignment,<br />
which is negligible consider<strong>in</strong>g the mach<strong>in</strong>e’s compact<strong>in</strong>g force, especially when smaller size<br />
materials are bundled.<br />
Table 4: Predicted delay-free average cycle time and production rate.<br />
Bundler Loader Hook-lift truck<br />
Cycle time Prod. Rate Cycle time Prod. Rate Cycle time Prod. Rate<br />
(m<strong>in</strong>) (BDT¹/PMH²) (m<strong>in</strong>) (BDT/PMH) (m<strong>in</strong>) (BDT/PMH)<br />
Unit A 1.72 8.23 0.46 41.22 34.28 11.49<br />
Unit B 1.93 7.30 0.44 42.77 42.83 9.20<br />
Unit C 1.61 8.77 0.43 43.33 22.37 17.61<br />
Overall 1.76 8.04 0.44 42.32 35.43 11.12<br />
¹BDT: bone dry ton<br />
²PMH: productive mach<strong>in</strong>e hour<br />
Table 5: Bundl<strong>in</strong>g productivity predicted us<strong>in</strong>g regression equations based on <strong>slash</strong> Pile<br />
Classifications.<br />
Pile Class¹ # Bundles Avg. time (m<strong>in</strong>/bundle) Tons/PMH # Bundles/PMH<br />
1 70 1.66 8.7 36<br />
2 31 2.04 7.1 29<br />
3 5 1.60 9.0 37<br />
4 148 1.75 8.2 34<br />
5 40 1.73 8.4 35<br />
6 6 2.04 7.1 29<br />
¹ Refer to Figure 1 or Table 3<br />
Average predicted delay-free cycle time for the loader to pick up a bundle, and place it <strong>in</strong> a b<strong>in</strong><br />
took 0.44 m<strong>in</strong>utes or 26 seconds (Table 4). It took an average of 21 cycles or 9 m<strong>in</strong>utes to fill an<br />
entire b<strong>in</strong> <strong>with</strong> bundles which had an average weight of 6.6 BDT, mean<strong>in</strong>g the loader could<br />
produce and astound<strong>in</strong>g 42.32 BDT/PMH. The compact<strong>in</strong>g element <strong>in</strong> a load<strong>in</strong>g cycle was the<br />
most time consum<strong>in</strong>g part of the load<strong>in</strong>g process due to the time used to carefully stack and<br />
maximize the number of bundles <strong>in</strong>side the b<strong>in</strong>. Travel<strong>in</strong>g took the least amount of time (0.01<br />
m<strong>in</strong>utes, 3.1%) because the bundles were properly roadside decked m<strong>in</strong>imiz<strong>in</strong>g the operators<br />
need of travel.