Phosphorus and the Kawartha Lakes - Lakefield Herald
Phosphorus and the Kawartha Lakes - Lakefield Herald
Phosphorus and the Kawartha Lakes - Lakefield Herald

You also want an ePaper? Increase the reach of your titles
YUMPU automatically turns print PDFs into web optimized ePapers that Google loves.
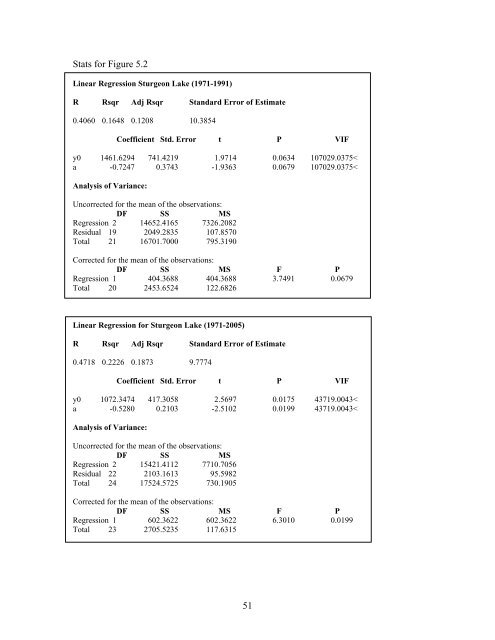
Stats for Figure 5.2<br />
Linear Regression Sturgeon Lake (1971-1991)<br />
R Rsqr Adj Rsqr St<strong>and</strong>ard Error of Estimate<br />
0.4060 0.1648 0.1208 10.3854<br />
Coefficient Std. Error t P VIF<br />
y0 1461.6294 741.4219 1.9714 0.0634 107029.0375<<br />
a -0.7247 0.3743 -1.9363 0.0679 107029.0375<<br />
Analysis of Variance:<br />
Uncorrected for <strong>the</strong> mean of <strong>the</strong> observations:<br />
DF SS MS<br />
Regression 2 14652.4165 7326.2082<br />
Residual 19 2049.2835 107.8570<br />
Total 21 16701.7000 795.3190<br />
Corrected for <strong>the</strong> mean of <strong>the</strong> observations:<br />
DF SS MS F P<br />
Regression 1 404.3688 404.3688 3.7491 0.0679<br />
Total 20 2453.6524 122.6826<br />
Linear Regression for Sturgeon Lake (1971-2005)<br />
R Rsqr Adj Rsqr St<strong>and</strong>ard Error of Estimate<br />
0.4718 0.2226 0.1873 9.7774<br />
Coefficient Std. Error t P VIF<br />
y0 1072.3474 417.3058 2.5697 0.0175 43719.0043<<br />
a -0.5280 0.2103 -2.5102 0.0199 43719.0043<<br />
Analysis of Variance:<br />
Uncorrected for <strong>the</strong> mean of <strong>the</strong> observations:<br />
DF SS MS<br />
Regression 2 15421.4112 7710.7056<br />
Residual 22 2103.1613 95.5982<br />
Total 24 17524.5725 730.1905<br />
Corrected for <strong>the</strong> mean of <strong>the</strong> observations:<br />
DF SS MS F P<br />
Regression 1 602.3622 602.3622 6.3010 0.0199<br />
Total 23 2705.5235 117.6315<br />
51