Summary Report for the Lansing Metropolitan Area - Tri-County ...
Summary Report for the Lansing Metropolitan Area - Tri-County ...
Summary Report for the Lansing Metropolitan Area - Tri-County ...

Create successful ePaper yourself
Turn your PDF publications into a flip-book with our unique Google optimized e-Paper software.
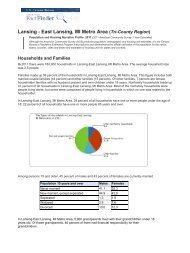
Two Potential Regional Growth Scenarios<br />
After data was ga<strong>the</strong>red concerning regional growth trends, this in<strong>for</strong>mation was applied to<br />
develop future options or scenarios <strong>for</strong> regional growth. These options were evaluated using<br />
travel <strong>for</strong>ecasting models and o<strong>the</strong>r tools to assess <strong>the</strong>ir impacts on transportation, costs of public<br />
services, environmental and land use impacts and o<strong>the</strong>r criteria. Two future growth scenarios<br />
were considered: “Business as Usual” and “Wise Growth.” In <strong>the</strong> “Business as Usual” scenario,<br />
future regional growth was depicted assuming present trends will continue without changes to<br />
current zoning and land use policies that guide and shape development. Alternatively, a “Wise<br />
Growth” scenario was also presented. This scenario assumed policies would be implemented to<br />
encourage that new development be directed to already developed urban areas (infill<br />
development), clustering of new development in proximity to developed areas and limited<br />
development in rural agricultural and open space areas. These two scenarios were modeled in a<br />
way to compare <strong>the</strong>ir impacts in <strong>the</strong> year 2025 and at some future point when <strong>the</strong> entire region<br />
reached <strong>the</strong> maximum “build out” permissable under existing zoning <strong>for</strong> all jurisdictions in <strong>the</strong><br />
three counties. Table 2 shows results of this analysis.<br />
Selection of <strong>the</strong> Wise Growth Scenario<br />
Both <strong>the</strong> “Business as Usual” and “Wise Growth” future development scenarios were presented<br />
at <strong>the</strong> town <strong>for</strong>ums and potential impacts on <strong>the</strong> region’s quality of life were described <strong>for</strong> both<br />
2025 and at regional build out. After <strong>the</strong> in<strong>for</strong>mation was presented, real-time computerized<br />
voting was conducted on both scenarios. In <strong>the</strong>se votes, it was determined that <strong>the</strong> “Wise<br />
Growth” scenario was preferred by 79% of <strong>the</strong> town <strong>for</strong>um participants. With <strong>the</strong>se<br />
overwhelming results, local officials on <strong>the</strong> advisory committee and <strong>the</strong> <strong>Tri</strong>-<strong>County</strong> Regional<br />
Planning Commission felt confident and adopted <strong>the</strong> “Wise Growth” scenario as <strong>the</strong> preferred<br />
alternative.<br />
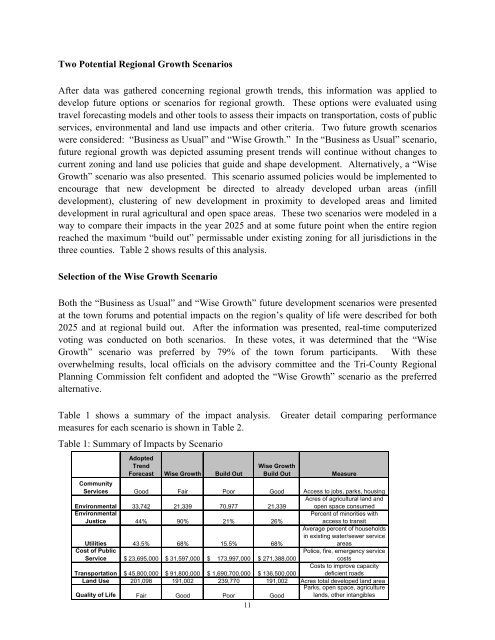
Table 1 shows a summary of <strong>the</strong> impact analysis. Greater detail comparing per<strong>for</strong>mance<br />
measures <strong>for</strong> each scenario is shown in Table 2.<br />
Table 1: <strong>Summary</strong> of Impacts by Scenario<br />
Adopted<br />
Trend<br />
Forecast Wise Growth Build Out<br />
Wise Growth<br />
Build Out<br />
Measure<br />
Community<br />
Services Good Fair Poor Good Access to jobs, parks, housing<br />
Environmental 33,742 21,339 70,977 21,339<br />
Acres of agricultural land and<br />
open space consumed<br />
Environmental<br />
Justice 44% 90% 21% 26%<br />
Percent of minorities with<br />
access to transit<br />
Average percent of households<br />
in existing water/sewer service<br />
areas<br />
Utilities 43.5% 68% 15.5% 68%<br />
Cost of Public<br />
Police, fire, emergency service<br />
Service $ 23,695,000 $ 31,597,000 $ 173,997,000 $ 271,388,000<br />
costs<br />
Costs to improve capacity<br />
Transportation $ 45,800,000 $ 91,800,000 $ 1,690,700,000 $ 136,500,000 deficient roads<br />
Land Use 201,098 191,002 239,770 191,002 Acres total developed land area<br />
Parks, open space, agriculture<br />
lands, o<strong>the</strong>r intangibles<br />
Quality of Life Fair Good Poor Good<br />
11