Summary Report for the Lansing Metropolitan Area - Tri-County ...
Summary Report for the Lansing Metropolitan Area - Tri-County ...
Summary Report for the Lansing Metropolitan Area - Tri-County ...

You also want an ePaper? Increase the reach of your titles
YUMPU automatically turns print PDFs into web optimized ePapers that Google loves.
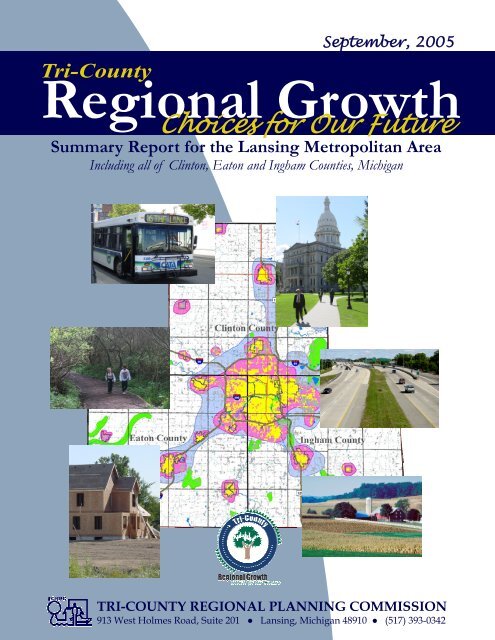
September, 2005<br />
Regional Growth<br />
<strong>Summary</strong> <strong>Report</strong> <strong>for</strong> <strong>the</strong> <strong>Lansing</strong> <strong>Metropolitan</strong> <strong>Area</strong><br />
Including all of Clinton, Eaton and Ingham Counties, Michigan<br />
TRI-COUNTY REGIONAL PLANNING COMMISSION<br />
913 West Holmes Road, Suite 201 ● <strong>Lansing</strong>, Michigan 48910 ● (517) 393-0342
“Regional Growth: Choices <strong>for</strong> Our Future”<br />
<strong>Summary</strong> <strong>Report</strong><br />
For <strong>the</strong> <strong>Lansing</strong> <strong>Metropolitan</strong> <strong>Area</strong>,<br />
Including all of Clinton, Eaton and Ingham<br />
Counties, Michigan<br />
Prepared by:<br />
TRI-COUNTY REGIONAL<br />
PLANNING COMMISSION<br />
913 W. Holmes Rd., Suite 201<br />
<strong>Lansing</strong>, Michigan 48910<br />
Phone: (517) 393-0342<br />
Fax: (517) 393-4424<br />
www.mitcrpc.org<br />
FINAL<br />
September, 2005
DISCLAIMER<br />
This document was prepared by <strong>the</strong> <strong>Tri</strong>-<strong>County</strong> Regional Planning Commission in cooperation<br />
with <strong>the</strong> Michigan Department of Transportation, county road commissions, public<br />
transportation providers, and local jurisdictions. Preparation of this document was financed in<br />
part by funds from <strong>the</strong> United States Department of Transportation and <strong>the</strong> Michigan Department<br />
of Transportation. The opinions, findings and conclusions in this publication are <strong>the</strong> author’s<br />
and not necessarily those of <strong>the</strong> United States or Michigan Departments of Transportation.<br />
The <strong>Tri</strong>-<strong>County</strong> Regional Planning Commission is an Equal Opportunity/Affirmative Action<br />
Employer. Hiring and service to program recipients is done without regard to race, color,<br />
religion, national origin, sex, age, or handicap.
______________________________________________________________________________<br />
“Regional Growth: Choices <strong>for</strong> Our Future”<br />
<strong>Summary</strong> <strong>Report</strong><br />
______________________________________________________________________________<br />
Project Mission<br />
The mission of <strong>the</strong> <strong>Tri</strong>-<strong>County</strong> Regional Planning Commission’s “Regional Growth: Choices<br />
<strong>for</strong> Our Future” project was to actively engage <strong>the</strong> region’s citizens to examine implications of<br />
regional land use and o<strong>the</strong>r growth trends on <strong>the</strong> region’s future. The project <strong>for</strong>mulated<br />
consensus on a shared vision of regional growth in order to assure an improved future regional<br />
quality of life.<br />
What Does <strong>the</strong> Project mean <strong>for</strong> <strong>the</strong> Region ?<br />
The <strong>Tri</strong>-<strong>County</strong> “Regional Growth: Choices <strong>for</strong> Our Future” project provided <strong>the</strong> opportunity<br />
<strong>for</strong> <strong>the</strong> whole region to consider how best to maintain our quality of life while continuing to<br />
grow. The vision and policies will be implemented to encourage infill development in urban,<br />
suburban and rural centers. New growth in <strong>the</strong> region will be planned <strong>for</strong> mature corridors<br />
which connect regional centers where transit ridership potential is highest. The majority of new<br />
development is expected to be focused in areas where public water and sewer systems are<br />
available and it is anticipated <strong>the</strong>re will be more investment in quality of life/livability factors,<br />
such as sidewalks, landscaping and preservation of <strong>the</strong> tree canopy. The project created<br />
consensus on a series of shared goals which <strong>the</strong> region’s governments can now implement.<br />
If fully implemented, <strong>the</strong> preferred regional vision will:<br />
• Reduce congested lane miles on regional roads by approximately 50 percent and<br />
save taxpayers between 1.6 and 4.8 billion dollars in road improvement costs which<br />
would o<strong>the</strong>rwise be required if current trends are unchecked.<br />
• Save <strong>the</strong> equivalent of three townships of agricultural land and open space.<br />
• Reduce air pollutants by tens of thousands of kilograms per day, leading to public<br />
health benefits and lower long term public health costs.<br />
• Improve <strong>the</strong> region’s quality of life and economic competitiveness in an increasingly<br />
global economy greater than would occur under current public policies.<br />
1
What does <strong>the</strong> Project Mean <strong>for</strong> You ?<br />
Regardless of where you reside in <strong>the</strong> region, implementing <strong>the</strong> <strong>Tri</strong>-<strong>County</strong> “Regional Growth:<br />
Choices <strong>for</strong> Our Future” project’s <strong>the</strong>mes and principles will help maintain quality of life and<br />
reduce cost of public services which might o<strong>the</strong>rwise be required if current trends are not<br />
reversed.<br />
If you are an urban resident, <strong>the</strong> project streng<strong>the</strong>ns <strong>the</strong> urban core and recognizes that long-term<br />
stability of <strong>the</strong> region depends on strong cities and residential neighborhoods which remain<br />
quality places to live.<br />
If you live in suburban areas, <strong>the</strong> project suggests planned, clustered and focused growth with<br />
development of clear transitional edges to minimize strip development and sprawl. Clear<br />
transitions are planned when passing from residential clusters to agricultural land or open space.<br />
If you live in a small city or village, <strong>the</strong> project suggests phased, focused growth. In o<strong>the</strong>r<br />
words, your jurisdiction will determine <strong>the</strong> appropriate rate of growth to preserve your quality of<br />
life. New growth should not place undue hardships on <strong>the</strong> existing population and, where<br />
appropriate, be fully coordinated with adjoining jurisdictions (townships) in a sub-regional plan.<br />
If you live in a rural area, <strong>the</strong> project will maintain a healthy agricultural economy by focusing<br />
on appropriate locations <strong>for</strong> new growth and preserving agricultural areas and open space.<br />
What Does <strong>the</strong> Project mean <strong>for</strong> Local Government Officials ?<br />
The project has important implications <strong>for</strong> local government officials who are concerned with <strong>the</strong><br />
current growth trends in <strong>the</strong> <strong>Tri</strong>-<strong>County</strong> region. Results suggest each jurisdiction’s individual<br />
actions affect o<strong>the</strong>r communities in <strong>the</strong> <strong>Tri</strong>-<strong>County</strong> region. In o<strong>the</strong>r words, no community should<br />
plan without considering impacts on o<strong>the</strong>r communities. Cooperation and coordination of local<br />
decisions and plans with surrounding jurisdictions allows <strong>the</strong> region to remain internally<br />
cooperative and externally competitive. In<strong>for</strong>mation from <strong>the</strong> growth project is being shared<br />
with local governments so that <strong>the</strong> vision, principles, action plan, data and maps can be used in<br />
developing coordinated local plans. Since <strong>the</strong> region includes 78 different local governmental<br />
units (50 with <strong>the</strong>ir own land use powers), coordination of planning ef<strong>for</strong>ts in <strong>the</strong> region will<br />
lower costs and result in greater benefits than if each unit develops independent local plans.<br />
Project <strong>Area</strong><br />
The <strong>Tri</strong>-<strong>County</strong> region is located in Mid-Michigan and includes <strong>the</strong> <strong>Lansing</strong> metropolitan area<br />
and all of Ingham, Eaton and Clinton Counties. The region is home to <strong>the</strong> state capital, Michigan<br />
State University, automobile manufacturing plants and o<strong>the</strong>r industry and a diverse agricultural<br />
economy.<br />
2
Figure 1: Map Showing <strong>the</strong> <strong>Tri</strong>-<strong>County</strong> Region<br />
3
Why Was This Project Conducted?<br />
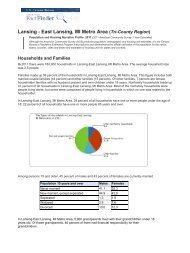
In 2000, <strong>the</strong> region’s population was 447,734.<br />
However, if current trends continue, conversion of land to urban uses will continue to occur<br />
more rapidly than population growth. For each additional family in <strong>the</strong> region, more land is<br />
being converted to urban uses outside existing urban areas than is being redeveloped in existing<br />
cities.<br />
This situation creates land use planning and public policy issues. For example, new development<br />
outside of existing urban centers creates new costs by requiring new services, while services that<br />
already exist may become underused. Such development also results in loss of agricultural land<br />
and open space. The <strong>Tri</strong>-<strong>County</strong> “Regional Growth: Choices <strong>for</strong> Our Future” project provided<br />
in<strong>for</strong>mation to residents of <strong>the</strong> region on <strong>the</strong> implications of growth trends on land use choices.<br />
Accepted regional population <strong>for</strong>ecasting model results show trends which indicate continued<br />
slow population growth over <strong>the</strong> next 25 years, which amount to less than one percent per year<br />
on an annualized basis.<br />
Figure 2: Regional Population Trends 1950-2030<br />
600,000<br />
550,000<br />
561,705<br />
500,000<br />
497,993<br />
534,414<br />
Number of Persons<br />
450,000<br />
400,000<br />
350,000<br />
300,000<br />
250,000<br />
244,159<br />
298,949<br />
378,423<br />
416,667<br />
432,674<br />
447,734<br />
200,000<br />
150,000<br />
100,000<br />
1950 1960 1970 1980 1990 2000 proj 2010 proj 2020 proj 2030<br />
4
Population growth occurs in locations on <strong>the</strong> urban fringe, while city centers have little growth or<br />
population loss.<br />
Figure 3: Population Change, 1970-2000, by Percentage<br />
5
Figure 4 shows that between 1938 and 1978, <strong>the</strong> spatial areas of <strong>the</strong> region which were<br />
considered urbanized increased from 28.3 square miles to 103.3 square miles. Between 1978<br />
and 1999 <strong>the</strong> spatial area of land considered as urbanized expanded to 125.8 square miles.<br />
Figure 4: Urban <strong>Area</strong>s, 1938-1999, by square mile:<br />
6
Figure 5 also shows regional residential growth between 1978 and 1999. During this period,<br />
approximately 100 square miles of additional residential land was converted from o<strong>the</strong>r uses,<br />
while 120 square miles in agricultural lands were developed, primarily into residential use.<br />
Since a Michigan township is typically 36 square miles, <strong>the</strong> conversion of agricultural land is <strong>the</strong><br />
equivalent to about 3.3 townships, or greater than one township per county. Rural land is being<br />
converted to residential use at a rapid rate: five times greater than land at <strong>the</strong> edge of <strong>the</strong> urban<br />
area, using <strong>the</strong> equivalent of five acres per residence, where each residence in <strong>the</strong> urban area only<br />
uses one acre.<br />
Figure 5: Residential Change, 1978-1999:<br />
7
Project Process<br />
The “Regional Growth: Choices <strong>for</strong> Our Future” project began in 1999 when community<br />
leaders began to consider how to maintain <strong>the</strong> region’s quality of life into <strong>the</strong> 21 st century. After<br />
a series of local meetings, local officials designed a project to ga<strong>the</strong>r in<strong>for</strong>mation on current land<br />
use and transportation trends and use that in<strong>for</strong>mation to develop potential future scenarios <strong>for</strong><br />
regional growth. The <strong>Tri</strong>-<strong>County</strong> Regional Planning Commission <strong>the</strong>n obtained funding from<br />
local, state and federal sources <strong>for</strong> <strong>the</strong> project. As grant funding was secured, <strong>the</strong> Commission<br />
organized and implemented a multi-year planning process to ga<strong>the</strong>r in<strong>for</strong>mation on regional<br />
growth trends, consider <strong>the</strong> implications of those trends and to develop a shared future regional<br />
vision.<br />
Project Participants & <strong>the</strong> Preferred Vision<br />
The <strong>Tri</strong>-<strong>County</strong> Regional Planning Commission created local project stakeholder and steering<br />
committees and selected a consultant team to ga<strong>the</strong>r data which was <strong>the</strong>n applied to develop<br />
future growth scenarios. Throughout <strong>the</strong> process, 13 town hall <strong>for</strong>ums were held so that <strong>the</strong><br />
public could participate in developing <strong>the</strong> emerging vision. Random public and leader opinion<br />
surveys, a toll free hotline, numerous special task <strong>for</strong>ces and o<strong>the</strong>r techniques were also used to<br />
obtain input. As a result of extensive technical work, <strong>the</strong> committee process and numerous<br />
opportunities <strong>for</strong> public input, a preferred regional vision was selected.<br />
Completion of Project Planning<br />
As <strong>the</strong> preferred regional vision was determined, supporting principles and an action plan were<br />
developed and a policy map was prepared depicting a generalized regional map of <strong>the</strong> preferred<br />
future vision. These actions have been integrated into a poster plan, technical report, this<br />
summary and o<strong>the</strong>r supporting materials which represent <strong>the</strong> conclusions of <strong>the</strong> project’s<br />
planning phase. Now <strong>the</strong> “Regional Growth: Choices <strong>for</strong> Our Future” project is moving into<br />
an implementation phase. In project implementation, in<strong>for</strong>mation from this ef<strong>for</strong>t will be<br />
considered and applied by local units of government and <strong>the</strong> region’s residents. Elements of <strong>the</strong><br />
project will now be integrated at <strong>the</strong> local land use decision making level to fur<strong>the</strong>r mplement <strong>the</strong><br />
preferred regional vision.<br />
Participation Overview<br />
Due to <strong>the</strong> scope of <strong>the</strong> <strong>Tri</strong>-<strong>County</strong> “Regional Growth: Choices <strong>for</strong> Our Future” project, a<br />
wide array of regional public involvement and participation opportunities were provided<br />
throughout <strong>the</strong> process. An integral factor contributing to <strong>the</strong> consensus and outcomes of <strong>the</strong><br />
project planning phase was participation by both community leaders and <strong>the</strong> public. A mix of<br />
local decision makers, community leaders, technical staff and <strong>the</strong> general public all played<br />
important roles in developing <strong>the</strong> regional vision. In total, over 1,500 persons contributed<br />
8
directly to development of <strong>the</strong> regional vision through attendance at town hall <strong>for</strong>ums,<br />
participation on committees, task <strong>for</strong>ces, surveys, focus groups or by submitting comments via<br />
toll free hotlines, internet or email access. Hundreds also attended leadership briefings or stayed<br />
abreast of activities through <strong>the</strong> project’s newsletter or o<strong>the</strong>r in<strong>for</strong>mation and outreach activities.<br />
Technical Staff<br />
Staff of <strong>the</strong> <strong>Tri</strong>-<strong>County</strong> Regional Planning Commission guided <strong>the</strong> project, implemented <strong>the</strong><br />
planning process and worked with a large team of planning and research consultants to complete<br />
a series of technical tasks to collect and analyze project data.<br />
Stakeholders & Steering Committees<br />
In order to provide ongoing guidance during <strong>the</strong> project, a Stakeholders Committee was<br />
assembled with members from over 90 different public and private organizations to provide<br />
input based on <strong>the</strong>ir unique knowledge of <strong>the</strong> region. A Steering Committee composed of 14<br />
policy makers was <strong>for</strong>med to provide direction and to act as an advisory body to <strong>the</strong> <strong>Tri</strong>-<strong>County</strong><br />
Regional Planning Commission on all aspects of project management. Both <strong>the</strong> Steering and<br />
Stakeholders Committees were active throughout <strong>the</strong> project.<br />
Public Participation<br />
In addition to <strong>the</strong> work of <strong>the</strong> planners, committees and task <strong>for</strong>ces, this project also obtained a<br />
large amount of input from <strong>the</strong> general public. At key points in <strong>the</strong> process, town <strong>for</strong>ums,<br />
leadership briefings, surveys, task <strong>for</strong>ces, focus groups, a proactive media campaign and o<strong>the</strong>r<br />
techniques were implemented to provide project in<strong>for</strong>mation to <strong>the</strong> general public and to obtain<br />
direct input on various project elements. A total of thirteen town <strong>for</strong>ums were held throughout<br />
<strong>the</strong> region to ensure that public input guided each portion of <strong>the</strong> planning process.<br />
9
Figure 6 shows particpants by zip code in <strong>the</strong> <strong>Tri</strong>-<strong>County</strong> region <strong>for</strong> <strong>the</strong> town <strong>for</strong>ums. Public<br />
participation in <strong>the</strong> project was distributed throughout <strong>the</strong> region.<br />
Figure 6: Public Participation in Town Hall Forums by Zip Code<br />
10
Two Potential Regional Growth Scenarios<br />
After data was ga<strong>the</strong>red concerning regional growth trends, this in<strong>for</strong>mation was applied to<br />
develop future options or scenarios <strong>for</strong> regional growth. These options were evaluated using<br />
travel <strong>for</strong>ecasting models and o<strong>the</strong>r tools to assess <strong>the</strong>ir impacts on transportation, costs of public<br />
services, environmental and land use impacts and o<strong>the</strong>r criteria. Two future growth scenarios<br />
were considered: “Business as Usual” and “Wise Growth.” In <strong>the</strong> “Business as Usual” scenario,<br />
future regional growth was depicted assuming present trends will continue without changes to<br />
current zoning and land use policies that guide and shape development. Alternatively, a “Wise<br />
Growth” scenario was also presented. This scenario assumed policies would be implemented to<br />
encourage that new development be directed to already developed urban areas (infill<br />
development), clustering of new development in proximity to developed areas and limited<br />
development in rural agricultural and open space areas. These two scenarios were modeled in a<br />
way to compare <strong>the</strong>ir impacts in <strong>the</strong> year 2025 and at some future point when <strong>the</strong> entire region<br />
reached <strong>the</strong> maximum “build out” permissable under existing zoning <strong>for</strong> all jurisdictions in <strong>the</strong><br />
three counties. Table 2 shows results of this analysis.<br />
Selection of <strong>the</strong> Wise Growth Scenario<br />
Both <strong>the</strong> “Business as Usual” and “Wise Growth” future development scenarios were presented<br />
at <strong>the</strong> town <strong>for</strong>ums and potential impacts on <strong>the</strong> region’s quality of life were described <strong>for</strong> both<br />
2025 and at regional build out. After <strong>the</strong> in<strong>for</strong>mation was presented, real-time computerized<br />
voting was conducted on both scenarios. In <strong>the</strong>se votes, it was determined that <strong>the</strong> “Wise<br />
Growth” scenario was preferred by 79% of <strong>the</strong> town <strong>for</strong>um participants. With <strong>the</strong>se<br />
overwhelming results, local officials on <strong>the</strong> advisory committee and <strong>the</strong> <strong>Tri</strong>-<strong>County</strong> Regional<br />
Planning Commission felt confident and adopted <strong>the</strong> “Wise Growth” scenario as <strong>the</strong> preferred<br />
alternative.<br />
Table 1 shows a summary of <strong>the</strong> impact analysis. Greater detail comparing per<strong>for</strong>mance<br />
measures <strong>for</strong> each scenario is shown in Table 2.<br />
Table 1: <strong>Summary</strong> of Impacts by Scenario<br />
Adopted<br />
Trend<br />
Forecast Wise Growth Build Out<br />
Wise Growth<br />
Build Out<br />
Measure<br />
Community<br />
Services Good Fair Poor Good Access to jobs, parks, housing<br />
Environmental 33,742 21,339 70,977 21,339<br />
Acres of agricultural land and<br />
open space consumed<br />
Environmental<br />
Justice 44% 90% 21% 26%<br />
Percent of minorities with<br />
access to transit<br />
Average percent of households<br />
in existing water/sewer service<br />
areas<br />
Utilities 43.5% 68% 15.5% 68%<br />
Cost of Public<br />
Police, fire, emergency service<br />
Service $ 23,695,000 $ 31,597,000 $ 173,997,000 $ 271,388,000<br />
costs<br />
Costs to improve capacity<br />
Transportation $ 45,800,000 $ 91,800,000 $ 1,690,700,000 $ 136,500,000 deficient roads<br />
Land Use 201,098 191,002 239,770 191,002 Acres total developed land area<br />
Parks, open space, agriculture<br />
lands, o<strong>the</strong>r intangibles<br />
Quality of Life Fair Good Poor Good<br />
11
Table 2: Preliminary Comparative Analysis of Scenarios Used in Selecting<br />
<strong>the</strong> Preferred Alternative<br />
Impact category<br />
Trend<br />
Forecasts<br />
Wise<br />
Growth<br />
Build Out<br />
Wise Growth<br />
Build Out<br />
Agricultural land consumed (acres) 21,889 14,471 39,047 14,471<br />
Open space (not ag) consumed (acres) 11,853 6,868 31,930 6,868<br />
Environmental areas preserved (acres) 195,100 200,100 175,100 200,100<br />
Total developed land area (acres) 201,098 191,002 239,770 191,002<br />
Developed land per capita 0.37 0.35 0.16 0.13<br />
Total non-retail area (acres) 8,106 8,052 15,081 8,052<br />
Total retail area (acres) 19,573 9,519 11,002 9,519<br />
Total residential area (acres) 150,196 145,208 190,464 145,208<br />
Developed residential land per capita 0.27 0.26 0.13 0.10<br />
End-year Population 550,166 550,166 1,462,666 1,462,666<br />
End-Year Retail Employment 68,857 68,857 112,547 112,547<br />
End-Year Non-retail Employment 270,923 270,923 377,378 377,378<br />
Population change (#) 101,913 101,913 1,014,413 1,014,413<br />
Population in developed areas (#) 324,598 352,106 453,426 1,082,373<br />
Population in developed areas (%) 59% 64% 31% 74%<br />
Population in undeveloped areas (#) 225,568 198,060 1,009,240 380,293<br />
Population in undeveloped areas (%) 41% 36% 69% 26%<br />
Percent of jobs within 1/4-mile radius of transit<br />
routes 61% 67% 48% 66%<br />
Percent of households within 1/4-mile radius of<br />
transit routes 42% 48% 23% 49%<br />
Percent of new households within 2-mile radius<br />
of community parks 90% 92% 73% 93%<br />
Percent of new households within 1/4-mile<br />
radius of neighborhood parks 40% 44% 23% 46%<br />
% of new households in sewer service area 42% 67% 16% 67%<br />
% of new households in water service area 45% 69% 15% 69%<br />
New students in excess of existing available<br />
capacity* 5,816 2,510 69,359 107,338<br />
New police expenditures (current LOS per unit) $16,512,000 $20,182,000 $113,968,000 $189,401,000<br />
New fire/EMS expenditures (current LOS per<br />
unit) $7,183,000 $11,415,000 $60,299,000 $81,987,000<br />
Minority population within 1/4-mile radius of<br />
transit routes 44% 90% 21% 26%<br />
* Where in<strong>for</strong>mation on capacity and enrollment is available<br />
12
Measures of community support as shown by participants voting in town hall <strong>for</strong>ums based on<br />
this impact analysis follow in figures 7 and 8.<br />
Figure 7: Public Preference <strong>for</strong> Alternatives By Impact Category<br />
100%<br />
90%<br />
80%<br />
70%<br />
60%<br />
50%<br />
40%<br />
86%<br />
87% 86%<br />
87%<br />
81% 82% 83%<br />
Wise Growth<br />
Business as Usual<br />
30%<br />
20%<br />
10%<br />
14%<br />
19%<br />
13%<br />
14%<br />
18%<br />
13%<br />
17%<br />
0%<br />
Community<br />
Services<br />
Environmental<br />
Environmental<br />
Justice<br />
Utilities Transportation Land Use Quality of Life<br />
Figure 8: Public Selection of Preferred Alternative<br />
79%<br />
Wise Growth<br />
Business as Usual<br />
Nei<strong>the</strong>r<br />
6%<br />
15%<br />
13
The Preferred Alternative<br />
Once <strong>the</strong> preferred alternative was selected, it had to be fur<strong>the</strong>r defined and articulated to <strong>the</strong><br />
regional community. To describe <strong>the</strong> preferred alternative, both written and map-based<br />
descriptions were prepared. The written description took <strong>the</strong> <strong>for</strong>m of 29 specific principles<br />
described by five broad <strong>the</strong>me areas, as follows:<br />
• Government;<br />
• Healthy Economy – Healthy Environment;<br />
• Transportation and O<strong>the</strong>r Infrastructure;<br />
• Open Space and Resource Protection; and<br />
• Growth & Redevelopment.<br />
In addition to <strong>the</strong> <strong>the</strong>mes and principles, <strong>the</strong> preferred alternative was depicted as a policy map.<br />
This map shows areas identified <strong>for</strong>:<br />
• maintaining urban and village centers;<br />
• urban fringe focused growth areas;<br />
• transitional cluster development areas;<br />
• agricultural preservation areas; and<br />
• <strong>for</strong>ested and environmental preservation areas.<br />
Toge<strong>the</strong>r, <strong>the</strong> five <strong>the</strong>mes, 29 principles and policy map were used to create <strong>the</strong> growth project<br />
poster plan. The poster plan, along with this summary, describe <strong>the</strong> initial results of <strong>the</strong> Regional<br />
Growth project.<br />
The Two Future Regional Growth Scenarios<br />
“Business as Usual”<br />
One of <strong>the</strong> scenarios considered was “Business as Usual.” This scenario projects what could<br />
happen by 2025 and at regional build out if <strong>the</strong>re are no changes to current land use policies.<br />
Figure 9 depicts modeled representation of <strong>the</strong> distribution of development under <strong>the</strong> future<br />
“Business as Usual” scenario. In town <strong>for</strong>ums, only 15% of participants preferred this scenario.<br />
14
Figure 9: The “Business as Usual” Scenario<br />
Retail<br />
Residential<br />
Non-Retail<br />
15
“Wise Growth”<br />
The o<strong>the</strong>r scenario considered was “Wise Growth.” In <strong>the</strong> wise growth scenario, new land use<br />
policies would direct development to existing urbanized areas. Figure 10 illustrates how a<br />
modeled representation of <strong>the</strong> wise growth scenario clusters new development around cities. In<br />
town <strong>for</strong>ums, 79% of participants preferred this scenario, which was adopted as <strong>the</strong> preferred<br />
alternative. Figure 11 shows this preferred alternative depicted as <strong>the</strong> adopted regional land use<br />
policy map.<br />
The adopted regional land use policy map (Figure 11) shows areas where city/village centers are<br />
to be streng<strong>the</strong>ned. Also shown are focused and clustered growth areas and locations where rural<br />
lands are to have minimal development in order to preserve agriculture and open space.<br />
Governments in <strong>the</strong> region will adopt this map and implement <strong>the</strong> following policies.<br />
16
Figure 10: The “Wise Growth” Scenario<br />
Retail<br />
Residential<br />
Non-Retail<br />
17
Figure 11: Adopted Regional Land Use Policy Map<br />
18
Adopted Themes & Principles<br />
Government<br />
Principle #1 − Intergovernmental Cooperation & Coordination<br />
Every jurisdiction’s action affects o<strong>the</strong>r communities within <strong>the</strong> <strong>Tri</strong>-<strong>County</strong> region. All 75 cities,<br />
villages, townships and three counties should cooperate and coordinate <strong>the</strong>ir decisions and plans<br />
so <strong>the</strong> region is internally cooperative and externally competitive.<br />
Principle #2 − Implementation Through Local Action<br />
The region includes 75 cities, villages, townships and three counties. It is through development<br />
of coordinated local plans, ordinances and policies that <strong>the</strong> Regional Vision will be implemented.<br />
Principle #3 − Issues of Greater than Local Concern<br />
Through evaluation and communication, <strong>the</strong> region should identify issues of greater than local<br />
concern, and through consensus building among affected local governments and o<strong>the</strong>r<br />
stakeholders, promote change in state or federal laws, rules, regulations or o<strong>the</strong>r policy.<br />
Principle #4 − Public Participation<br />
Local jurisdictions should expand and maintain practices, policies, behaviors and procedures that<br />
educate and promote continuous and meaningful opportunities <strong>for</strong> broad citizen and stakeholder<br />
participation.<br />
Principle #5 − Customer Satisfaction<br />
The region should strive <strong>for</strong> an efficient, predictable and fair way to provide public services to<br />
achieve a consistently high level of customer and community satisfaction.<br />
Principle #6 − Regional Role<br />
The region needs an advocate, facilitator and <strong>for</strong>um that has <strong>the</strong> support of local governments,<br />
stakeholders and citizens to promote, monitor, refine and assist with implementation of <strong>the</strong><br />
preferred Regional Vision. This role includes education, coordination and collaboration, dispute<br />
prevention and resolution, providing technical assistance (including model ordinances and<br />
planning processes) and reporting on successes and failures.<br />
Principle #7 − Equitable Growth and Redevelopment<br />
Costs and benefits associated with new growth and redevelopment should be proportional <strong>for</strong><br />
existing residents, <strong>the</strong> host community and neighboring jurisdictions and shared by developers.<br />
Principle #8 − Capital Improvements Strategies<br />
Public improvements should be planned in advance and publicly prioritized to maximize benefits<br />
of implementing <strong>the</strong> preferred vision.<br />
Healthy Economy & Healthy Environment<br />
Principle #9 − Environmental Protection<br />
For long-term regional health and sustainability, <strong>the</strong> natural environment (land, air and water)<br />
should be protected.<br />
19
Principle #10 − Waste Management<br />
Local communities should cooperatively plan <strong>for</strong> changing regional waste management needs<br />
including reuse, reduction, recycling and disposal of solid waste.<br />
Principle #11 − Energy Consumption<br />
Resource conservation and an appropriate mix of renewable and nonrenewable resources should<br />
guide future utility expansion.<br />
Principle #12 − Housing <strong>for</strong> All Community Residents<br />
Housing needs (type, location, cost, <strong>the</strong> jobs/housing balance, etc.) of all regional residents<br />
should be continuously and fairly addressed balancing <strong>the</strong> needs of each jurisdiction.<br />
Principle #13 − Jobs, Economic Development and Work Force<br />
Jobs, economic expansion and work<strong>for</strong>ce development should be emphasized consistent with <strong>the</strong><br />
preferred Regional Vision to keep <strong>the</strong> region competitive in a global economy, but not at <strong>the</strong><br />
expense of environmental health.<br />
Transportation & O<strong>the</strong>r Infrastructure<br />
Principle #14 − Transportation Network<br />
The regional transportation priority will be to enhance and preserve <strong>the</strong> existing road network,<br />
public transit and non-motorized transportation modes ra<strong>the</strong>r than fur<strong>the</strong>r expansion of <strong>the</strong> road<br />
network in rural areas.<br />
Principle #15 − Public Facilities<br />
Public facilities (schools, police, fire stations, museums, etc.) should be planned with an<br />
emphasis on partnerships among jurisdiction’s service delivery to promote <strong>the</strong> preferred<br />
Regional Vision.<br />
Principle #16 − Hazard Mitigation Planning & Emergency Management<br />
Disaster preparedness and emergency management strategies should be developed locally and<br />
coordinated by regional hazard mitigation planning, which strives to reduce <strong>the</strong> impacts and cost<br />
of potential hazards of both natural or human origin.<br />
Principle #17 − Infrastructure Expansion and Replacement<br />
Infrastructure expansion and replacement should follow <strong>the</strong> preferred Regional Vision with clear<br />
urban and rural service areas.<br />
Open Space & Resource Protection<br />
Principle #18 − Farmland, Open Space & O<strong>the</strong>r Natural Resources Protection<br />
Farmland and o<strong>the</strong>r natural resources should be protected in an equitable, fiscally responsible<br />
manner to preserve <strong>the</strong> heritage, environment, quality of life and long-term sustainability of <strong>the</strong><br />
region.<br />
20
Principle #19 − Greenways & Walkability<br />
Pathways, sidewalks, trails and on-street bike facilities should be developed and enhanced to<br />
provide alternatives to motorized transportation, improve linkages to recreational opportunities<br />
<strong>for</strong> regional residents and provide public health benefits by offering opportunities <strong>for</strong> physical<br />
activity.<br />
Principle #20 − Parks & Recreation Expansion and Linkage<br />
Parks & recreation development and expansions should emphasize linkage of facilities through<br />
greenways based on <strong>the</strong> regional vision and <strong>the</strong> adopted Regional Non-Motorized System Plan.<br />
Principle #21 − Historic Preservation & Cultural Facilities<br />
The region’s significant built and living heritage, historic sites, cultural facilities and<br />
neighborhoods should be protected, preserved and enhanced.<br />
Growth & Redevelopment<br />
Principle #22 − Compact Settlement<br />
All existing cities, villages and townships in <strong>the</strong> region should establish urban and rural service<br />
areas in cooperation with neighboring jurisdictions and consistent with <strong>the</strong> Preferred Vision.<br />
New development in <strong>the</strong> region should occur in urban service areas or in approved rural clusters<br />
at densities consistent with <strong>the</strong> natural capabilities of soils to absorb septic wastes and <strong>the</strong><br />
community’s ability to adequately meet public service needs.<br />
Principle #23 − Transitional Edges and Clustered Development <strong>Area</strong>s<br />
A clear transition when passing from urban, cluster development and agricultural zones should<br />
be established to minimize future strip commercial development.<br />
Principle #24 − Phased Growth<br />
Each jurisdiction should determine its appropriate rate of growth to preserve and enhance <strong>the</strong>ir<br />
community and infrastructure. Jurisdictions should phase and manage development at a pace<br />
that does not put undue hardship on existing populations, neighboring jurisdictions, municipal<br />
services or <strong>the</strong> actual environment.<br />
Principle #25 − Agricultural Economy<br />
To enhance synergy between <strong>the</strong> regional economy and agricultural production, <strong>the</strong> entire region<br />
should emphasize regulation of development on rural lands.<br />
Principle #26 − Streng<strong>the</strong>ning <strong>the</strong> Urban Core<br />
The long-term economic sustainability of <strong>the</strong> region depends on strong urban cores. There<strong>for</strong>e,<br />
our highest priority is <strong>for</strong> local units of government, stakeholders and citizens to take such<br />
measures as necessary to ensure that urban cores are viable and competitive, that urban<br />
residential neighborhoods remain quality places to live and that urban school districts remain on<br />
par with o<strong>the</strong>r area schools.<br />
Principle #27 − Focused Growth<br />
Urban fringe areas should have <strong>the</strong> second priority to be enhanced, developed and redeveloped<br />
prior to similar development outside designated urban service areas.<br />
21
Principle #28 − Viable Neighborhoods<br />
Implement traditional neighborhood planning and design concepts (walkable elementary schools,<br />
mixed use zoning, village/community design, etc.) to:<br />
• maintain or re-establish viable neighborhoods;<br />
• attract new residents; and<br />
• eliminate impetus <strong>for</strong> existing residents to migrate to new developments.<br />
Principle #29 − High Density / Mixed Use<br />
Encourage development of higher density mixed use to take advantage of existing infrastructure<br />
and services and enhance urbanized areas as a priority over development in rural areas.<br />
A detailed action plan which identifies nearly 200 long term action items to be considered to<br />
fur<strong>the</strong>r support implementation of <strong>the</strong> regional vision and which also describes regional goals<br />
and objectives to be considered <strong>for</strong> fur<strong>the</strong>r long term implementation ef<strong>for</strong>ts by local<br />
governments and o<strong>the</strong>rs is available under separate cover.<br />
Why is <strong>the</strong> Project Unique ?<br />
Many local governments in <strong>the</strong> <strong>Tri</strong>-<strong>County</strong> region participated in planning activities. While local<br />
governments have <strong>the</strong> ability to both plan <strong>for</strong> <strong>the</strong>ir own future land use vision and en<strong>for</strong>ce that<br />
vision through zoning, <strong>the</strong> <strong>Tri</strong>-<strong>County</strong> region does not have regional government and no regional<br />
land use en<strong>for</strong>cement authority exists. All land use decisions are made locally.<br />
Development of a shared regional land use vision through <strong>the</strong> “Regional Growth: Choices <strong>for</strong><br />
Our Future” project has created a unique focal point <strong>for</strong> cooperation by local governments to<br />
address issues which are greater than local concern. This ef<strong>for</strong>t has been selected as a national<br />
model of best practice in regional land use and transportation planning by federal officials and<br />
national professional organizations.<br />
Facing Issues Greater Than Local Concerns<br />
The <strong>Tri</strong>-<strong>County</strong> Regional Planning Commission acts in cooperation with local governments and<br />
can provide advice and planning assistance on issues of greater than local concern. Issues of<br />
greater than local concern include traffic congestion, groundwater protection, economic<br />
development, hazard mitigation and pollution prevention. These issues cross local government<br />
borders and cannot be effectively addressed alone by any one county, city or village. Ra<strong>the</strong>r, <strong>the</strong>y<br />
require cooperation among many adjacent jurisdictions to effectively address each issue. Issues<br />
of regional growth and development impact cities, suburbs and rural areas in different ways. The<br />
<strong>Tri</strong>-<strong>County</strong> “Regional Growth: Choices <strong>for</strong> Our Future” project has taken into account<br />
viewpoints from all areas of <strong>the</strong> region and has developed a shared vision of future regional<br />
growth patterns. While this regional plan is only advisory in nature, <strong>the</strong> in<strong>for</strong>mation is being<br />
presented to local governments <strong>for</strong> consideration to adopt portions of <strong>the</strong> Growth Project<br />
appropriate to <strong>the</strong>ir needs. The <strong>Tri</strong>-<strong>County</strong> “Regional Growth: Choices <strong>for</strong> Our Future”<br />
22
project is unique in that it attempts to develop a regional future land vision that takes into<br />
account <strong>the</strong> concerns of <strong>the</strong> entire region.<br />
Relationship to <strong>the</strong> Regional 2025 Transportation Plan<br />
The <strong>Tri</strong>-<strong>County</strong> “Regional Growth: Choices <strong>for</strong> Our Future” project is also unique in that it<br />
has been integrated in <strong>the</strong> <strong>Tri</strong>-<strong>County</strong> region’s transportation planning process. The <strong>Tri</strong>-<strong>County</strong><br />
Regional Planning Commission is responsible <strong>for</strong> transportation planning throughout <strong>the</strong> entire<br />
region.<br />
It is clear that land use and transportation are connected. A typical representation of this<br />
connectivity is shown in Figure 12 depicting <strong>the</strong> land use – transportation cycle. This typical<br />
representation of <strong>the</strong> land use-transportation cycle results in a near continuous need <strong>for</strong> costly<br />
roadway capacity expansion to accommodate new developments in suburban, fringe and rural<br />
areas of <strong>the</strong> region, while <strong>the</strong> existing built transportation system retains underutilized capacity.<br />
Figure 12: The Land Use – Transportation Cycle<br />
Changing Land<br />
Use<br />
New Development<br />
Opportunity<br />
Congestion<br />
Increased Capacity<br />
and Access<br />
Demand <strong>for</strong> Bigger<br />
and Better Roads<br />
Transportation<br />
Improvement<br />
23
By defining an agreed upon land use basis <strong>for</strong> regional transportation decision making which<br />
encourages new development in proximity to this underutilized capacity, <strong>the</strong> regional growth<br />
land use vision enhances <strong>the</strong> connection between land development and existing transportation<br />
system capacity, which reduces long term needs <strong>for</strong> future roadway expansion in rural areas<br />
throughout <strong>the</strong> region. By establishing land use policies which promote higher density, mixed<br />
use development in proximity to existing transportation infrastructure and services, future<br />
roadway capacity deficient lane miles are reduced to roughly half of what would o<strong>the</strong>rwise occur<br />
under current public land use policy. The result is long term tax savings on roadway expansion<br />
costs of between 1.8 and 4.8 billion dollars which would o<strong>the</strong>rwise be required if <strong>the</strong> current land<br />
use – transportation cycle continues unabated.<br />
By better integrating <strong>the</strong> regional land use vision in transportation planning, investments in <strong>the</strong><br />
existing system become better connected to future land development activity. This results in a<br />
more efficient transportation system and long term savings on road construction costs to local<br />
and state governments, taxpayers and <strong>the</strong> private sector.<br />
This connectivity has been rein<strong>for</strong>ced by adopting <strong>the</strong> shared regional land use vision as an<br />
integral component of <strong>the</strong> Regional 2025 Transportation Plan as approved by <strong>the</strong> Commission in<br />
March, 2003. In adopting <strong>the</strong> regional land use vision, <strong>the</strong> Commission made a finding that<br />
implementing <strong>the</strong> principles and policy map is necessary to protect public health, safety and<br />
welfare and is in keeping with <strong>the</strong>ir fiduciary responsibility to <strong>the</strong> taxpayers to use federal<br />
transportation dollars wisely and to establish priorities <strong>for</strong> use of federal transportation funds.<br />
In adopting <strong>the</strong> preferred vision through <strong>the</strong> Regional 2025 Transportation Plan, <strong>the</strong> Commission<br />
indicated its intent to consider whe<strong>the</strong>r future transportation project proposals are consistent with<br />
<strong>the</strong> policy map and principles (discussed above) as part of <strong>the</strong> process and criteria used to<br />
establish priorities <strong>for</strong> use of federal transportation funds.<br />
The Commission also indicated <strong>the</strong>ir intent to consider whe<strong>the</strong>r individual local governments and<br />
responsible transportation agencies have agreed to implement <strong>the</strong> policy map and principles as<br />
part of <strong>the</strong> criteria <strong>the</strong>y will consider when establishing priorities <strong>for</strong> future federally funded<br />
transportation projects and funding. Regional transportation goals and objectives were also<br />
reviewed as part of <strong>the</strong> growth project town <strong>for</strong>ums, to assure better linkage between land use<br />
and transportation goals. Transportation goals and objectives were modified to better reflect<br />
input received and <strong>the</strong> regional land use goals and objectives. Fur<strong>the</strong>r, regional land use<br />
principles were integrated throughout transportation plan goals, objectives, short and long term<br />
investment strategies, project selection criteria and elsewhere, and <strong>the</strong> Commission has certified<br />
that all projects contained in <strong>the</strong> Regional 2025 Transportation Plan are consistent with <strong>the</strong><br />
preferred regional land use vision.<br />
The Commission has also integrated results of this project as part of <strong>the</strong> federally required<br />
system to manage existing and future traffic congestion within <strong>the</strong> region. No federal<br />
24
transportation funds may be used to expand roadway capacity unless <strong>the</strong>y are <strong>for</strong> projects<br />
developed through this federally mandated and locally approved congestion management system.<br />
An important function of <strong>the</strong> <strong>Tri</strong>-<strong>County</strong> “Regional Growth: Choices <strong>for</strong> Our Future” project<br />
was to provide a generalized future land use plan on which regional transportation planning<br />
decisions can be based. In essence, <strong>the</strong> growth project provides an adopted land use basis on<br />
which to plan <strong>for</strong> future road and transit needs. The <strong>Tri</strong>-<strong>County</strong> Regional Planning<br />
Commission’s Regional 2025 Transportation Plan is based on <strong>the</strong> land use vision created in <strong>the</strong><br />
growth project. This process of <strong>for</strong>ming a relationship between regional land use planning and<br />
regional transportation planning has been recognized as a national model of best practice by<br />
federal officials.<br />
The Planning Phase of <strong>the</strong> Project is Closing<br />
Work from <strong>the</strong> planning phase has resulted in in<strong>for</strong>mation necessary <strong>for</strong> local units of<br />
government to take <strong>the</strong> next step and consider implementing portions of <strong>the</strong> project appropriate<br />
to <strong>the</strong>ir local planning goals through <strong>the</strong>ir comprehensive plans, zoning ordinances and o<strong>the</strong>r<br />
actions. Products are now being submitted to local governments, citizens and o<strong>the</strong>rs <strong>for</strong><br />
implementation and <strong>the</strong> <strong>Tri</strong>-<strong>County</strong> Regional Planning Commission will be convening a new<br />
Implementation Steering Committee and task <strong>for</strong>ces to focus on specific items contained in <strong>the</strong><br />
action and implementation plan resulting from this project. Project implementation will<br />
continue over <strong>the</strong> next several decades.<br />
Current Local Examples of Growth Project Implementation<br />
The following examples show how results of <strong>the</strong> growth project are already being applied to<br />
local community ef<strong>for</strong>ts.<br />
• Transportation Plan:<br />
As noted, <strong>the</strong> Regional 2025 Transportation Plan is based on <strong>the</strong> preferred land use<br />
alternative from <strong>the</strong> growth project and results are being applied as criteria in considering<br />
future priorities <strong>for</strong> federal transportation funds.<br />
• Various Transportation Planning Best Practice Citations:<br />
Both <strong>the</strong> Federal Highway Administration (FHWA) and <strong>the</strong> Federal Transit<br />
Administration (FTA) and o<strong>the</strong>r national transportation planning professional<br />
organizations have recognized <strong>the</strong> <strong>Tri</strong>-<strong>County</strong> regional growth project as a national<br />
model <strong>for</strong> linking land use and transportation decisions.<br />
• Implementation by Local Governments:<br />
Clinton <strong>County</strong>, <strong>the</strong> City of Mason, Delhi Township and o<strong>the</strong>r local governments have<br />
already used <strong>the</strong> project as a basis <strong>for</strong>, or to assist in developing, <strong>the</strong>ir own future<br />
comprehensive land use plans and zoning ordinances. Similar ef<strong>for</strong>ts are also in progress<br />
by several o<strong>the</strong>r local governments, including <strong>the</strong> City of <strong>Lansing</strong>.<br />
25
• Assisting Ingham <strong>County</strong> Planning Ef<strong>for</strong>ts:<br />
Since Ingham <strong>County</strong> does not have its own planning department, in<strong>for</strong>mation from <strong>the</strong><br />
growth project has been used to support implementing land use and environmental<br />
policies and programs of county government.<br />
• Implementation by MSU Extension Citizen Planner Program:<br />
The MSU Extension land use education program has drawn in<strong>for</strong>mation from <strong>the</strong> growth<br />
project to augment its basic training curriculum <strong>for</strong> planning and zoning officials.<br />
• Implementation in Hazard Mitigation Planning:<br />
Regional growth project data has served as <strong>the</strong> land use basis <strong>for</strong> developing a regionwide<br />
plan to reduce harm from natural disasters should <strong>the</strong>y occur in <strong>the</strong> <strong>Tri</strong>-<strong>County</strong> region.<br />
• Relationship to <strong>the</strong> Governor’s Land Use Leadership Council <strong>Report</strong>:<br />
Many recommendations from <strong>the</strong> regional growth project closely parallel suggestions <strong>for</strong><br />
state land use strategies in Governor Granholm’s 2003 Land Use Leadership Council<br />
<strong>Report</strong>. Materials from <strong>the</strong> project were made available to some members of <strong>the</strong> council<br />
as <strong>the</strong>y were deliberating. The ten principles of smart growth <strong>the</strong> Governor’s Council<br />
used as a basis <strong>for</strong> <strong>the</strong>ir recommendations (which also could become a basis <strong>for</strong><br />
establishing state land use goals) are very consistent with <strong>the</strong> “Regional Growth:<br />
Choices <strong>for</strong> Our Future” <strong>the</strong>mes and principles. The ten principles cited by <strong>the</strong><br />
Governor’s Council are:<br />
1. Create a range of housing opportunities and choices.<br />
2. Create walkable neighborhoods.<br />
3. Encourage community and stakeholder collaboration.<br />
4. Foster distinctive, attractive communities with a strong sense of place.<br />
5. Make development decisions predictable, fair and cost-effective.<br />
6. Mix land uses.<br />
7. Preserve open space, farmland, natural beauty and critical environmental<br />
areas.<br />
8. Provide a variety of transportation choices.<br />
9. Streng<strong>the</strong>n and direct development toward existing communities.<br />
10. Take advantage of compact development design.<br />
• O<strong>the</strong>r State Initiatives:<br />
In addition, recent activities like <strong>the</strong> statewide “Cool Communities” conference, <strong>the</strong><br />
Michigan Transporation Summit and <strong>the</strong> statewide “Designing Healthy, Liveable<br />
Communities” conferences are all focusing greater attention on land use issues in <strong>the</strong><br />
region and throughout Michigan. As a result of <strong>the</strong> “Regional Growth: Choices <strong>for</strong><br />
Our Future” ef<strong>for</strong>t, our region is well prepared to tap in to, and benefit from, <strong>the</strong>se<br />
broader statewide ef<strong>for</strong>ts. The <strong>Tri</strong>-<strong>County</strong> region is now positioned as <strong>the</strong> right place at<br />
<strong>the</strong> right time to benefit from <strong>for</strong>mulating a regional land use vision which ties directly to<br />
<strong>the</strong>se o<strong>the</strong>r statewide activities. The “Regional Growth: Choices <strong>for</strong> Our Future”<br />
26
process has demonstrated regional leadership in broad, consensus based land use decision<br />
making.<br />
• Opportunities <strong>for</strong> Unique Interagency Cooperation:<br />
The project allowed many unique interagency partnerships to develop. For example:<br />
cooperative ef<strong>for</strong>ts by <strong>the</strong> MSU Extension and <strong>the</strong> <strong>Tri</strong>-<strong>County</strong> Regional Planning<br />
Commission were substantially enhanced through this project. The organizations are<br />
jointly funding a unique staff position as a regional land use agent to assist in <strong>the</strong> project<br />
planning and implemention process. This partnership brought extensive resources and<br />
support from <strong>the</strong> MSU Extension program to assist in public involvement ef<strong>for</strong>ts<br />
throughout <strong>the</strong> project.<br />
• Land Use and Health Team: One of <strong>the</strong> local activities allied with <strong>the</strong> “Regional<br />
Growth: Choices <strong>for</strong> Our Future” project has been <strong>the</strong> Land Use and Health Team.<br />
The purpose of <strong>the</strong> Land Use and Health Team is to educate and engage <strong>the</strong> community<br />
regarding impacts of <strong>the</strong> built environment on health. The team consists of<br />
representatives from local planning departments, Michigan State University, businesses<br />
and public health agencies as facilitated by <strong>the</strong> Ingham <strong>County</strong> Health Department. As<br />
<strong>the</strong>re is a growing of body of evidence indicating that <strong>the</strong> design of <strong>the</strong> built environment<br />
impacts <strong>the</strong> physical and mental health of residents, <strong>the</strong> Land Use and Health Team<br />
cooperates with <strong>the</strong> <strong>Tri</strong>-<strong>County</strong> Regional Planning Commission in order to highlight<br />
health-related issues relevant to <strong>the</strong> Growth Project’s implementation. An example of<br />
this cooperation is highlighted in <strong>the</strong> Growth Project’s “Greenways and Walkability<br />
Principle” which states that trails and walkways can provide public health benefits by<br />
offering opportunities <strong>for</strong> physical activity. Public health experts suggest that increased<br />
opportunity <strong>for</strong> physical activity can result in a decreased risk of obesity, diabetes and<br />
poor heart health. Land use and health activities also support o<strong>the</strong>r growth project<br />
principles. The Land Use and Health Team coordinates many activities such as<br />
development of a health impact assessment tool <strong>for</strong> planners and <strong>the</strong> team’s work has<br />
been cited <strong>for</strong> model best-practice awards. More in<strong>for</strong>mation about <strong>the</strong> land use and<br />
health team can be found at <strong>the</strong> internet world wide web site<br />
www.cacvoices.org/environment.<br />
• Sub-Regional Cooperation Ef<strong>for</strong>ts:<br />
The growth project has provided numerous opportunities <strong>for</strong> city and township<br />
governments to plan toge<strong>the</strong>r <strong>for</strong> <strong>the</strong>ir combined growth and has provided numerous<br />
maps and o<strong>the</strong>r products to facilitate <strong>the</strong>se ef<strong>for</strong>ts throughout <strong>the</strong> region. In addition,<br />
TCRPC is using <strong>the</strong> adopted policy map and principles from <strong>the</strong> regional growth project<br />
as a foundation <strong>for</strong> commenting on local comprehensive plans and zoning changes under<br />
<strong>the</strong> Coordinated Planning Act and in o<strong>the</strong>r sub-regional planning ef<strong>for</strong>ts of <strong>the</strong> agency.<br />
Future Steps<br />
With <strong>the</strong> planning phase of <strong>the</strong> “Regional Growth: Choices <strong>for</strong> Our Future” project<br />
complete, what are <strong>the</strong> future steps <strong>for</strong> this project?<br />
27
Now that <strong>the</strong> planning team has completed <strong>the</strong>ir work, it is being presented in a regional<br />
leadership briefing and transmitted to each community so that local governments and<br />
organizations can consider how to best put <strong>the</strong> project into action consistent with local<br />
objectives.<br />
The project poster plan, this summary report, <strong>the</strong> final project report, transportation plan and<br />
o<strong>the</strong>r supporting materials will serve as primary vehicles <strong>for</strong> distributing growth project<br />
in<strong>for</strong>mation to <strong>the</strong> community. The final technical report provides additional technical detail on<br />
many aspects of <strong>the</strong> project.<br />
In<strong>for</strong>mation about this project is being “taken on <strong>the</strong> road” to local governments in <strong>the</strong> region so<br />
that <strong>the</strong> messages from <strong>the</strong> project can be carried directly to local communities. A “toolbox” of<br />
implementation ideas is also being considered to provide practical details to assist local<br />
communities and <strong>the</strong> region in bringing results of <strong>the</strong> project to fruition.<br />
Now that <strong>the</strong> planning portion of this project is complete, <strong>the</strong> <strong>Tri</strong>-<strong>County</strong> “Regional Growth:<br />
Choices <strong>for</strong> Our Future” project can enter into <strong>the</strong> important steps where local communities<br />
consider adopting <strong>the</strong> vision and principles as <strong>the</strong>ir own. Examples of what local communities<br />
are being asked to consider include:<br />
• Adopting a resolution of support from <strong>the</strong> legislative body <strong>for</strong> <strong>the</strong> <strong>the</strong>mes, principles and<br />
policy map;<br />
• Motion of support from planning commissions (where applicable);<br />
• Commitment from administration to utilize Themes and Principles as a check list;<br />
• Commitment of jurisdictions to participate in <strong>the</strong> implementation of <strong>the</strong> action plan;<br />
• Annual updates of <strong>the</strong> poster plan and wall plaques to identify endorsing communities;<br />
and<br />
• Hosting of training programs to educate citizens on <strong>the</strong> importance of <strong>the</strong> project.<br />
In addition, <strong>the</strong> <strong>Tri</strong>-<strong>County</strong> Regional Planning Commission is creating an Implementation<br />
Steering Committee and various task <strong>for</strong>ces (see Figure 13) to review, refine and finalize <strong>the</strong><br />
detailed action plan prepared to fur<strong>the</strong>r implement results of <strong>the</strong> project.<br />
This action plan lists seven vision statements (broad policy guidelines) <strong>for</strong> <strong>the</strong> region to achieve.<br />
These are:<br />
1. Promote preservation of <strong>the</strong> natural, non-renewable resources in <strong>the</strong> region.<br />
2. Utilize resources wisely and guide growth to achieve <strong>the</strong> regional vision.<br />
3. Promote and maintain a high quality of life <strong>for</strong> residents of <strong>the</strong> region.<br />
4. Encourage a regional approach to development and planning which includes interjurisdictional<br />
cooperation and coordination among <strong>the</strong> seventy-five jurisdictions<br />
and with Clinton, Eaton and Ingham Counties.<br />
5. Establish a regional approach to parks and recreation services that emphasize <strong>the</strong><br />
natural resources.<br />
28
6. Enhance <strong>the</strong> regional economic development engine to provide sustainable<br />
services and employment <strong>for</strong> current and future citizens.<br />
7. Include <strong>for</strong>malized, facilitated and broad-based public involvement in planning.<br />
These vision statements are <strong>the</strong>n fur<strong>the</strong>r defined in <strong>the</strong> action plan through nearly 200 specific<br />
implementation goals and objectives to fully integrate <strong>the</strong> vision in <strong>the</strong> fabric of regional life.<br />
The new Implementation Steering Committee and task <strong>for</strong>ces will be charged to identify<br />
priorities on <strong>the</strong>se action steps, develop work plans, budgets, schedules and identify responsible<br />
agencies to accomplish each of <strong>the</strong>se goals and objectives.<br />
Examples of goals and objectives from <strong>the</strong> action plan shown below are related to wise growth<br />
vision statement (item 2, above).<br />
29
Figure 13: Transition from Planning to Action<br />
"Regional Growth: Choices <strong>for</strong> Our Future" Project<br />
Future Plans <strong>for</strong> Steering Committee Transition<br />
"Existing"<br />
Steering<br />
Committee<br />
turns into<br />
"New"<br />
Implementation<br />
Steering Committee<br />
Explanation of Plan<br />
1. "Existing" Steering Committee turns into "New" Implementation Steering Committee<br />
2. Proposed Functions of "New" Implementation Steering Committee.<br />
Organization of Implementation Task Forces<br />
Coordination of Implementation Activities/Agencies<br />
Accountability to Local Units of Government<br />
Finance and Resources<br />
30<br />
3. Implementation Coordinating Council<br />
Chairs and Vice Chairs of Task Forces and existing Transportation Committees - leaders<br />
recruited from Stakeholders<br />
4. Task Forces<br />
Topics <strong>for</strong> Task Forces to be determined by "New" Implementation Steering<br />
Committee:<br />
-Funding<br />
-Public Involvement & Education<br />
-Natural Resources & Parks and Recreation<br />
-Wise Growth, Regional Approach, Economic Development & Quality of Life<br />
Coordinating<br />
Council<br />
Task <strong>for</strong>ce members recruited from existing growth project participants and new<br />
members (as appropriate by topic area), identify priorities on action steps,<br />
schedules, develop work plans and budgets, and identify responsible agencies to<br />
implement action steps developed by Regional Growth Project<br />
<strong>Tri</strong>-<strong>County</strong> Regional Planning Commission<br />
Version #4: March 10, 2005<br />
Funding<br />
Public<br />
Involvement<br />
& Education<br />
Natural<br />
Resources &<br />
Parks and<br />
Recreation<br />
Wise Growth, Regional Approach,<br />
Economic Development & Quality of Life
Vision: Utilize resources wisely and guide growth to achieve <strong>the</strong> regional vision.<br />
Goal<br />
Site regional public facilities, services and major developments in population centers in<br />
or adjacent to existing infrastructure and service areas.<br />
Objectives:<br />
• Cooperate on a regional basis in developing public facilities.<br />
• Locate public facilities in proximity to public transit.<br />
Goal<br />
Discourage large lot, low density as a primary zoning category.<br />
Objectives:<br />
• Provide incentives (density bonuses, special assessment districts, etc.) <strong>for</strong> cluster<br />
development and Planned Unit Developments (PUD).<br />
• Change zoning ordinances to limit low-density, single family as a use by right.<br />
• Implement state and local access management guidelines to preserve <strong>the</strong><br />
transportation network and community character along collector and arterial<br />
roads.<br />
Goal<br />
Encourage high density development in areas served by public utilities.<br />
Objectives:<br />
• Encourage urban service boundaries.<br />
• Develop local design and community character guides to ensure quality in high<br />
density development.<br />
• Revise ordinances and regulations to pass <strong>the</strong> true installation and long term<br />
maintenance costs on to property owners requesting utility expansion.<br />
• Coordinate new development with transit.<br />
31
Final Focus Group Results<br />
As part of finalizing <strong>the</strong> planning phase of <strong>the</strong> Regional Growth project, planners conducted a<br />
series of focus groups in May, 2004 which ga<strong>the</strong>red opinions from a random sample of citizens<br />
from urban, suburban and rural areas of <strong>the</strong> region and leaders from throughout <strong>the</strong> region<br />
concerning <strong>the</strong>ir preferences <strong>for</strong> implementing results of <strong>the</strong> project.<br />
Some key results of <strong>the</strong>se focus groups are listed below.<br />
• Of participants, 92 percent voted “yes” to <strong>the</strong> question “should <strong>the</strong> region implement<br />
<strong>the</strong> vision,” <strong>the</strong> final question posed to each group. Citizens responding “yes” total 94<br />
percent. Leaders totaled 88 percent “yes votes.” Figure 14 shows <strong>the</strong> final results of this<br />
vote.<br />
Figure 14: Focus Group Results:<br />
<strong>Tri</strong>-<strong>County</strong> Regional Growth Project: Choices For Our Future<br />
May 2004 Focus Group Results<br />
Should <strong>the</strong> Region Implement <strong>the</strong> Vision ?<br />
Public & Leadership Response<br />
No<br />
8%<br />
Yes<br />
92%<br />
32
The following bullets summarize key results to general feedback received on <strong>the</strong> project, as<br />
based on a zero to ten scale, with zero to one representing “Not at All Important,” four to six<br />
representing “Moderately Important” and nine to ten representing “Crucial/Very Important.”<br />
The scores shown below represent <strong>the</strong> average response to key questions posed to leaders and<br />
randomly selected citizens stratified based on geographic area types.<br />
• On <strong>the</strong> question “How important is it that neighboring governments and special<br />
districts work toge<strong>the</strong>r to implement <strong>the</strong> regional vision?” − leaders averaged a 7.6<br />
score and citizens averaged a 9.4.<br />
• On <strong>the</strong> question “How important is it that neighboring governments and special<br />
districts work toge<strong>the</strong>r to coordinate planning ef<strong>for</strong>ts?” − citizens averaged a 9.6 and<br />
leaders averaged an 8.4.<br />
• On <strong>the</strong> question “How much priority do you place on implementation of <strong>the</strong> regional<br />
vision?” − leaders averaged a 7.1, while citizens averaged an 8.5.<br />
• On <strong>the</strong> question “How important is it that your community financially support <strong>the</strong><br />
implementation of <strong>the</strong> regional vision?” − citizens averaged 8.3, leaders a 5.9.<br />
• On <strong>the</strong> question “To what degree do you support implementation of this vision?” −<br />
citizens averaged an 8.6 and leaders averaged a 7.4.<br />
• A consistent pattern emerged on all of <strong>the</strong>se questions among <strong>the</strong> three citizen groups,<br />
with <strong>the</strong> strongest support shown in urban residents, followed in order by suburban/fringe<br />
and rural residents.<br />
• On average, on a zero to ten point scale, with 10 being highest, leaders’ average levels of<br />
understanding <strong>for</strong> all 29 principles was 9.08. For citizens, this level of average<br />
understanding was 8.79.<br />
• Average levels of agreement with <strong>the</strong> 29 principles was 8.07 among leaders, 8.28 among<br />
citizens.<br />
• Among leaders, <strong>the</strong> average level of agreement to <strong>the</strong> question “To what level does <strong>the</strong><br />
regional vision map correspond with your vision of how <strong>the</strong> region should grow?” −<br />
was 7.6 on a zero to ten point scale. Among citizens, this average was 7.1<br />
These key findings in focus groups are also summarized in Figure 15, and are extremely<br />
supportive of consensus reached on <strong>the</strong> regional vision’s policy map and principles among<br />
citizens and area leaders alike.<br />
33
Figure 15: Comparing Leader & Citizen Focus Group: Implementing Regional Vision<br />
Comparing Leader and Citizen Focus Groups: Implementing Regional Vision<br />
10<br />
9<br />
8<br />
7<br />
7.6<br />
9.4<br />
8.4<br />
9.6<br />
7.1<br />
8.5<br />
8.3<br />
7.4<br />
8.6<br />
9.08<br />
8.79<br />
8.07<br />
8.28<br />
7.6<br />
7.1<br />
6<br />
5.9<br />
Average<br />
5<br />
4<br />
3<br />
2<br />
1<br />
0<br />
Work toge<strong>the</strong>r to implement<br />
Neighbors coordinate planning<br />
Priority to implement<br />
Financially support<br />
Degree of support<br />
Understanding principles<br />
Agree with principles<br />
Policy map = vision<br />
Leader Average<br />
Citizen Average<br />
34
How will <strong>the</strong> Region Look Different If We Implement <strong>the</strong> Regional Vision?<br />
A portion of time spent by <strong>the</strong>se focus groups offered visual depictions which portrayed ranges<br />
of design choices or options <strong>for</strong> how <strong>the</strong> region will grow if current trends continue, in contrast<br />
to how <strong>the</strong> region will look if we implement <strong>the</strong> policy map, <strong>the</strong>mes and principles summarized<br />
in this report. Participants were asked to actually vote <strong>for</strong> which images of <strong>the</strong>se design choices<br />
<strong>the</strong>y preferred.<br />
Results from <strong>the</strong> visual choice voting in <strong>the</strong>se focus groups generally showed that <strong>the</strong> majority of<br />
all leaders and citizens were on <strong>the</strong> upper end of a one to four scale (where one is <strong>the</strong> lowest) <strong>for</strong><br />
moderate to aggressive urban design options associated with implementing <strong>the</strong> regional land use<br />
vision and principles.<br />
Put ano<strong>the</strong>r way, gauging leaders or citizens’ support <strong>for</strong> moderate to aggressive implementation<br />
of design choices consistent with <strong>the</strong> regional land use principles would typically fall in <strong>the</strong> 65-<br />
70 percentile range, with citizens having a slightly greater likelihood of being near <strong>the</strong> top of this<br />
range and leaders nearer to <strong>the</strong> lower end of this range.<br />
These results are broadly consistent with consensus shown on o<strong>the</strong>r elements of <strong>the</strong> regional<br />
vision using o<strong>the</strong>r measures provided in <strong>the</strong> focus gorups and o<strong>the</strong>r public involvement ef<strong>for</strong>ts<br />
throughout <strong>the</strong> project.<br />
The images shown below depict some of <strong>the</strong>se “Choices” <strong>for</strong> different parts of <strong>the</strong> region, as<br />
examples of how things will look differently if we implement <strong>the</strong> “Wise Growth”<br />
recommendations of <strong>the</strong> “Regional Growth: Choices <strong>for</strong> Our Future” project.<br />
If pictures are worth a thousand words, <strong>the</strong> following images have been selected to give citizens<br />
and leaders a chance to visualize how areas of <strong>the</strong> region will look differently if we develop<br />
design options based on <strong>the</strong> land use policy map and <strong>the</strong>mes and principles discussed in this<br />
summary, in contrast to how we will look if current trends continue.<br />
The images below are intended to illustrate examples of key concepts associated with <strong>the</strong>se<br />
alternative future choices and design options.<br />
Which images do you prefer <strong>for</strong> <strong>the</strong> region’s future and <strong>for</strong> your children and grandchildren?<br />
35
Figure 16 shows <strong>the</strong> existing rural land use pattern which is typically developed as rural strip<br />
residential. Figures 17 and 18 show environmental preservation and agriculture land<br />
preservation. These alternatives can be enhanced using clustered development patterns on <strong>the</strong><br />
urban fringe, as proposed on <strong>the</strong> adopted policy map, and as shown in Figure 19.<br />
Figure 16: Rural Strip Residential<br />
Figure 17: Environmental Preservation<br />
Figure 18: Agriculture Preservation<br />
Figure 19: Cluster Development<br />
36
Figure 20 shows typical large lot single family residential as it is developing today. Figure 21<br />
depicts how higher density single family residential might look in focused growth areas under<br />
<strong>the</strong> preferred regional land use vision.<br />
Figure 20: Large Lot Residential<br />
Figure 21: Higher Density Residential in Focused Growth <strong>Area</strong>s<br />
37
These figures show development in <strong>the</strong> urban core if current trends (like strip commercial)<br />
continue in contrast to higher density commercial infill and mixed use redevelopment. High<br />
density mixed use and infill development provide choices which streng<strong>the</strong>n <strong>the</strong> urban core under<br />
<strong>the</strong> adopted land use alternative.<br />
Figure 22: Strip Commercial<br />
Figure 23: High Density Infill<br />
Figure 24: Strip Commercial<br />
Figure 25: High Density Mixed Use<br />
Redevelopment<br />
38
Figures 26 and 27 contrast single family residential development in smaller communities as <strong>the</strong>y<br />
are developing today with similar housing in higher density traditional village developments,<br />
which help to preserve agriculture land and open spaces. Redeveloping smaller communities<br />
with higher density traditional village developments will support smaller communities’ long term<br />
economic viability, as well as providing more af<strong>for</strong>dable housing, employment and<br />
transportation options.<br />
Figure 26: Small Urban/Village Single Family Residential<br />
Figure 27: Higher Density Traditional Village Residential Development<br />
39
Figures 28 and 29 contrast a typical traditional suburban residential design with a clustered<br />
development site plan, which might occur on <strong>the</strong> suburban fringe under <strong>the</strong> Wise Growth option,<br />
which also preserves open space and agriculture lands.<br />
Figure 28: Traditional Suburban Development<br />
Figure 29: Higher Density Clustered Development<br />
40
Figures 30 and 31 contrast traditional suburban development on <strong>the</strong> fringe to a mixed use site<br />
plan. Mixed use provides close to home shopping, work and recreational opportunities at higher<br />
densities with lower transportation costs.<br />
Figure 30: Traditional Suburban Development<br />
Figure 31: Mixed Use<br />
41
PROJECT ADVISORY COMMITTEE MEMBERS<br />
Persons listed below served on <strong>the</strong> “Regional Growth: Choices <strong>for</strong> Our Future” Steering and<br />
Stakeholder Committees between 2000 and 2005 and include both delegates and alternates. An<br />
asterisk indicates current delegates and alternates.<br />
Steering Committee<br />
Harold Leeman, Jr.*, Chair<br />
Larry Martin*<br />
Phil Chisholm*<br />
Mark Meadows*<br />
J. William Hawes*<br />
David Wilson*<br />
Andy Schor<br />
Dianne Holman*<br />
William Rieske*<br />
John Pearson*<br />
John Czarnecki<br />
Stakeholders Committee<br />
Ingham <strong>County</strong><br />
Gerald Ambrose,* Chair<br />
Aurelius Township<br />
Craig Iansiti*<br />
Larry Silsby*<br />
Bath Community Schools<br />
Susan Bolton*<br />
Rick Oberle<br />
Paul Roney<br />
Summer Hallwood<br />
Renee Farnum<br />
Marsha Small*<br />
Andrew Such*<br />
Earl Barks*<br />
Larry Horstman<br />
Ben Munger<br />
Jerry Ambrose* (ex officio), Stakeholders Chair<br />
Jeff Oesterle* (ex officio), Stakeholders Vice Chair<br />
Michigan Works!<br />
Michael Quinn<br />
Doug Stites*<br />
Steven Leiby<br />
Capital <strong>Area</strong> United Way<br />
Paul McConaughy<br />
Capitol Excavating & Paving Company<br />
George Hayhoe*<br />
Bingham Township<br />
Harold Rappuhn*<br />
Steve Schafer*<br />
Clinton <strong>Area</strong> Planning <strong>for</strong> Intergovernmental<br />
Teamwork (CAPIT)<br />
Barry Dean*<br />
Capital Region Airport Authority<br />
Daniel Otto*<br />
Thomas Schmidt<br />
Mike Lynn*<br />
Capitol Transport L.L.C. (Spartan & Yellow<br />
Cab)<br />
Ronald Salmon*<br />
42
Capital <strong>Area</strong> Transportation Authority<br />
(CATA)<br />
Mark Fedorowicz<br />
Tim Rosenboom<br />
Bradley Funkhouser<br />
Debbie Alexander*<br />
Frank Davis*<br />
City of Charlotte Chamber of Commerce<br />
Ann Garvey*<br />
Ken Wirt*<br />
City of DeWitt<br />
Clif<strong>for</strong>d Flood<br />
Gregory Kolankowski<br />
City of East <strong>Lansing</strong><br />
Robert Owen, Jr.*<br />
James van Ravensway*<br />
City of East <strong>Lansing</strong> Central Neighborhood<br />
Jim Ludwig*<br />
City of East <strong>Lansing</strong> Recreation & Arts<br />
James Crisp*<br />
Dana Meyer<br />
Nicole Fisher<br />
Mary Jo Pangborn*<br />
City of Grand Ledge<br />
Susan Stachowiak<br />
David Rich<br />
Larry LaHaie*<br />
Jon Bayless*<br />
City of <strong>Lansing</strong><br />
William Rieske*<br />
Donna Wynant*<br />
City of <strong>Lansing</strong> Eastside Neighborhood<br />
Organization<br />
Richard Kibbey*<br />
City of <strong>Lansing</strong> Economic Development<br />
Corporation<br />
Tracy Carney-Miller*<br />
Karl Dorshimer*<br />
City of <strong>Lansing</strong> Parks & Recreation<br />
Phil Dorland*<br />
Eric Reickel<br />
Murdock Jemerson*<br />
Tanya Moore*<br />
City of Mason Downtown Development<br />
Authority<br />
Mark Howe<br />
Phil Birdsall*<br />
Tim Gaylord*<br />
Mark Howe<br />
City of St. Johns<br />
Cindy Warda*<br />
Jon Mills<br />
Dan Vreibel*<br />
City of St. Johns Parks & Recreation<br />
Joseph Yurek<br />
Paul McNamara<br />
Robert Wood*<br />
City of Mason<br />
Martin Colburn*<br />
Bill Potter*<br />
Jim Lyon<br />
James Howard*<br />
43
City of Williamston<br />
Thomas Coleman<br />
Kathy Steenbrenner<br />
Lynn Wilson*<br />
Clinton Conservation District<br />
Bill Lasher*<br />
Virginia Zeeb*<br />
Clinton <strong>County</strong> Central Dispatch<br />
James Fyvie*<br />
Ellen Luttig*<br />
Clinton <strong>County</strong> Drain Commission<br />
Tom O’Bryant*<br />
Phil Hanses*<br />
Clinton <strong>County</strong> Farm Bureau<br />
Virginia Zeeb*<br />
Clinton <strong>County</strong> Planning & Zoning<br />
Peter Preston*<br />
Clinton <strong>County</strong> Road Commission<br />
Michael Nobach*<br />
Daniel Vreibel<br />
Coldwell Banker<br />
Valerie Ferrero Lafferty*<br />
CB Richard Ellis<br />
Valerie Ferrero Lafferty<br />
Ron Haas*<br />
Consumers Energy<br />
Ernest Sakraska<br />
Don Anderson*<br />
Chris Thelen*<br />
Dart Bank<br />
Ronald Rhoades*<br />
Rollin Dart*<br />
Mark Howe*<br />
Delhi Charter Township<br />
Rick Royston<br />
John Elsinga<br />
Darrell Fecho<br />
Al McFadyen*<br />
Delta Charter Township<br />
Gary Bozek*<br />
DeWitt Charter Township<br />
John Hodges<br />
Jeffrey Gray*<br />
Seth Weldon*<br />
Eaton <strong>County</strong><br />
Janice Tower<br />
Rich Trent<br />
Susan Pigg<br />
Claudine Hannold*<br />
Jon Pfiester*<br />
Eaton <strong>County</strong> 911 Central Dispatch<br />
Paul Rodgers*<br />
Deb Martin<br />
Eaton <strong>County</strong> Farm Bureau<br />
Duane Tirrell<br />
Jon Pfiester<br />
Gary Pruden*<br />
Jim Orr*<br />
Thomas M. Cooley Law School<br />
Cherie Beck*<br />
44
Eaton <strong>County</strong> Parks & Recreation<br />
Commission<br />
Steve Tuma<br />
Pat Witte<br />
Dan Patton*<br />
Jackie Blanc*<br />
Eaton <strong>County</strong> Road Commission<br />
Blair Ballou*<br />
John Moore<br />
Fred Marquardt*<br />
Eaton <strong>County</strong> Sheriff Department<br />
Richard Whitacre*<br />
Joseph Jager<br />
Brian Peacock*<br />
Federal Highway Administration<br />
Cindy Durrenberger*<br />
City of Grand Ledge <strong>Area</strong> Chamber of<br />
Commerce<br />
Steve Krumm*<br />
Ron Nichols<br />
Jon Bayless*<br />
Greater <strong>Lansing</strong> Association of Realtors<br />
Gilbert M. White*<br />
Greater <strong>Lansing</strong> Convention & Visitor’s<br />
Bureau<br />
Tom Galyon<br />
Lee Hladki*<br />
Greater <strong>Lansing</strong> Home Builders Association<br />
Tim Ellis*<br />
Greater <strong>Lansing</strong> Urban League<br />
Deanna Edwards<br />
Cleophus Boyd, Jr.<br />
Groundwater Management Board (GMB)<br />
Richard Kranz<br />
Bob Godbold<br />
Ingham <strong>County</strong><br />
Jerry Ambrose,* Chair<br />
Darnell Early<br />
Jared Cypher*<br />
Teri Younger*<br />
Ingham Conservation District<br />
Susan Tangora<br />
Becky Henne<br />
Alicia Schmidt<br />
Chris Corgan*<br />
Ingham <strong>County</strong> EDC<br />
Tom Jarosch<br />
Tom Coleman<br />
John Pierson<br />
Ingham <strong>County</strong> Farm Bureau<br />
Loretta Benjamin<br />
Janet Lyon*<br />
Jeff Oesterle,* Vice Chair<br />
Ingham <strong>County</strong> Health Department<br />
Robert Godbold<br />
Robert Glandon*<br />
Jim Wilson*<br />
Ingham <strong>County</strong> Parks Department<br />
Robert Moore*<br />
Ronald Eggleston<br />
Julie Pelletier<br />
Ingham <strong>County</strong> Road Commission<br />
June Pallottini<br />
Robert D’Alcorn<br />
Larry Smith*<br />
John Midgley*<br />
45
Ingham <strong>County</strong> Sheriff’s Office<br />
Allan Spyke*<br />
James Reed<br />
Keystone Design Group<br />
James Aubuchon*<br />
Russell Hinkle*<br />
<strong>Lansing</strong> Board of Water & Light<br />
Sue McCormick<br />
Randall Roost*<br />
Calven Jones*<br />
<strong>Lansing</strong> Community College<br />
Baldemero (Bo) Garcia*<br />
<strong>Lansing</strong> Neighborhood Council<br />
Carol Wood*<br />
<strong>Lansing</strong> Regional Chamber of Commerce<br />
Gretchen Courand<br />
Summer Hallwood<br />
Rich Trent<br />
John Pearson*<br />
Carolyn Towsley*<br />
League of Michigan Bicyclists<br />
Lucinda Means<br />
LINC<br />
Vance Kincaid II<br />
Patricia Hagen<br />
John Anderson*<br />
Joyce Grover*<br />
Mason <strong>Area</strong> Chamber of Commerce<br />
Bill Potter*<br />
Wayne Flood*<br />
George Hayhoe<br />
Meridian Township Parks<br />
Wendy Wilmers Longpre<br />
LuAnn Maisner*<br />
Meridian Charter Township<br />
Mark Kieselbach*<br />
Michigan Department of Transportation<br />
Geralyn Ayers*<br />
Pamela Boyd<br />
Sandra Cornell-Howe*<br />
Raymond Lenze*<br />
Michigan Energy Resources Division<br />
John Sarver*<br />
Michigan Environmental Council<br />
Holly Madill<br />
Julie Stoneman<br />
Dusty Fancher<br />
Conan Smith*<br />
Michigan State University<br />
Rex LaMore*<br />
John Melcher*<br />
Leroy Harvey<br />
Jose Gomez*<br />
Michigan State University Division of<br />
Campus Parks and Planning<br />
Steven Hadersbeck*<br />
Jeff Kacos*<br />
Mid-Michigan District Health Department<br />
Gary LaPorte<br />
Christine Nelson<br />
George Roux*<br />
Dale Ladouceur<br />
Michael Patterson*<br />
46
Mid-Michigan Environmental Action Council<br />
Donald Vanacker<br />
Gloria Miller*<br />
Kerrin O’Brien*<br />
Mid-Michigan Water Authority<br />
Clyde Dugan<br />
Susan McCormick<br />
Michigan State University Extension/Ingham<br />
<strong>County</strong><br />
Joseph Lessard<br />
Mark Hansen*<br />
Betsy Dierberger*<br />
NAACP<br />
Evin Fobbs<br />
Jenna Smith*<br />
Fifth Third Bank<br />
William Coultas*<br />
Rails-to-Trails Conservancy<br />
Nancy Krupiarz*<br />
Barry Culham*<br />
Red Team Inc.<br />
Rob Lewis<br />
Bob Trezise<br />
Riley Township Land Use Planning<br />
Committee<br />
Roger Thelen*<br />
Donald Potts<br />
Mike Martin*<br />
<strong>Tri</strong>-<strong>County</strong> Aging Consortium<br />
Roxanna Peterson<br />
Donna Hobart*<br />
Marion Owen*<br />
<strong>Tri</strong>-<strong>County</strong> Regional Planning Commission<br />
Jon Coleman*<br />
Paul Hamilton*<br />
U.S. Geological Survey<br />
Steve Aichele*<br />
Vevay Township<br />
Jeff Oesterle, Vice Chair<br />
John Cady*<br />
Ronald Weesies*<br />
George Hayhoe<br />
Watertown Township<br />
Jennifer Tubbs Sims*<br />
Webberville Community Schools<br />
Dr. Therese Peterson*<br />
Windsor Charter Township<br />
Kern Slucter<br />
John Hall<br />
Inge Kyler<br />
Rick Borucki*<br />
47
ACKNOWLEDGEMENTS<br />
(Consultant Team Members)<br />
• HNTB of Michigan (Prime Contractor)<br />
The Planning and Zoning Center (Subconsultants)<br />
Rossman-Martin Associates (Subconsultants)<br />
EPIC-MRA, Inc. (Subconsultants)<br />
• Parsons Transportation Group (Travel Demand Modeling Consultants)<br />
KJS Associates (Subconsultants)<br />
• Gove & Associates (Evaluation Consultants)<br />
TEA, Inc. (Subconsultants)<br />
Advanced Data Associates (Subconsultants)<br />
48
COMMISSION MEMBERS<br />
TRI-COUNTY REGIONAL PLANNING COMMISSION<br />
CLINTON COUNTY<br />
Russel Bauerle<br />
Larry Martin, Treasurer<br />
David Pohl<br />
John Arehart, Ex-Officio<br />
EATON COUNTY<br />
Philip Chisholm, Secretary<br />
J. William Hawes<br />
Alvin Kempf<br />
Fred Marquardt<br />
Mark Smuts<br />
Leonard Peters, Ex Officio<br />
INGHAM COUNTY<br />
Dianne Holman<br />
Susan McGillicuddy, Vice Chair<br />
Bill Sharp<br />
Larry Smith<br />
Marc Thomas<br />
Mark Grebner, Ex-Officio<br />
CITY OF LANSING<br />
Harold Leeman<br />
Larry Meyer<br />
Ralph Monsma<br />
Shirley M. Rodgers, Chair<br />
Carol Wood<br />
Tony Benavides, Ex Officio<br />
MICHIGAN DEPARTMENT<br />
OF TRANSPORTATION<br />
Marsha Small<br />
REGULAR STAFF<br />
Jon W. Coleman, Executive Director<br />
Paul T. Hamilton, Chief Transportation Planner<br />
Stephen Skinker, Transportation Planner<br />
Naresh Kotari, Senior Travel Demand Modeler<br />
Laura Tschirhart, GIS Transportation Specialist<br />
Dan Dillinger, In<strong>for</strong>mation Systems Planner<br />
Carrie Clinkscales, Executive Assistant<br />
Maria Habba, Secretary/Receptionist<br />
Greg Hoffman, Financial Coordinator<br />
Christine Hnatiw, Economic Development Planner<br />
Christine Spitzley, Environmental Programs Planner<br />
Jack Rozdilsky, MSUE Land Use Agent<br />
David Murray, Planning Technician<br />
Stephanie Geiger, Water Festival Coordinator*<br />
* Part-time<br />
Steering Committee<br />
Harold Leeman, Chair<br />
Earl Barks<br />
Philip Chisholm<br />
J. William Hawes<br />
Larry Martin<br />
Mark Meadows<br />
Marsha Small<br />
John Pearson<br />
William Rieske<br />
Dianne Holman<br />
Andrew Such<br />
David Wilson<br />
Gerald Ambrose*, Stakeholders Committee Chair<br />
Jeff Oesterle*, Stakeholders Committee Vice-Chair<br />
* Ex officio<br />
<strong>Report</strong> prepared by:<br />
Jon Coleman, Executive Director<br />
Paul Hamilton, Chief Transportation Planner<br />
Jack Rozdilsky, MSUE Land Use Agent<br />
Laura Tschirhart, GIS Transportation Specialist<br />
49