I-95 CORRIDOR COALITION VEHICLE PROBE PROJECT
I-95 CORRIDOR COALITION VEHICLE PROBE PROJECT
I-95 CORRIDOR COALITION VEHICLE PROBE PROJECT

You also want an ePaper? Increase the reach of your titles
YUMPU automatically turns print PDFs into web optimized ePapers that Google loves.
I-<strong>95</strong> Corridor Coalition<br />
I-<strong>95</strong> Corridor Coalition Vehicle<br />
Probe Project: Validation of<br />
INRIX Data<br />
Monthly Report<br />
Maryland<br />
April 2010
I-<strong>95</strong> <strong>CORRIDOR</strong> <strong>COALITION</strong><br />
<strong>VEHICLE</strong> <strong>PROBE</strong> <strong>PROJECT</strong>:<br />
VALIDATION OF INRIX DATA<br />
APRIL 2010<br />
Monthly Report<br />
Prepared for:<br />
I-<strong>95</strong> Corridor Coalition<br />
Sponsored by:<br />
I-<strong>95</strong> Corridor Coalition<br />
Prepared by:<br />
Ali Haghani, Masoud Hamedi, Kaveh Farokhi Sadabadi<br />
University of Maryland, College Park<br />
Acknowledgements:<br />
The research team would like to express its gratitude for the assistance it received from the<br />
state highway officials in Delaware, Maryland, New Jersey, North Carolina, Virginia, and<br />
Pennsylvania during the course of this study. Their effort was instrumental during the data<br />
collection phase of the project. This report would not have been completed without their<br />
help.<br />
April 2010<br />
I-<strong>95</strong> Corridor Coalition Vehicle Probe Project Evaluation 1<br />
April 28, 2010
Evaluation Results for the State of Maryland<br />
Executive Summary<br />
Travel time samples were collected along approximately 16 miles of freeways and three<br />
miles of arterials in Maryland beginning on Tuesday, February 2, 2010 and compared with<br />
travel time and speed data reported by INRIX as part of the I-<strong>95</strong> Vehicle Probe project.<br />
Due to unprecedented snowstorms in the study area which began on Friday, February 5,<br />
traffic volumes on area roadways substantially dropped and later some roads were closed to<br />
traffic due to white-out conditions. This setting lasted until Tuesday, February 9, 2010 and<br />
produced conditions in which hourly vehicular traffic was well below 500 in each direction<br />
on all area roadways. Therefore, validation was not performed on data during these snow<br />
days. The decision was made on a case by case basis as to when snow started to have its<br />
disruptive effect on the traffic on any given segment and when traffic started to get back on<br />
the road. The validation data represents approximately 770 hours of observations along 10<br />
freeway segments in Maryland, six of which are standard TMC segments and the other four<br />
are path segments comprised of multiple standard TMC segments.<br />
ES Table 1, below summarizes the results of the comparison between the validation data<br />
and the INRIX data for freeway segments for the same period. As shown, both the average<br />
absolute speed error and speed error bias were within specification for all speed bins.<br />
Even when errors are measured as a distance from the mean, INRIX data quality is deemed<br />
as satisfactory based on the same requirements.<br />
ES Table 1 - Maryland Evaluation Summary<br />
State<br />
0-30 MPH<br />
30-45 MPH<br />
45-60 MPH<br />
> 60 MPH<br />
All Speeds<br />
Avg Absolute Speed Error<br />
(
ES Table 2 - Maryland - Cummulative to Date<br />
State<br />
Avg Absolute Speed Error<br />
(
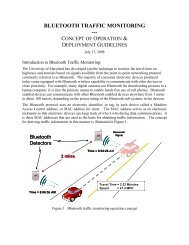
miles as well as 3 miles of arterials. Since some TMC segments in this corridor are less<br />
than one mile long, when appropriate, consecutive TMC segments are combined to form<br />
path segments longer than one mile. In this document results of validation performed on ten<br />
freeway segments are reported; six of which are standard TMC segments and the other four<br />
are path segments combined from multiple standard TMC segments. The coordinates of the<br />
locations at which the Bluetooth sensors were deployed throughout the state of Maryland<br />
are highlighted in Table 2. It should be noted that the configuration of consecutive TMC<br />
segments is such that the endpoint of one TMC segment and the start point of the next<br />
TMC segment are overlapping, so one Bluetooth sensor in that location is covering both<br />
TMC segments.<br />
Finally, Table 3 summarizes the segment definitions used in the validation process and also<br />
presents the distances that have been used in the estimation of Bluetooth speeds based on<br />
travel times. Details of the algorithm used to estimate equivalent path travel times based on<br />
INRIX feeds for individual TMC segment are provided in a separate report titled<br />
“Estimation of Travel Times for Multiple TMC Segments” (dated February 2010) and<br />
available on the I-<strong>95</strong> Corridor Coalition website. This algorithm finds an equivalent INRIX<br />
travel time (and therefore travel speed) corresponding to each sample Bluetooth travel time<br />
observation on the path segment of interest.<br />
Analysis of Results<br />
Table 4 summarizes the data quality measures obtained as a result of comparison between<br />
Bluetooth and all reported INRIX speeds. In all speed bins, INRIX data meets the data<br />
quality measures set forth in the contract when errors are measured as a distance from the<br />
1.96 times the standard error band. Even when errors are measured as a distance from the<br />
mean, INRIX data quality is deemed as satisfactory based on the same requirements.<br />
Table 5 shows the percentage of the time intervals that fall within 5 mph of the SEM band<br />
and the mean for each speed bin for all TMC segments in Maryland. Tables 6 and 7 present<br />
detailed data for individual TMC segments in Maryland in similar format as Tables 4 and 5<br />
respectively.<br />
Figures 2 and 3 show the overall speed error biases for different speed bins, and the<br />
average absolute speed errors for all validation segments in Maryland, respectively. These<br />
figures correspond to Table 4.<br />
I-<strong>95</strong> Corridor Coalition Vehicle Probe Project Evaluation 4<br />
April 28, 2010
Figure 1<br />
TMC segments selected for validation in Maryland<br />
I-<strong>95</strong> Corridor Coalition Vehicle Probe Project Evaluation 5<br />
April 28, 2010
Table 1<br />
Traffic Message Channel segments picked for validation in Maryland<br />
LENGTH<br />
TYPE TMC HIGHWAY STARTING AT ENDING AT DIRECTION (mile)<br />
Freeway 110-04626 I-4<strong>95</strong> EXIT 27 MD-650/NEW HAMPSHIRE AVE/EXIT28 COUNTERCLOCKWIS 0.7<br />
Freeway 110N04626 I-4<strong>95</strong> MD-650/NEW HAMPSHIRE AVE/EXIT28 MD-650/NEW HAMPSHIRE AVE/EXIT28 COUNTERCLOCKWIS 0.5<br />
Freeway 110-04625 I-4<strong>95</strong> MD-650/NEW HAMPSHIRE AVE/EXIT28 MD-193/UNIVERSITY BLVD/EXIT 29 COUNTERCLOCKWIS 1.1<br />
Freeway 110N04625 I-4<strong>95</strong> MD-193/UNIVERSITY BLVD/EXIT 29 MD-193/UNIVERSITY BLVD/EXIT 29 COUNTERCLOCKWIS 0.2<br />
Freeway 110-04624 I-4<strong>95</strong> MD-193/UNIVERSITY BLVD/EXIT 29 US-29/COLESVILLE RD/EXIT 30 COUNTERCLOCKWIS 0.6<br />
Freeway 110N04624 I-4<strong>95</strong> US-29/COLESVILLE RD/EXIT 30 US-29/COLESVILLE RD/EXIT 30 COUNTERCLOCKWIS 0.1<br />
Freeway 110-04623 I-4<strong>95</strong> US-29/COLESVILLE RD/EXIT 30 MD-97/GEORGIA AVE/EXIT 31 COUNTERCLOCKWIS 1.1<br />
Freeway 110N04623 I-4<strong>95</strong> MD-97/GEORGIA AVE/EXIT 31 MD-97/GEORGIA AVE/EXIT 31 COUNTERCLOCKWIS 0.4<br />
Freeway 110-04622 I-4<strong>95</strong> MD-97/GEORGIA AVE/EXIT 31 MD-185/CONNECTICUT AVE/EXIT 33 COUNTERCLOCKWIS 1.6<br />
Freeway 110N04622 I-4<strong>95</strong> MD-185/CONNECTICUT AVE/EXIT 33 MD-185/CONNECTICUT AVE/EXIT 33 COUNTERCLOCKWIS 0.7<br />
Freeway 110-04621 I-4<strong>95</strong> MD-185/CONNECTICUT AVE/EXIT 33 MD-355/WISCONSIN AVE/EXIT 34 COUNTERCLOCKWIS 1.1<br />
Freeway 110+04622 I-4<strong>95</strong> MD-355/WISCONSIN AVE/EXIT 34 MD-185/CONNECTICUT AVE/EXIT 33 CLOCKWISE 1.1<br />
Freeway 110P04622 I-4<strong>95</strong> MD-185/CONNECTICUT AVE/EXIT 33 MD-185/CONNECTICUT AVE/EXIT 33 CLOCKWISE 0.4<br />
Freeway 110+04623 I-4<strong>95</strong> MD-185/CONNECTICUT AVE/EXIT 33 MD-97/GEORGIA AVE/EXIT 31 CLOCKWISE 1.8<br />
Freeway 110P04623 I-4<strong>95</strong> MD-97/GEORGIA AVE/EXIT 31 MD-97/GEORGIA AVE/EXIT 31 CLOCKWISE 0.5<br />
Freeway 110+04624 I-4<strong>95</strong> MD-97/GEORGIA AVE/EXIT 31 US-29/COLESVILLE RD/EXIT 30 CLOCKWISE 1.0<br />
Freeway 110P04624 I-4<strong>95</strong> US-29/COLESVILLE RD/EXIT 30 US-29/COLESVILLE RD/EXIT 30 CLOCKWISE 0.4<br />
Freeway 110+04625 I-4<strong>95</strong> US-29/COLESVILLE RD/EXIT 30 MD-193/UNIVERSITY BLVD/EXIT 29 CLOCKWISE 0.2<br />
Freeway 110P04625 I-4<strong>95</strong> MD-193/UNIVERSITY BLVD/EXIT 29 MD-193/UNIVERSITY BLVD/EXIT 29 CLOCKWISE 0.4<br />
Freeway 110+04626 I-4<strong>95</strong> MD-193/UNIVERSITY BLVD/EXIT 29 MD-650/NEW HAMPSHIRE AVE/EXIT28 CLOCKWISE 1.1<br />
Freeway 110P04626 I-4<strong>95</strong> MD-650/NEW HAMPSHIRE AVE/EXIT28 MD-650/NEW HAMPSHIRE AVE/EXIT28 CLOCKWISE 0.6<br />
Freeway 110+04627 I-4<strong>95</strong> MD-650/NEW HAMPSHIRE AVE/EXIT28 EXIT 27 CLOCKWISE 0.5<br />
SUBTOTAL 16.3<br />
I-<strong>95</strong> Corridor Coalition Vehicle Probe Project Evaluation 6<br />
April 28, 2010
Table 1<br />
Traffic Message Channel segments picked for validation in Maryland (Cont’d)<br />
LENGTH<br />
TYPE TMC HIGHWAY STARTING AT ENDING AT DIRECTION (mile)<br />
Arterial 110-05862 MD-355 CEDAR LN JONES BRIDGE RD SOUTHBOUND 0.64<br />
Arterial 110N05862 MD-355 JONES BRIDGE RD JONES BRIDGE RD SOUTHBOUND 0.01<br />
Arterial 110-05861 MD-355 JONES BRIDGE RD WOODMONT AVE SOUTHBOUND 0.04<br />
Arterial 110N05861 MD-355 WOODMONT AVE WOODMONT AVE SOUTHBOUND 0.08<br />
Arterial 110-05860 MD-355 WOODMONT AVE MD-410/MD-187 SOUTHBOUND 0.72<br />
Arterial 110+05861 MD-355 MD-410/MD-187 WOODMONT AVE NORTHBOUND 0.73<br />
Arterial 110P05861 MD-355 WOODMONT AVE WOODMONT AVE NORTHBOUND 0.02<br />
Arterial 110+05862 MD-355 WOODMONT AVE JONES BRIDGE RD NORTHBOUND 0.10<br />
Arterial 110P05862 MD-355 JONES BRIDGE RD JONES BRIDGE RD NORTHBOUND 0.03<br />
Arterial 110+05863 MD-355 JONES BRIDGE RD CEDAR LN NORTHBOUND 0.62<br />
SUBTOTAL 3.0<br />
TOTAL 19.3<br />
I-<strong>95</strong> Corridor Coalition Vehicle Probe Project Evaluation 7<br />
April 28, 2010
Table 2<br />
TMC segment lengths and distances between sensor deployment locations in the state of Maryland<br />
SEGMENT STANDARD TMC SENSOR DEPLOYMENT ERROR IN<br />
SEGMENT<br />
TYPE TMC Endpoint (1) Endpoint (2) Length Endpoint (1) Endpoint (2) Length<br />
LENGTH<br />
Lat Long Lat Long (mile) Lat Long Lat Long (mile) (%)<br />
Freeway 110-04626 39.020162 -76.<strong>95</strong>8232 39.018558 -76.970559 0.67 39.020555 -76.<strong>95</strong>8010<br />
Freeway 110N04626 39.018558 -76.970559 39.019864 -76.980603 0.55 39.020128 -76.979382<br />
Freeway 110-04625 39.019864 -76.980603 39.015834 -77.001145 1.15 39.020128 -76.979382 39.016053 -77.000818 1.19 3.8%<br />
Freeway 110N04625 39.015834 -77.001145 39.015365 -77.005355 0.23 39.016053 -77.000818<br />
Freeway 110-04624 39.015365 -77.005355 39.015987 -77.015934 0.58<br />
Freeway 110N04624 39.015987 -77.015934 39.016043 -77.018664 0.15 39.016718 -77.020915<br />
Freeway 110-04623 39.016043 -77.018664 39.013442 -77.038472 1.13 39.016718 -77.020915 39.013655 -77.037203 0.94 -17.0%<br />
Freeway 110N04623 39.013442 -77.038472 39.013586 -77.045273 0.37 39.013655 -77.037203 39.013727 -77.044908 0.42 15.0%<br />
Freeway 110-04622 39.013586 -77.045273 39.006482 -77.070519 1.61 39.013727 -77.044908 39.006800 -77.070567 1.63 1.0%<br />
Freeway 110N04622 39.006482 -77.070519 39.005764 -77.083150 0.69 39.006800 -77.070567 39.005743 -77.082275 0.64 -7.0%<br />
Freeway 110-04621 39.005764 -77.083150 39.016434 -77.098330 1.13 39.005743 -77.082275 39.016978 -77.099322 1.24 9.6%<br />
Freeway 110+04622 39.015629 -77.096938 39.005185 -77.082227 1.10 39.015347 -77.096767 39.006510 -77.085322 0.89 -19.0%<br />
Freeway 110P04622 39.005185 -77.082227 39.005774 -77.074669 0.41 39.006510 -77.085322 39.005483 -77.073298 0.67 63.5%<br />
Freeway 110+04623 39.005774 -77.074669 39.013444 -77.046431 1.78 39.005483 -77.073298 39.012938 -77.043528 1.87 5.2%<br />
Freeway 110P04623 39.013444 -77.046431 39.013267 -77.037358 0.49 39.012938 -77.043528<br />
Freeway 110+04624 39.013267 -77.037358 39.016116 -77.020426 0.98 39.016047 -77.020402<br />
Freeway 110P04624 39.016116 -77.020426 39.016248 -77.012525 0.43 39.016047 -77.020402<br />
Freeway 110+04625 39.016248 -77.012525 39.015<strong>95</strong>3 -77.008328 0.23<br />
Freeway 110P04625 39.015<strong>95</strong>3 -77.008328 39.015796 -77.000479 0.44 39.015482 -76.999213<br />
Freeway 110+04626 39.015796 -77.000479 39.019698 -76.980924 1.09 39.015482 -76.999213<br />
Freeway 110P04626 39.019698 -76.980924 39.018362 -76.969369 0.63<br />
Freeway 110+04627 39.018362 -76.969369 39.018984 -76.960131 0.50 39.018758 -76.960017<br />
SUBTOTAL 16.32<br />
I-<strong>95</strong> Corridor Coalition Vehicle Probe Project Evaluation 8<br />
April 28, 2010
Table 2 (continued)<br />
TMC segment lengths and distances between sensor deployment locations in the state of Maryland (Cont’d)<br />
SEGMENT STANDARD TMC SENSOR DEPLOYMENT ERROR IN<br />
SEGMENT<br />
TYPE TMC Endpoint (1) Endpoint (2) Length Endpoint (1) Endpoint (2) Length<br />
LENGTH<br />
Lat Long Lat Long (mile) Lat Long Lat Long (mile) (%)<br />
Arterial 110-05862 39.006140 -77.097682 38.996931 -77.096706 0.64 39.006580 -77.097922<br />
Arterial 110N05862 38.996931 -77.096706 38.996827 -77.096697 0.01 38.996265 -77.096698<br />
Arterial 110-05861 38.996827 -77.096697 38.996273 -77.096644 0.04 38.996265 -77.096698<br />
Arterial 110N05861 38.996273 -77.096644 38.9<strong>95</strong>126 -77.096530 0.08<br />
Arterial 110-05860 38.9<strong>95</strong>126 -77.096530 38.984814 -77.094330 0.72 38.984765 -77.094422<br />
Arterial 110+05861 38.984722 -77.094164 38.9<strong>95</strong>129 -77.096367 0.73 38.984765 -77.094422<br />
Arterial 110P05861 38.9<strong>95</strong>129 -77.096367 38.9<strong>95</strong>352 -77.0963<strong>95</strong> 0.02<br />
Arterial 110+05862 38.9<strong>95</strong>352 -77.0963<strong>95</strong> 38.996836 -77.096553 0.10 38.996265 -77.096698<br />
Arterial 110P05862 38.996836 -77.096553 38.997232 -77.096586 0.03 38.996265 -77.096698<br />
Arterial 110+05863 38.997232 -77.096586 39.006166 -77.097485 0.62 39.006580 -77.097922<br />
SUBTOTAL 2.98<br />
TOTAL 19.30<br />
I-<strong>95</strong> Corridor Coalition Vehicle Probe Project Evaluation 9<br />
April 28, 2010
Table 3<br />
Path segments identified for validation in Maryland<br />
Type Validation<br />
STANDARD SEGMENTS INCLUDED<br />
LENGTH (MILE)<br />
Error<br />
Segment TMC(1) TMC(2) TMC(3) TMC(4) TMC(5) STARTING AT ENDING AT Standard Deployment (%)<br />
EXIT 27<br />
MD-650/NEW<br />
HAMPSHIRE<br />
Freeway MD03-0001 110-04626 110N04626<br />
AVE/EXIT28 1.22 1.18 -3.38%<br />
Freeway 110-04625 110-04625<br />
MD-650/NEW<br />
HAMPSHIRE<br />
AVE/EXIT28<br />
MD-<br />
193/UNIVERSITY<br />
BLVD/EXIT 29 1.15 1.19 3.77%<br />
Freeway 110-04623 110-04623<br />
US-29/COLESVILLE<br />
RD/EXIT 30<br />
MD-97/GEORGIA<br />
AVE/EXIT 31 1.13 0.94 -16.96%<br />
Freeway 110-04622 110-04622<br />
Freeway 110-04621 110-04621<br />
Freeway 110+04622 110+04622<br />
Freeway 110+04623 110+04623<br />
Freeway MD03-0002 110P04623 110+04624<br />
Freeway MD03-0003 110P04624 110+04625 110P04625<br />
MD-97/GEORGIA<br />
AVE/EXIT 31<br />
MD-<br />
185/CONNECTICUT<br />
AVE/EXIT 33<br />
MD-<br />
355/WISCONSIN<br />
AVE/EXIT 34<br />
MD-<br />
185/CONNECTICUT<br />
AVE/EXIT 33<br />
MD-97/GEORGIA<br />
AVE/EXIT 31<br />
US-29/COLESVILLE<br />
RD/EXIT 30<br />
MD-<br />
193/UNIVERSITY<br />
BLVD/EXIT 29<br />
MD-<br />
185/CONNECTICUT<br />
AVE/EXIT 33 1.61 1.63 1.02%<br />
MD-355/WISCONSIN<br />
AVE/EXIT 34<br />
1.13 1.24 9.59%<br />
MD-<br />
185/CONNECTICUT<br />
AVE/EXIT 33 1.10 0.89 -19.04%<br />
MD-97/GEORGIA<br />
AVE/EXIT 31<br />
1.78 1.87 5.23%<br />
US-29/COLESVILLE<br />
RD/EXIT 30 1.46 1.31 -10.46%<br />
MD-<br />
193/UNIVERSITY<br />
BLVD/EXIT 29 1.09 1.15 5.07%<br />
EXIT 27<br />
Freeway MD03-0004 110+04626 110P04626 110+04627<br />
2.22 2.17 -2.24%<br />
SUBTOTAL 13.90 13.57 -2.36%<br />
Arterial MD03-0005 110-05862 110N05862 110-05861 110N05861 110-05860 CEDAR LN MD-410/MD-187 1.49 1.52 2.01%<br />
Arterial MD03-0006 110+05861 110P05861 110+05862 110P05862 110+05863 MD-410/MD-187 CEDAR LN 1.49 1.52 2.01%<br />
SUBTOTAL 2.98 3.04 2.01%<br />
TOTAL 16.88 16.61 -1.59%<br />
I-<strong>95</strong> Corridor Coalition Vehicle Probe Project Evaluation 10<br />
April 28, 2010
Table 4<br />
Data quality measures for freeway segments greater than<br />
one mile in Maryland<br />
SPEED<br />
BIN<br />
Speed<br />
Error<br />
Bias<br />
Data Quality Measures for<br />
1.96 SE Band Mean<br />
Average<br />
Absolute Speed<br />
Speed Error<br />
Error Bias<br />
Average<br />
Absolute<br />
Speed<br />
Error<br />
No. of<br />
Obs.<br />
0-30 1.1 3.6 1.4 5.1 918<br />
30-45 1.8 4.3 2.5 6.6 1169<br />
45-60 -0.1 2.1 0.2 4.0 4672<br />
60+ -1.8 2.1 -3.2 4.4 2508<br />
Table 5<br />
Percent observations meeting data quality criteria for freeway<br />
segments greater than one mile in Maryland<br />
SPEED<br />
BIN<br />
Data Quality Measures for<br />
1.96 SE Band Mean<br />
Percentage<br />
falling<br />
inside the<br />
band<br />
Percentage<br />
falling<br />
within 5<br />
mph of the<br />
band<br />
Percentage<br />
equal to the<br />
mean<br />
Percentage<br />
within 5<br />
mph of the<br />
mean<br />
No. of<br />
Obs.<br />
0-30 17% 76% 0% 66% 918<br />
30-45 27% 66% 0% 50% 1169<br />
45-60 39% 87% 0% 71% 4672<br />
60+ 41% 85% 0% 66% 2508<br />
I-<strong>95</strong> Corridor Coalition Vehicle Probe Project Evaluation 11<br />
April 28, 2010
Table 6<br />
Data quality measures for individual freeway validation segments greater than one<br />
mile in the state of Maryland<br />
TMC<br />
Standard<br />
TMC<br />
length<br />
Bluetooth<br />
distance<br />
110+04622 1.12 0.89<br />
110+04623 1.81 1.87<br />
110-04621 1.15 1.24<br />
110-04622 1.57 1.63<br />
110-04623 1.09 0.94<br />
110-04625 1.15 1.19<br />
MD03-0001 1.22 1.18<br />
MD03-0002 1.48 1.31<br />
MD03-0003 1.02 1.15<br />
MD03-0004 2.26 2.17<br />
SPEED<br />
BIN<br />
Data Quality Measures for<br />
1.96 SE Band Mean<br />
Speed<br />
Error<br />
Bias<br />
Average<br />
Absolute<br />
Speed<br />
Error<br />
Speed<br />
Error<br />
Bias<br />
Average<br />
Absolute<br />
Speed<br />
Error<br />
No. of Obs.<br />
0-30 1.6 3.4 2.1 4.6 179<br />
30-45 1.0 4.6 1.6 6.7 283<br />
45-60 -0.8 2.3 -0.8 3.9 884<br />
60+ -1.7 1.8 -3.0 3.9 69<br />
0-30 1.2 4.2 1.5 5.6 89<br />
30-45 2.0 3.6 2.6 5.3 <strong>95</strong><br />
45-60 -0.1 1.5 0.1 3.4 469<br />
60+ -1.7 1.8 -3.9 4.8 67<br />
0-30 1.2 3.3 1.5 4.9 100<br />
30-45 2.9 4.9 3.8 7.3 107<br />
45-60 -0.8 2.1 -1.0 3.8 514<br />
60+ -1.9 2.2 -3.6 4.5 166<br />
0-30 2.4 5.0 2.6 5.8 86<br />
30-45 3.6 5.7 4.8 7.7 158<br />
45-60 1.4 1.9 2.4 3.8 702<br />
60+ -1.0 1.4 -1.9 3.3 83<br />
0-30 0.7 4.6 0.8 5.4 81<br />
30-45 2.6 4.9 3.6 6.9 86<br />
45-60 -0.5 2.3 -0.1 4.5 253<br />
60+ -1.7 2.0 -2.9 4.1 479<br />
0-30 1.2 4.0 1.4 5.2 88<br />
30-45 2.3 3.7 2.7 6.6 46<br />
45-60 -1.5 3.1 -1.9 5.5 139<br />
60+ -2.0 2.3 -3.6 4.5 631<br />
0-30 0.9 2.5 1.2 3.5 83<br />
30-45 2.2 4.3 3.3 7.3 82<br />
45-60 0.7 1.9 1.3 3.9 616<br />
60+ -0.9 1.4 -1.5 3.2 143<br />
0-30 1.0 2.4 1.9 4.4 60<br />
30-45 1.5 3.5 2.2 6.1 <strong>95</strong><br />
45-60 0.4 1.8 1.4 4.1 402<br />
60+ -0.6 0.8 -1.6 3.1 146<br />
0-30 -1.5 2.8 -1.3 4.1 66<br />
30-45 -1.4 3.9 -1.9 6.0 70<br />
45-60 -2.8 2.9 -4.3 5.1 308<br />
60+ -4.5 4.5 -7.3 7.3 335<br />
0-30 1.0 4.1 0.7 7.3 86<br />
30-45 1.1 3.0 1.9 5.8 147<br />
45-60 0.5 1.9 1.6 4.1 385<br />
60+ -0.4 1.1 -0.9 3.0 389<br />
I-<strong>95</strong> Corridor Coalition Vehicle Probe Project Evaluation 12<br />
April 28, 2010
Table 7<br />
Observations meeting data quality criteria for individual freeway validation segments<br />
greater than one mile in the state of Maryland<br />
TMC<br />
110+04622<br />
110+04623<br />
110-04621<br />
110-04622<br />
110-04623<br />
110-04625<br />
MD03-0001<br />
MD03-0002<br />
MD03-0003<br />
MD03-0004<br />
SPEED BIN<br />
Data Quality Measures for<br />
1.96 SE Band Mean<br />
Speed Error Bias<br />
Average Absolute<br />
Average Absolute<br />
Speed Error Bias<br />
Speed Error<br />
Speed Error<br />
No.<br />
falling<br />
inside<br />
the<br />
band<br />
%<br />
falling<br />
inside<br />
the<br />
band<br />
No.<br />
falling<br />
within<br />
5 mph<br />
of the<br />
band<br />
%<br />
falling<br />
within<br />
5 mph<br />
of the<br />
band<br />
No.<br />
equal<br />
to the<br />
mean<br />
%<br />
equal<br />
to the<br />
mean<br />
No.<br />
within<br />
5 mph<br />
of the<br />
mean<br />
%<br />
within<br />
5 mph<br />
of the<br />
mean<br />
No. of<br />
Obs.<br />
0-30 30 17% 142 79% 0 0% 125 70% 179<br />
30-45 68 24% 182 64% 0 0% 137 48% 283<br />
45-60 309 35% 767 87% 0 0% 661 75% 884<br />
60+ 31 45% 60 87% 0 0% 51 74% 69<br />
0-30 13 15% 60 67% 0 0% 52 58% 89<br />
30-45 26 27% 65 68% 1 1% 53 56% <strong>95</strong><br />
45-60 229 49% 425 91% 0 0% 358 76% 469<br />
60+ 22 33% 62 93% 0 0% 42 63% 67<br />
0-30 17 17% 81 81% 0 0% 59 59% 100<br />
30-45 27 25% 65 61% 0 0% 51 48% 107<br />
45-60 210 41% 450 88% 0 0% 381 74% 514<br />
60+ 67 40% 144 87% 0 0% 110 66% 166<br />
0-30 8 9% 55 64% 0 0% 50 58% 86<br />
30-45 31 20% 89 56% 0 0% 68 43% 158<br />
45-60 261 37% 620 88% 0 0% 501 71% 702<br />
60+ 40 48% 74 89% 0 0% 64 77% 83<br />
0-30 9 11% 56 69% 0 0% 54 67% 81<br />
30-45 22 26% 51 59% 0 0% 41 48% 86<br />
45-60 100 40% 212 84% 0 0% 165 65% 253<br />
60+ 218 46% 412 86% 0 0% 340 71% 479<br />
0-30 10 11% 70 80% 0 0% 64 73% 88<br />
30-45 18 39% 34 74% 0 0% 27 59% 46<br />
45-60 53 38% 108 78% 0 0% 85 61% 139<br />
60+ 230 36% 533 84% 0 0% 411 65% 631<br />
0-30 17 20% 73 88% 0 0% 69 83% 83<br />
30-45 26 32% 55 67% 0 0% 41 50% 82<br />
45-60 243 39% 546 89% 0 0% 426 69% 616<br />
60+ 70 49% 131 92% 0 0% 115 80% 143<br />
0-30 17 28% 50 83% 0 0% 41 68% 60<br />
30-45 22 23% 68 72% 0 0% 49 52% <strong>95</strong><br />
45-60 169 42% 360 90% 0 0% 273 68% 402<br />
60+ 92 63% 140 96% 0 0% 118 81% 146<br />
0-30 9 14% 55 83% 0 0% 49 74% 66<br />
30-45 19 27% 52 74% 0 0% 37 53% 70<br />
45-60 113 37% 240 78% 0 0% 186 60% 308<br />
60+ 46 14% 208 62% 0 0% 93 28% 335<br />
0-30 27 31% 59 69% 0 0% 47 55% 86<br />
30-45 51 35% 114 78% 0 0% 80 54% 147<br />
45-60 145 38% 338 88% 0 0% 262 68% 385<br />
60+ 208 53% 365 94% 2 1% 315 81% 389<br />
I-<strong>95</strong> Corridor Coalition Vehicle Probe Project Evaluation 13<br />
April 28, 2010
Figure 2<br />
Speed error bias for freeway segments greater than one mile in Maryland<br />
Figure 3<br />
Average absolute speed error for freeway segments greater than one mile in Maryland<br />
I-<strong>95</strong> Corridor Coalition Vehicle Probe Project Evaluation 14<br />
April 28, 2010
Analysis of Results for Arterials<br />
Table 8 summarizes the data quality measures obtained as a result of comparison between<br />
Bluetooth and all reported INRIX speeds on two arterial segments considered in this round of<br />
validations. In all speed bins below 45mph, INRIX data meets the data quality measures set forth<br />
in the contract when errors are measured as a distance from the 1.96 times the standard error<br />
band. In addition, no observation is made in the speed bins above 45 mph which is compatible<br />
with the posted speed limits on the arterial segments in question.<br />
Table 9 shows the percentage of the time intervals that fall within 5 mph of the SEM band and<br />
the mean for each speed bin for all arterial segments in Maryland. Tables 10 and 11 present<br />
detailed data for individual arterial segments in Maryland in similar format as Tables 8 and 9,<br />
respectively. Note that for some segments and in some speed bins the comparison results may<br />
not be reliable due to small number of observations.<br />
Figures 4 and 5 show the overall speed error biases for different speed bins, and the average<br />
absolute speed errors for all considered arterial segments in Maryland, respectively. These<br />
figures correspond to Table 8.<br />
I-<strong>95</strong> Corridor Coalition Vehicle Probe Project Evaluation 15<br />
April 28, 2010
Table 8<br />
Data quality measures for arterial segments greater than<br />
one mile in Maryland<br />
SPEED<br />
BIN<br />
Speed<br />
Error<br />
Bias<br />
Data Quality Measures for<br />
1.96 SE Band Mean<br />
Average<br />
Absolute Speed<br />
Speed Error<br />
Error Bias<br />
Average<br />
Absolute<br />
Speed<br />
Error<br />
No. of<br />
Obs.<br />
0-30 3.6 4.9 5.2 7.4 6<strong>95</strong><br />
30-45 -0.5 0.5 -2.4 3.5 4<br />
45-60<br />
60+<br />
Table 9<br />
Percent observations meeting data quality criteria for arterial<br />
segments greater than one mile in Maryland<br />
SPEED<br />
BIN<br />
Percentage<br />
falling<br />
inside the<br />
band<br />
Data Quality Measures for<br />
1.96 SE Band Mean<br />
Percentage<br />
falling<br />
within 5<br />
mph of the<br />
band<br />
Percentage<br />
equal to the<br />
mean<br />
Percentage<br />
within 5<br />
mph of the<br />
mean<br />
No. of<br />
Obs.<br />
0-30 24% 61% 0% 42% 6<strong>95</strong><br />
30-45 75% 100% 0% 75% 4<br />
45-60<br />
60+<br />
I-<strong>95</strong> Corridor Coalition Vehicle Probe Project Evaluation 16<br />
April 28, 2010
Table 10<br />
Data quality measures for individual arterial validation segments greater than one mile in<br />
the state of Maryland<br />
TMC<br />
Standard<br />
TMC<br />
length<br />
Bluetooth<br />
distance<br />
MD03-0005 1.49 1.52<br />
MD03-0006 1.49 1.52<br />
SPEED<br />
BIN<br />
Data Quality Measures for<br />
1.96 SE Band Mean<br />
Speed<br />
Error<br />
Bias<br />
Average<br />
Absolute<br />
Speed<br />
Error<br />
Speed<br />
Error<br />
Bias<br />
Average<br />
Absolute<br />
Speed<br />
Error<br />
No. of<br />
Obs.<br />
0-30 3.3 4.7 4.7 7.1 418<br />
30-45 0.0 0.0 0.4 0.4 1*<br />
45-60<br />
60+<br />
0-30 4.0 5.2 6.0 7.8 277<br />
30-45 -0.7 0.7 -3.4 4.5 3*<br />
45-60<br />
*Results in the specified row may not be reliable due to small number of observations<br />
60+<br />
Table 11<br />
Observations meeting data quality criteria for individual arterial validation segments<br />
greater than one mile in the state of Maryland<br />
TMC<br />
MD03-0005<br />
MD03-0006<br />
SPEED BIN<br />
Data Quality Measures for<br />
1.96 SE Band Mean<br />
Speed Error Bias<br />
Average Absolute<br />
Average Absolute<br />
Speed Error Bias<br />
Speed Error<br />
Speed Error<br />
No. %<br />
No. % falling falling<br />
No. %<br />
falling falling within within No. % within within<br />
inside inside 5 mph 5 mph equal equal 5 mph 5 mph<br />
the the of the of the to the to the of the of the<br />
band band band band mean mean mean mean<br />
No. of<br />
Obs.<br />
0-30 102 24% 262 63% 1 0% 181 43% 418<br />
30-45 1 100% 1 100% 0 0% 1 100% 1*<br />
45-60<br />
60+<br />
0-30 67 24% 159 57% 0 0% 108 39% 277<br />
30-45 2 67% 3 100% 0 0% 2 67% 3*<br />
45-60<br />
60+<br />
*Results in the specified row may not be reliable due to small number of observations<br />
I-<strong>95</strong> Corridor Coalition Vehicle Probe Project Evaluation 17<br />
April 28, 2010
Figure 4<br />
Speed error bias for arterial segments greater than one mile in Maryland<br />
Figure 5<br />
Average absolute speed error for arterial segments greater than one mile in Maryland<br />
I-<strong>95</strong> Corridor Coalition Vehicle Probe Project Evaluation 18<br />
April 28, 2010