Boyd Convex Optimization book - SFU Wiki
Boyd Convex Optimization book - SFU Wiki
Boyd Convex Optimization book - SFU Wiki

You also want an ePaper? Increase the reach of your titles
YUMPU automatically turns print PDFs into web optimized ePapers that Google loves.
314 6 Approximation and fitting<br />
PSfrag replacements 0.5<br />
ˆx<br />
0<br />
−0.5<br />
0<br />
1000<br />
2000<br />
3000<br />
4000<br />
0.5<br />
ˆx<br />
0<br />
−0.5<br />
0<br />
1000<br />
2000<br />
3000<br />
4000<br />
0.5<br />
ˆx<br />
0<br />
−0.5<br />
0<br />
1000<br />
2000<br />
i<br />
3000<br />
4000<br />
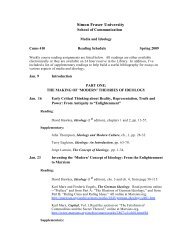
Figure 6.10 Three smoothed or reconstructed signals ˆx. The top one corresponds<br />
to ‖ˆx − x cor‖ 2 = 8, the middle one to ‖ˆx − x cor‖ 2 = 3, and the<br />
bottom one to ‖ˆx − x cor‖ 2 = 1.<br />
which is called the total variation of x ∈ R n . Like the quadratic smoothness<br />
measure φ quad , the total variation function assigns large values to rapidly varying<br />
ˆx. The total variation measure, however, assigns relatively less penalty to large<br />
values of |x i+1 − x i |.<br />
Total variation reconstruction example<br />
Figure 6.11 shows a signal x ∈ R 2000 (in the top plot), and the signal corrupted<br />
with noise x cor . The signal is mostly smooth, but has several rapid variations or<br />
jumps in value; the noise is rapidly varying.<br />
We first use quadratic smoothing. Figure 6.12 shows three smoothed signals on<br />
the optimal trade-off curve between ‖Dˆx‖ 2 and ‖ˆx−x cor ‖ 2 . In the first two signals,<br />
the rapid variations in the original signal are also smoothed. In the third signal<br />
the steep edges in the signal are better preserved, but there is still a significant<br />
amount of noise left.<br />
Now we demonstrate total variation reconstruction. Figure 6.13 shows the optimal<br />
trade-off curve between ‖Dˆx‖ 1 and ‖ˆx − x corr ‖ 2 . Figure 6.14 show the reconstructed<br />
signals on the optimal trade-off curve, for ‖Dˆx‖ 1 = 10 (top), ‖Dˆx‖ 1 = 8<br />
(middle), and ‖Dˆx‖ 1 = 5 (bottom). We observe that, unlike quadratic smoothing,<br />
total variation reconstruction preserves the sharp transitions in the signal.