a four-fold rise - Center for Food Safety
a four-fold rise - Center for Food Safety
a four-fold rise - Center for Food Safety

You also want an ePaper? Increase the reach of your titles
YUMPU automatically turns print PDFs into web optimized ePapers that Google loves.
<strong>Center</strong> <strong>for</strong> <strong>Food</strong> <strong>Safety</strong> – Science Comments – FG72 Soybean <br />
62 <br />
upon long-‐term climate data, inherent soil and site characteristics, and cropping and management <br />
practices.” Tillage regimes are the primary component of “cropping and management practices,” and <br />
thus play a large role in determining soil erosion rates. It is well established that soil erosion <br />
increases with the intensity of tillage, and decreases as farmers adopt regimes that leave more plant <br />
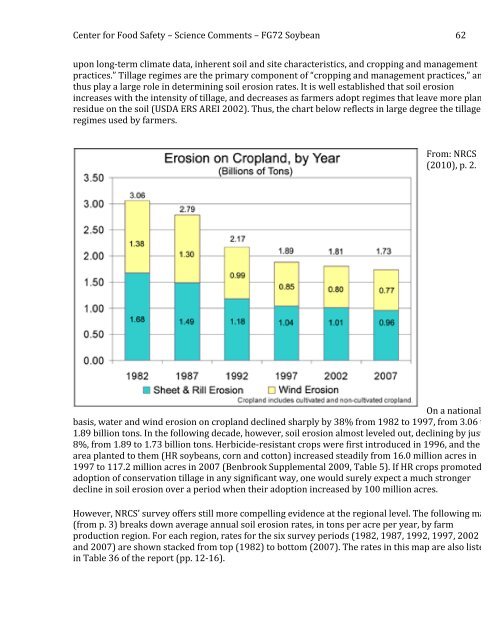
residue on the soil (USDA ERS AREI 2002). Thus, the chart below reflects in large degree the tillage <br />
regimes used by farmers.<br />
From: NRCS <br />
(2010), p. 2. <br />
On a national <br />
basis, water and wind erosion on cropland declined sharply by 38% from 1982 to 1997, from 3.06 to <br />
1.89 billion tons. In the following decade, however, soil erosion almost leveled out, declining by just <br />
8%, from 1.89 to 1.73 billion tons. Herbicide-‐resistant crops were first introduced in 1996, and the <br />
area planted to them (HR soybeans, corn and cotton) increased steadily from 16.0 million acres in <br />
1997 to 117.2 million acres in 2007 (Benbrook Supplemental 2009, Table 5). If HR crops promoted <br />
adoption of conservation tillage in any significant way, one would surely expect a much stronger <br />
decline in soil erosion over a period when their adoption increased by 100 million acres. <br />
However, NRCS’ survey offers still more compelling evidence at the regional level. The following map <br />
(from p. 3) breaks down average annual soil erosion rates, in tons per acre per year, by farm <br />
production region. For each region, rates <strong>for</strong> the six survey periods (1982, 1987, 1992, 1997, 2002 <br />
and 2007) are shown stacked from top (1982) to bottom (2007). The rates in this map are also listed <br />
in Table 36 of the report (pp. 12-‐16).