DI-720 datasheet - DATAQ Instruments
DI-720 datasheet - DATAQ Instruments
DI-720 datasheet - DATAQ Instruments

Create successful ePaper yourself
Turn your PDF publications into a flip-book with our unique Google optimized e-Paper software.
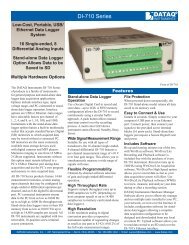
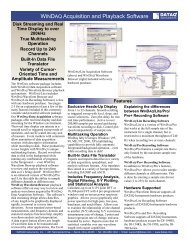
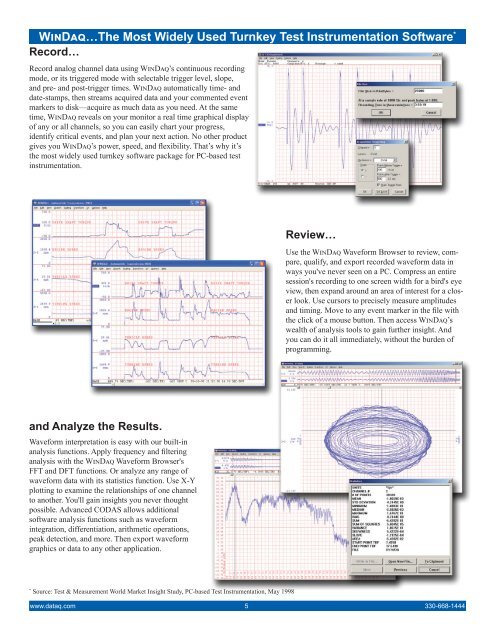
WinDaq…The Most Widely Used Turnkey Test Instrumentation Software *<br />
Record…<br />
Record analog channel data using WinDaq’s continuous recording<br />
mode, or its triggered mode with selectable trigger level, slope,<br />
and pre- and post-trigger times. WinDaq automatically time- and<br />
date-stamps, then streams acquired data and your commented event<br />
markers to disk—acquire as much data as you need. At the same<br />
time, WinDaq reveals on your monitor a real time graphical display<br />
of any or all channels, so you can easily chart your progress,<br />
identify critical events, and plan your next action. No other product<br />
gives you WinDaq’s power, speed, and flexibility. That’s why it’s<br />
the most widely used turnkey software package for PC-based test<br />
instrumentation.<br />
Review…<br />
Use the WinDaq Waveform Browser to review, compare,<br />
qualify, and export recorded waveform data in<br />
ways you've never seen on a PC. Compress an entire<br />
session's recording to one screen width for a bird's eye<br />
view, then expand around an area of interest for a closer<br />
look. Use cursors to precisely measure amplitudes<br />
and timing. Move to any event marker in the file with<br />
the click of a mouse button. Then access WinDaq’s<br />
wealth of analysis tools to gain further insight. And<br />
you can do it all immediately, without the burden of<br />
programming.<br />
and Analyze the Results.<br />
Waveform interpretation is easy with our built-in<br />
analysis functions. Apply frequency and filtering<br />
analysis with the WinDaq Waveform Browser's<br />
FFT and DFT functions. Or analyze any range of<br />
waveform data with its statistics function. Use X-Y<br />
plotting to examine the relationships of one channel<br />
to another. You'll gain insights you never thought<br />
possible. Advanced CODAS allows additional<br />
software analysis functions such as waveform<br />
integration, differentiation, arithmetic operations,<br />
peak detection, and more. Then export waveform<br />
graphics or data to any other application.<br />
*<br />
Source: Test & Measurement World Market Insight Study, PC-based Test Instrumentation, May 1998<br />
www.dataq.com 5 330-668-1444