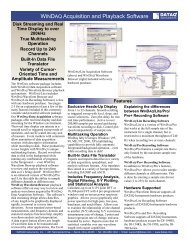
DI-770 Oscilloscope provides five virtual instruments in one
DI-770 Oscilloscope provides five virtual instruments in one
DI-770 Oscilloscope provides five virtual instruments in one

Create successful ePaper yourself
Turn your PDF publications into a flip-book with our unique Google optimized e-Paper software.
The way PC-based <strong>in</strong>strumentation should be<br />
<strong>DI</strong>-<strong>770</strong> and WINDAQ/Scope<br />
<strong>Oscilloscope</strong> and support<strong>in</strong>g software<br />
User's Manual<br />
Manual Revision F<br />
Software Release Level 1<br />
Copyright © 2005 by DATAQ Instruments, Inc. The Information conta<strong>in</strong>ed here<strong>in</strong> is the exclusive property of<br />
DATAQ Instruments, Inc., except as otherwise <strong>in</strong>dicated and shall not be reproduced, transmitted, transcribed, stored<br />
<strong>in</strong> a retrieval system, or translated <strong>in</strong>to any human or computer language, <strong>in</strong> any form or by any means, electronic,<br />
mechanical, magnetic, optical, chemical, manual, or otherwise without expressed written authorization from the company.<br />
The distribution of this material outside the company may occur only as authorized by the company <strong>in</strong> writ<strong>in</strong>g.<br />
DATAQ Instruments' hardware and software products are not designed to be used <strong>in</strong> the diagnosis and treatment of<br />
humans, nor are they to be used as critical comp<strong>one</strong>nts <strong>in</strong> any life-support systems whose failure to perform can reasonably<br />
be expected to cause significant <strong>in</strong>jury to humans.<br />
DATAQ, the DATAQ logo, and WINDAQ are registered trademarks of DATAQ Instruments, Inc. All rights reserved.<br />
DATAQ Instruments, Inc.<br />
241 Spr<strong>in</strong>gside Drive<br />
Akron, Ohio 44333 U.S.A.<br />
Teleph<strong>one</strong>: 330-668-1444<br />
Fax: 330-666-5434<br />
Designed and manufactured <strong>in</strong> the<br />
United States of America
Warranty and Service Policy<br />
Product Warranty<br />
DATAQ Instruments, Inc. warrants that this hardware will be free from defects <strong>in</strong> materials and workmanship under<br />
normal use and service for a period of <strong>one</strong> year from the date of shipment. DATAQ Instruments' obligations under<br />
this warranty shall not arise until the defective material is shipped freight prepaid to DATAQ Instruments. The only<br />
responsibility of DATAQ Instruments under this warranty is to repair or replace, at its discretion and on a free of<br />
charge basis, the defective material.<br />
This warranty does not extend to products that have been repaired or altered by persons other than DATAQ Instruments<br />
employees, or products that have been subjected to misuse, neglect, improper <strong>in</strong>stallation, or accident.<br />
DATAQ Instruments shall have no liability for <strong>in</strong>cidental or consequential damages of any k<strong>in</strong>d aris<strong>in</strong>g out of the sale,<br />
<strong>in</strong>stallation, or use of its products.<br />
Service Policy<br />
1. All products returned to DATAQ Instruments for service, regardless of warranty status, must be on a freight-prepaid<br />
basis.<br />
2. For <strong>in</strong>-warranty repairs, DATAQ Instruments will return repaired items to the buyer freight prepaid. Out of warranty<br />
repairs will be returned with freight prepaid and added to the service <strong>in</strong>voice.
<strong>DI</strong>-<strong>770</strong> and WINDAQ/Scope Manual<br />
Table of Contents<br />
Warranty and Service Policy ................................................................................................................ iii<br />
1. Introduction ....................................................................................................................................... 1<br />
ATTENTION! ................................................................................................................................... 1<br />
Safety ................................................................................................................................................. 1<br />
Sampl<strong>in</strong>g ............................................................................................................................................ 2<br />
Alias<strong>in</strong>g .............................................................................................................................................. 2<br />
Digitiz<strong>in</strong>g ........................................................................................................................................... 3<br />
The probes ......................................................................................................................................... 3<br />
2. Specifications ...................................................................................................................................... 5<br />
<strong>Oscilloscope</strong> ....................................................................................................................................... 5<br />
Voltmeter ........................................................................................................................................... 6<br />
Transient Recorder ............................................................................................................................ 6<br />
Spectrum Analyzer ............................................................................................................................ 6<br />
Arbitrary Waveform Generator ......................................................................................................... 7<br />
Acquisition System ............................................................................................................................ 7<br />
Arbitrary Waveform Generator (<strong>in</strong>dependent from acquisition system) ........................................... 7<br />
Trigger System .................................................................................................................................. 8<br />
Power Requirements .......................................................................................................................... 8<br />
Physical .............................................................................................................................................. 8<br />
I/O Connectors ................................................................................................................................... 8<br />
System Requirements ........................................................................................................................ 9<br />
Operat<strong>in</strong>g Environment ..................................................................................................................... 9<br />
Storage Environment ......................................................................................................................... 9<br />
Certifications and Compliances ......................................................................................................... 9<br />
Package .............................................................................................................................................. 9<br />
3. Installation ......................................................................................................................................... 11<br />
Requirements ..................................................................................................................................... 11<br />
Driver Installation .............................................................................................................................. 11<br />
Install<strong>in</strong>g W<strong>in</strong>Daq/Scope Software ................................................................................................... 12<br />
4. Connections ........................................................................................................................................ 13<br />
Extension connector .......................................................................................................................... 13<br />
External power ................................................................................................................................... 13<br />
5. W<strong>in</strong>Daq/Scope Software .................................................................................................................... 15<br />
Structure of the program .................................................................................................................... 19<br />
Start<strong>in</strong>g the program .......................................................................................................................... 19<br />
Help ................................................................................................................................................... 19<br />
Controll<strong>in</strong>g the <strong><strong>in</strong>struments</strong> ............................................................................................................... 19<br />
Keys that can be used .................................................................................................................. 20<br />
Controll<strong>in</strong>g with the mouse ......................................................................................................... 21<br />
Program setup .................................................................................................................................... 21<br />
Instrument taskbar always on top ................................................................................................ 21<br />
Sett<strong>in</strong>g display colors .................................................................................................................. 22<br />
Sett<strong>in</strong>g the application language ................................................................................................. 22<br />
Sett<strong>in</strong>g the location of files ......................................................................................................... 22<br />
Default text on the pr<strong>in</strong>ter output ................................................................................................ 22<br />
Device <strong>in</strong>fo .................................................................................................................................. 22<br />
Table of Contents<br />
v
<strong>DI</strong>-<strong>770</strong> and WINDAQ/Scope Manual<br />
Sett<strong>in</strong>g the date and time style .................................................................................................... 22<br />
Search hardware .......................................................................................................................... 22<br />
Manually adjust<strong>in</strong>g of calibration factors ................................................................................... 22<br />
Restore factory calibration factors .............................................................................................. 23<br />
Load<strong>in</strong>g a set of calibration values at start up ............................................................................. 23<br />
Select<strong>in</strong>g the type of duty cycle .................................................................................................. 23<br />
Active <strong><strong>in</strong>struments</strong> at start up ...................................................................................................... 23<br />
Sav<strong>in</strong>g <strong>in</strong>strument sett<strong>in</strong>gs on disk .................................................................................................... 24<br />
Restore <strong>in</strong>strument sett<strong>in</strong>gs from disk ............................................................................................... 24<br />
Stor<strong>in</strong>g measurement data on disk ..................................................................................................... 24<br />
Sett<strong>in</strong>g the data file type .............................................................................................................. 24<br />
Load<strong>in</strong>g saved measurement data from disk ..................................................................................... 25<br />
Sett<strong>in</strong>g the Waveform read method ............................................................................................. 25<br />
Compar<strong>in</strong>g signals us<strong>in</strong>g the reference channels ............................................................................... 26<br />
Fill the references ........................................................................................................................ 26<br />
Switch<strong>in</strong>g references on or off .................................................................................................... 26<br />
Scal<strong>in</strong>g references ....................................................................................................................... 26<br />
Update reference comment ......................................................................................................... 27<br />
Documentation of measurements ...................................................................................................... 27<br />
Add comment text to a measurement .......................................................................................... 27<br />
Place a comment label ................................................................................................................. 27<br />
Edit a comment label ................................................................................................................... 27<br />
Delet<strong>in</strong>g a comment label ............................................................................................................ 28<br />
Make a hard copy pr<strong>in</strong>t out ......................................................................................................... 28<br />
End<strong>in</strong>g the program ........................................................................................................................... 28<br />
6. The <strong>Oscilloscope</strong> ................................................................................................................................ 29<br />
Alias<strong>in</strong>g .............................................................................................................................................. 30<br />
Display<strong>in</strong>g channels ........................................................................................................................... 30<br />
Envelope mode ............................................................................................................................ 30<br />
Averag<strong>in</strong>g .................................................................................................................................... 31<br />
Math mode .................................................................................................................................. 31<br />
Sett<strong>in</strong>g up a channel ........................................................................................................................... 32<br />
Sett<strong>in</strong>g the sensitivity of a channel .............................................................................................. 32<br />
Sett<strong>in</strong>g the signal coupl<strong>in</strong>g of a channel ..................................................................................... 32<br />
Sett<strong>in</strong>g the vertical position of a channel .................................................................................... 33<br />
Magnify<strong>in</strong>g or reduc<strong>in</strong>g the vertical axis .................................................................................... 33<br />
Invert<strong>in</strong>g a channel ...................................................................................................................... 33<br />
The channel view button ............................................................................................................. 34<br />
Chang<strong>in</strong>g the units of the vertical axis ........................................................................................ 34<br />
Mouse sensitivity for the vertical axis ........................................................................................ 35<br />
Sett<strong>in</strong>g up the time axis ...................................................................................................................... 35<br />
Sett<strong>in</strong>g the sample frequency ...................................................................................................... 35<br />
Sett<strong>in</strong>g the record length ............................................................................................................. 35<br />
Sett<strong>in</strong>g the pre trigger value ........................................................................................................ 36<br />
Mouse sensitivity pre trigger position adjustment ...................................................................... 36<br />
Magnify<strong>in</strong>g the horizontal axis ................................................................................................... 37<br />
Sett<strong>in</strong>g the horizontal position of the signal(s) ........................................................................... 37<br />
The record view scroll bar ........................................................................................................... 37<br />
Trigger<strong>in</strong>g .......................................................................................................................................... 38<br />
Select<strong>in</strong>g the trigger source ......................................................................................................... 38<br />
Table of Contents<br />
vi
<strong>DI</strong>-<strong>770</strong> and WINDAQ/Scope Manual<br />
Select<strong>in</strong>g the trigger mode .......................................................................................................... 39<br />
Sett<strong>in</strong>g the trigger level ............................................................................................................... 39<br />
Sett<strong>in</strong>g the trigger hysteresis ....................................................................................................... 39<br />
The trigger symbol ...................................................................................................................... 39<br />
The trigger time out ..................................................................................................................... 40<br />
Perform<strong>in</strong>g measurements ................................................................................................................. 40<br />
Stopp<strong>in</strong>g the measurements ........................................................................................................ 40<br />
Perform Auto disk measurements ............................................................................................... 41<br />
Auto setup ................................................................................................................................... 41<br />
Zoom<strong>in</strong>g ............................................................................................................................................. 42<br />
Perform<strong>in</strong>g cursor measurements ...................................................................................................... 42<br />
Switch<strong>in</strong>g on cursors ................................................................................................................... 42<br />
Sett<strong>in</strong>g up the cursor measurements ............................................................................................ 42<br />
Select<strong>in</strong>g the active channel ........................................................................................................ 44<br />
Show<strong>in</strong>g or hid<strong>in</strong>g the cursor readout ......................................................................................... 44<br />
Switch<strong>in</strong>g off cursors .................................................................................................................. 44<br />
7. The Voltmeter .................................................................................................................................... 45<br />
The measure system of the voltmeter ................................................................................................ 45<br />
Sett<strong>in</strong>g the frequency range ......................................................................................................... 46<br />
Display<strong>in</strong>g channels ........................................................................................................................... 46<br />
Sett<strong>in</strong>g up a channel ........................................................................................................................... 46<br />
Sett<strong>in</strong>g the <strong>in</strong>put range ................................................................................................................ 46<br />
Sett<strong>in</strong>g the <strong>in</strong>put coupl<strong>in</strong>g ........................................................................................................... 47<br />
Sett<strong>in</strong>g a DC hardware offset ...................................................................................................... 47<br />
Configur<strong>in</strong>g the displays .................................................................................................................... 48<br />
Switch<strong>in</strong>g displays on and off ..................................................................................................... 48<br />
Switch<strong>in</strong>g bargraphs on and off .................................................................................................. 48<br />
Process<strong>in</strong>g the measured value ................................................................................................... 49<br />
Display<strong>in</strong>g the calculated value .................................................................................................. 50<br />
Change the units of measure ....................................................................................................... 51<br />
Change the units per measurement unit ...................................................................................... 51<br />
Relative measurements ............................................................................................................... 51<br />
Comparison measurements ......................................................................................................... 52<br />
Sett<strong>in</strong>g the reference impedance ................................................................................................. 52<br />
Sett<strong>in</strong>g the number of digits after the decimal separator ............................................................ 52<br />
Sound sett<strong>in</strong>gs ............................................................................................................................. 52<br />
Resett<strong>in</strong>g the m<strong>in</strong>imum and maximum values .................................................................................. 53<br />
Perform<strong>in</strong>g measurements ................................................................................................................. 53<br />
Start and stop measur<strong>in</strong>g ............................................................................................................. 53<br />
Averag<strong>in</strong>g .................................................................................................................................... 53<br />
Fast measur<strong>in</strong>g ............................................................................................................................ 53<br />
One shot measurements .............................................................................................................. 53<br />
Stor<strong>in</strong>g measurement values on disk or paper ................................................................................... 54<br />
Sett<strong>in</strong>g the time between two measurements .............................................................................. 54<br />
Sett<strong>in</strong>g the hysteresis ................................................................................................................... 54<br />
Start an acquisition ...................................................................................................................... 54<br />
8. The Data Logger ................................................................................................................................ 55<br />
The data logger measur<strong>in</strong>g system .................................................................................................... 55<br />
Display<strong>in</strong>g channels ........................................................................................................................... 56<br />
Sett<strong>in</strong>g up a channel ........................................................................................................................... 56<br />
Table of Contents<br />
vii
<strong>DI</strong>-<strong>770</strong> and WINDAQ/Scope Manual<br />
Sett<strong>in</strong>g up the time axis ...................................................................................................................... 56<br />
Sett<strong>in</strong>g up the sample speed ........................................................................................................ 56<br />
Sett<strong>in</strong>g the record length ............................................................................................................. 57<br />
Sett<strong>in</strong>g the horizontal axis type ................................................................................................... 57<br />
Perform measurements ...................................................................................................................... 57<br />
Start measur<strong>in</strong>g ............................................................................................................................ 57<br />
Stop measur<strong>in</strong>g ............................................................................................................................ 58<br />
Scroll mode ................................................................................................................................. 58<br />
Compar<strong>in</strong>g signals us<strong>in</strong>g the reference channels ............................................................................... 58<br />
Perform<strong>in</strong>g cursor measurements ...................................................................................................... 58<br />
9. The Spectrum Analyzer .................................................................................................................... 59<br />
Description of FFT ............................................................................................................................ 60<br />
Alias<strong>in</strong>g ....................................................................................................................................... 60<br />
W<strong>in</strong>dow<strong>in</strong>g .................................................................................................................................. 61<br />
Display<strong>in</strong>g channels ........................................................................................................................... 61<br />
Sett<strong>in</strong>g up a channel ........................................................................................................................... 62<br />
Sett<strong>in</strong>g the <strong>in</strong>put sensitivity ......................................................................................................... 62<br />
Logarithmic or l<strong>in</strong>ear vertical axis .............................................................................................. 62<br />
Sett<strong>in</strong>g up the frequency range .......................................................................................................... 63<br />
Sett<strong>in</strong>g up the frequency axis type ..................................................................................................... 63<br />
Sett<strong>in</strong>g the frequency range ......................................................................................................... 65<br />
Sett<strong>in</strong>g the spectrum record length .............................................................................................. 65<br />
Sett<strong>in</strong>g up the FFT ............................................................................................................................. 65<br />
FFT w<strong>in</strong>dow function .................................................................................................................. 65<br />
Perform<strong>in</strong>g measurements ................................................................................................................. 66<br />
Start and stop measur<strong>in</strong>g ............................................................................................................. 66<br />
S<strong>in</strong>gle measurements ................................................................................................................... 66<br />
Averag<strong>in</strong>g .................................................................................................................................... 66<br />
Measur<strong>in</strong>g maximum values ....................................................................................................... 66<br />
Measure the Total Harmonic Distortion of a signal .................................................................... 67<br />
Perform<strong>in</strong>g cursor measurements ...................................................................................................... 67<br />
Sett<strong>in</strong>g up the cursor measurements ............................................................................................ 67<br />
10. The Function Generator ................................................................................................................. 69<br />
Pr<strong>in</strong>ciple of the function generator .................................................................................................... 69<br />
Structure of the function generator .................................................................................................... 69<br />
Controll<strong>in</strong>g the function generator ..................................................................................................... 70<br />
Signal shape ................................................................................................................................ 70<br />
Frequency .................................................................................................................................... 70<br />
Symmetry .................................................................................................................................... 70<br />
Amplitude .................................................................................................................................... 71<br />
DC offset ..................................................................................................................................... 71<br />
Numerical <strong>in</strong>put ................................................................................................................................. 71<br />
Presets ................................................................................................................................................ 72<br />
Stor<strong>in</strong>g ......................................................................................................................................... 72<br />
Select<strong>in</strong>g ...................................................................................................................................... 73<br />
Clear<strong>in</strong>g ....................................................................................................................................... 73<br />
Perform<strong>in</strong>g a sweep ........................................................................................................................... 73<br />
Generat<strong>in</strong>g a previous measured signal from a file ........................................................................... 74<br />
Measur<strong>in</strong>g and stor<strong>in</strong>g a signal ................................................................................................... 74<br />
Sett<strong>in</strong>g the function generator ..................................................................................................... 74<br />
Table of Contents<br />
viii
<strong>DI</strong>-<strong>770</strong> and WINDAQ/Scope Manual<br />
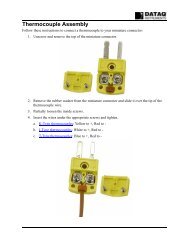
1. Introduction<br />
Many technicians <strong>in</strong>vestigate electrical signals. Though the measurement may not be electrical, the physical variable<br />
is often converted to an electrical signal, with a special transducer. Common transducers are accelerometers, pressure<br />
probes, current clamps and temperature probes. The advantages of convert<strong>in</strong>g the physical parameters to electrical<br />
signals are large, s<strong>in</strong>ce several <strong><strong>in</strong>struments</strong> for exam<strong>in</strong><strong>in</strong>g electrical signals are available.<br />
The <strong>DI</strong>-<strong>770</strong> is a two channel, 25 or 100 M samples/sec measur<strong>in</strong>g <strong>in</strong>strument. With the accompany<strong>in</strong>g software the<br />
<strong>DI</strong>-<strong>770</strong> can be used as an oscilloscope, a storage oscilloscope, a spectrum analyzer, a true RMS voltmeter, or a data<br />
logger. All <strong><strong>in</strong>struments</strong> measure by sampl<strong>in</strong>g the <strong>in</strong>put signals, digitiz<strong>in</strong>g the values, process them, save them and display<br />
them.<br />
ATTENTION!<br />
Measur<strong>in</strong>g directly on the LINE VOLTAGE can be very dangerous. The OUTSIDE of the BNC CONNECTORS at<br />
the <strong>DI</strong>-<strong>770</strong> are connected with the GROUND of the computer.<br />
Use a good isolation transformer or a differential probe when measur<strong>in</strong>g at the LINE VOLTAGE or at GROUND-ED<br />
POWER SUPPLIES!<br />
In case this has not been considered and the GROUND of the <strong>DI</strong>-<strong>770</strong> is connected to a positive voltage, a short-circuit<br />
current will be flow<strong>in</strong>g. Because of this short-circuit current both the <strong>DI</strong>-<strong>770</strong> and the computer can be damaged.<br />
Safety<br />
Before you start work<strong>in</strong>g with the <strong>DI</strong>-<strong>770</strong>, first read these safety rules.<br />
• Avoid work<strong>in</strong>g al<strong>one</strong>.<br />
• Check the probes / test leads for damages. Do NOT use them if they are damaged.<br />
• Take care when measur<strong>in</strong>g at voltages higher than 25V AC or 60 V DC.<br />
• Measur<strong>in</strong>g directly on the LINE VOLTAGE can be very dangerous. The OUTSIDE of the BNC CONNECTORS<br />
at the <strong>DI</strong>-<strong>770</strong> are connected with the GROUND of the computer.<br />
• Use a good isolation transformer or a differential probe when measur<strong>in</strong>g at the LINE VOLTAGE or at<br />
GROUNDED POWER SUPPLIES!<br />
• In case this has not been considered and the GROUND of the <strong>DI</strong>-<strong>770</strong> is connected to a positive voltage, a shortcircuit<br />
current will be flow<strong>in</strong>g. Because of this short-circuit current both the <strong>DI</strong>-<strong>770</strong> and the computer can be<br />
damaged.<br />
Introduction<br />
1
<strong>DI</strong>-<strong>770</strong> and WINDAQ/Scope Manual<br />
Sampl<strong>in</strong>g<br />
When sampl<strong>in</strong>g the <strong>in</strong>put signal, samples are taken at certa<strong>in</strong> moments. The frequency at which the samples are taken<br />
is called the sampl<strong>in</strong>g frequency. By tak<strong>in</strong>g a (large) number of samples, the <strong>in</strong>put signal can be reconstructed.<br />
The more samples are taken, the better the signal can be reconstructed. The sampl<strong>in</strong>g frequency must be higher than 2<br />
times the highest frequency <strong>in</strong> the <strong>in</strong>put signal. This is called the Nyquist frequency. Theoretically it is possible to<br />
reconstruct the <strong>in</strong>put signal with more than 2 samples. In practice, 10 to 20 samples are necessary to be able to exam<strong>in</strong>e<br />
the signal thoroughly.<br />
Alias<strong>in</strong>g<br />
If the sampl<strong>in</strong>g frequency is lower than 2 times the frequency of the <strong>in</strong>put signal, 'alias<strong>in</strong>g' will occur. The follow<strong>in</strong>g<br />
illustration shows how alias<strong>in</strong>g occurs.<br />
The <strong>in</strong>put signal is a triangular signal with a frequency of 1.25 kHz (upper most <strong>in</strong> the illustration). The signal is sampled<br />
at a frequency of 1 kHz. The dotted signal is the result of the reconstruction. From that triangular signal the periodical<br />
time is 4 ms, which corresponds with an apparent frequency (alias) of 250 Hz (1.25 kHz - 1 kHz).<br />
To avoid alias<strong>in</strong>g, the sample frequency must be higher than 2 times the maximum frequency of the <strong>in</strong>put signal.<br />
Introduction<br />
2
<strong>DI</strong>-<strong>770</strong> and WINDAQ/Scope Manual<br />
Alias<strong>in</strong>g is not always visible on an oscilloscope. In the latter illustration, it gives a 'good look<strong>in</strong>g' picture. It is not<br />
apparent that alias<strong>in</strong>g occurs. The next illustration gives an example of visible alias<strong>in</strong>g.<br />
This time it is a s<strong>in</strong>e wave signal with a frequency of 25.7 kHz, which is sampled at a frequency of 5 kHz. The m<strong>in</strong>imal<br />
sampl<strong>in</strong>g frequency should have been 51.4 kHz. For proper analysis, the sampl<strong>in</strong>g frequency should have been<br />
500 khz.<br />
Digitiz<strong>in</strong>g<br />
After tak<strong>in</strong>g a sample of the <strong>in</strong>put signal, it is digitized. This is d<strong>one</strong> with an Analog to Digital Convertor, ADC. The<br />
ADC converts the size of the signal to a digital number. This is called quantify<strong>in</strong>g.<br />
The first condition for accurate measurement is to have as many as possible quantify<strong>in</strong>g steps. This can be realized by<br />
us<strong>in</strong>g an ADC with a resolution as high as possible.<br />
The resolution of ADC's is often given <strong>in</strong> bits. The number of bits determ<strong>in</strong>es the number of quantify<strong>in</strong>g steps accord<strong>in</strong>g<br />
the formula:<br />
number of bits<br />
number of quantify<strong>in</strong>g steps = 2<br />
A 2 bits ADC has 4 quantify<strong>in</strong>g steps. With an <strong>in</strong>put range of 10 Volt, this ADC can divide the <strong>in</strong>put range <strong>in</strong> 4 parts<br />
of each 2.5 Volt.<br />
By <strong>in</strong>creas<strong>in</strong>g the number of bits, the resolution <strong>in</strong>creases, the number of quantify<strong>in</strong>g steps <strong>in</strong>creases and the sub-divisions<br />
get smaller.<br />
The probes<br />
The <strong>DI</strong>-<strong>770</strong> is shipped with two probes. These are 1x/10x selectable passive probes. This means that the <strong>in</strong>put signal<br />
is passed through directly or 10 times attenuated.<br />
The x10 attenuation is achieved by means of an attenuation network. This attenuation network has to be adjusted to<br />
the oscilloscope <strong>in</strong>put circuitry, to guarantee frequency <strong>in</strong>dependency. This is called the low frequency compensation.<br />
Each time a probe is used on an other channel or an other oscilloscope, the probe must be adjusted.<br />
Therefore the probe is equipped with a setscrew, with which the parallel capacity of the attenuation network can be<br />
altered. To adjust the probe, switch the probe to the x10 and attach the probe to a 1 kHz square wave signal. Then<br />
adjust the probe for a square front corner on the square wave displayed. See also the follow<strong>in</strong>g illustration.<br />
Introduction<br />
3
<strong>DI</strong>-<strong>770</strong> and WINDAQ/Scope Manual<br />
correct:<br />
under compensated:<br />
over compensated:<br />
Introduction<br />
4
<strong>DI</strong>-<strong>770</strong> and WINDAQ/Scope Manual<br />
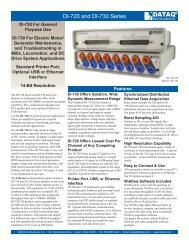
2. Specifications<br />
<strong>Oscilloscope</strong><br />
Display channels:<br />
CH1, CH2, CH1 and CH2<br />
Display Mode<br />
Envelope: On/Off<br />
Averag<strong>in</strong>g: 1.. 256 averag<strong>in</strong>g<br />
Math mode: CH1+CH2, CH1-CH2, CH2-CH1<br />
Polarity:<br />
Normal, Invert<br />
Vertical position sett<strong>in</strong>g:<br />
200mVolt, 500mVolt, 1V, 2V, 5V, 10V, 20V, 40V 80 Volt full scale<br />
Vertical ga<strong>in</strong> sett<strong>in</strong>g:<br />
0.25 to 8 magnify<strong>in</strong>g<br />
Input coupl<strong>in</strong>g:<br />
AC/DC<br />
Time base m<strong>in</strong>imum:<br />
20 day's/div<br />
Time base maximum:<br />
<strong>DI</strong>-<strong>770</strong>-25: 400nsec/div<br />
<strong>DI</strong>-<strong>770</strong>-100: 100nsec/div<br />
Time base ga<strong>in</strong>:<br />
0.25 to 8 magnify<strong>in</strong>g<br />
Time base accuracy:<br />
±100 ppm from 0°C to 70°C.<br />
Ag<strong>in</strong>g = ±5ppm per year.<br />
Record length:<br />
1 to 131060 samples per channel<br />
Record view scroll bar ga<strong>in</strong>: 1 to 125<br />
Trigger mode:<br />
free run, delayed run, auto, s<strong>in</strong>gle, edge triggered, w<strong>in</strong>dow, peak, external<br />
Trigger system:<br />
two digital trigger levels, 4096 positions<br />
Trigger source:<br />
CH1, CH2, External, Keyboard and Master<br />
Trigger level:<br />
0-100% full <strong>in</strong>put range<br />
Pre trigger:<br />
1 to 131060 samples per channel<br />
Post trigger:<br />
1 to 131060 samples per channel<br />
Trigger delay:<br />
1 to 131060 samples per channel<br />
Trigger hysteresis:<br />
0 to 100% full <strong>in</strong>put range<br />
Trigger hysteresis resolution:<br />
0.025% full scale<br />
Auto disk measur<strong>in</strong>g:<br />
1 to 1000 file's<br />
Auto setup:<br />
connect and show<br />
Zoom<strong>in</strong>g:<br />
mouse w<strong>in</strong>dow control, ga<strong>in</strong> vertical and ga<strong>in</strong> horizontal<br />
Cursor system:<br />
two cursors, auto track<strong>in</strong>g, auto correct po<strong>in</strong>ts<br />
Cursor mode:<br />
large cursors, small cursors<br />
Cursor measurements:<br />
rise time left; rise time right; sample time left; sample time right; sample<br />
time difference; cursor frequency; Voltage left; Voltage right; Voltage difference;<br />
slew rate left; slew rate right; fase difference <strong>in</strong> Degrees, Radials<br />
or cos()<br />
Specifications<br />
5
<strong>DI</strong>-<strong>770</strong> and WINDAQ/Scope Manual<br />
Color sett<strong>in</strong>gs:<br />
Fonts:<br />
CH1, CH2, Ref CH1, Ref CH2, math, trigger, timebase, background, raster,<br />
cursors<br />
user selectable<br />
Voltmeter<br />
Display channels:<br />
Display size:<br />
Number of displays:<br />
Frequency range:<br />
Full scale read<strong>in</strong>g:<br />
Accuracy DC coupled:<br />
Accuracy AC coupled<br />
Measurements:<br />
Display mode:<br />
Measure units:<br />
Relative:<br />
Sound sett<strong>in</strong>gs:<br />
Data stor<strong>in</strong>g:<br />
Acquisition hysteresis:<br />
CH1, CH2, CH1 and CH2<br />
user selectable<br />
1 to 6 user selectable<br />
<strong>DI</strong>-<strong>770</strong>-25: 10 Hz to 2 MHz<br />
<strong>DI</strong>-<strong>770</strong>-100: 10 Hz to 10 MHz<br />
2000 counts<br />
0.2% ±10 counts<br />
0.3% ±10 counts (10 to 1 MHz)<br />
0.7% ±20 counts (1 MHz to 5 MHz)<br />
2.5% ±20 counts (1 MHz to 5 MHz)<br />
low frequency roll of frequency is 10 Hz<br />
True RMS, Peak-Peak, Mean, Max, M<strong>in</strong>, dBm, Power, Crest, Frequency,<br />
Duty cycle, Moment, value<br />
CH1, CH2, CH1*CH2, CH1/CH2, CH1-CH2, CH2-CH1, CH1+CH2,<br />
>the Hi,
<strong>DI</strong>-<strong>770</strong> and WINDAQ/Scope Manual<br />
Input coupl<strong>in</strong>g:<br />
Frequency axis:<br />
Octave range:<br />
Frequency range:<br />
Record length:<br />
W<strong>in</strong>dows functions:<br />
Averag<strong>in</strong>g:<br />
Cursor readout:<br />
Total Harmonic Distortion:<br />
AC/DC<br />
Logarithmic, l<strong>in</strong>ear, octaves or third octave<br />
22.1Hz to 22.6 kHz<br />
<strong>DI</strong>-<strong>770</strong>-100: 0.01 Hz to 50 MHz<br />
<strong>DI</strong>-<strong>770</strong>-25: 0.01 Hz to 12.5 MHz<br />
32768 to 32 frequency comp<strong>one</strong>nts<br />
rectangular, Hann<strong>in</strong>g, Hamm<strong>in</strong>g, Bartlett, Blackman, Parzen<br />
1 to 256 measurements<br />
see oscilloscope<br />
1 to 100 spectrums<br />
Arbitrary Waveform Generator<br />
Signal sources:<br />
s<strong>in</strong>e, triangle, square DC white noise, user def<strong>in</strong>ed<br />
Sweep:<br />
locked on spectrum analyzer<br />
Frequency:<br />
0.01 Hz to 2 MHz<br />
Amplitude:<br />
0 ± 12 Volt, max 50 mAmp<br />
Symmetry: 0 to 99%<br />
DC offset:<br />
0 ± 12 Volt<br />
Presets:<br />
10 storage<br />
Record length:<br />
256 Kwords<br />
Acquisition System<br />
Resolution:<br />
Bandwidth (-3dB):<br />
Sample rate:<br />
Sample source:<br />
Number of <strong>in</strong>put channels:<br />
Input sensitivity:<br />
Input protection:<br />
Input impedance:<br />
Input coupl<strong>in</strong>g:<br />
Input accuracy:<br />
AC coupl<strong>in</strong>g cut off frequency (-3dB):<br />
Memory:<br />
8 bit @ 100 MHz<br />
12 bit @ 50 MHz<br />
14 bit @ 3.125 MHz<br />
16 bit @ 195 kHz<br />
DC to 50 MHz maximum<br />
<strong>DI</strong>-<strong>770</strong>-25: 25 MHz, 40 nsec<br />
<strong>DI</strong>-<strong>770</strong>-100: 100 MHz, 10 nsec<br />
<strong>in</strong>ternal 0.01%, external<br />
2 analog<br />
200 mVolt .. 80 Volt full scale<br />
200 Volt (DC + AC peak < 10 kHz)<br />
1 MOhm / 30 pF<br />
AC/DC<br />
0.2% ± 1 LSB<br />
1 Hz with 1x probe<br />
0 - 131060 samples each channel<br />
Arbitrary Waveform Generator (<strong>in</strong>dependent from acquisition system)<br />
Resolution:<br />
14 bit @ 50 MHz<br />
Specifications<br />
7
<strong>DI</strong>-<strong>770</strong> and WINDAQ/Scope Manual<br />
Sample rate:<br />
Bandwidth:<br />
Impedance:<br />
Coupl<strong>in</strong>g:<br />
Output amplitude:<br />
Amplitude step:<br />
DC level:<br />
Waveforms:<br />
Symmetry:<br />
Memory:<br />
50 MHz<br />
DC to 2MHz<br />
50 Ohm<br />
DC<br />
-12 Volt .. 12 Volt<br />
0 - ±0.1 V range, 8192 steps<br />
±0.1 - ±0.9 V range, 8192 steps<br />
±0.9 - ±12 V range, 8192 steps<br />
0 - ±12 V <strong>in</strong> 8192 steps<br />
s<strong>in</strong>e, triangle, square, DC, noise and user def<strong>in</strong>ed<br />
1 - 99%, 1% steps<br />
1 - 256 Kwords<br />
Trigger System<br />
System:<br />
Source:<br />
Trigger modes:<br />
Level adjustment:<br />
Hysteresis adjustment:<br />
Resolution:<br />
Pre trigger:<br />
Post trigger:<br />
Digital trigger <strong>in</strong>put level:<br />
digital, 2 levels<br />
CH1, CH2, AND, OR, digital external<br />
ris<strong>in</strong>g slope, fall<strong>in</strong>g slope, <strong>in</strong>side w<strong>in</strong>dow, outside w<strong>in</strong>dow, peak<br />
0 - 100% of full scale<br />
0 - 100% of full scale<br />
0.025% (12 bits)<br />
0 - 131060 samples (0 - 100%, <strong>one</strong> sample resolution)<br />
0 - 131060 samples (0 - 100%, <strong>one</strong> sample resolution)<br />
0 - 3.3 volt (5 volt max)<br />
Power Requirements<br />
Power from USB port:<br />
Power via extension connector:<br />
500 mAmp max (2.5 Watt max)<br />
1500 mAmp max (7.5 Watt max)<br />
Physical<br />
Dimensions:<br />
Weight:<br />
Cord length:<br />
1.0 × 6.7 × 5.2 <strong>in</strong>. (25 × 170 × 140 mm)<br />
approx. 2 pounds 10 ounces (1190 grams)<br />
1.8 meter (70 <strong>in</strong>ch)<br />
I/O Connectors<br />
Input Channel 1:<br />
BNC<br />
Input Channel 2:<br />
BNC<br />
Output AWG:<br />
BNC<br />
USB:<br />
USB 2.0 and USB 1.1 type A<br />
Extension connector: Sub-D 25 p<strong>in</strong>s female<br />
Specifications<br />
8
<strong>DI</strong>-<strong>770</strong> and WINDAQ/Scope Manual<br />
System Requirements<br />
PC I/O connection:<br />
Operat<strong>in</strong>g system:<br />
USB 2.0 or USB 1.1 port type A<br />
W<strong>in</strong>dows 98/2000/ME/XP<br />
Operat<strong>in</strong>g Environment<br />
Ambient temperature: 0 to 55 °C<br />
Relative humidity:<br />
10 to 90% non condens<strong>in</strong>g<br />
Storage Environment<br />
Ambient temperature: -20 to 70 °C<br />
Relative humidity:<br />
5 to 95% non condens<strong>in</strong>g<br />
Certifications and Compliances<br />
CE mark compliance:<br />
CE<br />
Package<br />
Instrument:<br />
Accessories:<br />
Software:<br />
Drivers:<br />
Manual:<br />
<strong>DI</strong>-<strong>770</strong><br />
2 oscilloscope probes 1:1 - 1:10 switchable<br />
W<strong>in</strong>dows 98/2000/ME/XP on CD<br />
W<strong>in</strong>dows 98/2000/ME/XP on CD<br />
pr<strong>in</strong>ted on paper and digital on CD<br />
Specifications<br />
9
<strong>DI</strong>-<strong>770</strong> and WINDAQ/Scope Manual<br />
3. Installation<br />
The <strong>DI</strong>-<strong>770</strong> is an external measur<strong>in</strong>g <strong>in</strong>strument which can be connected to a PC.<br />
The <strong>DI</strong>-<strong>770</strong> is connected to a USB port of the PC us<strong>in</strong>g the attached cable.<br />
The <strong>DI</strong>-<strong>770</strong> does not need an external power supply, but is powered by the computer, through the USB.<br />
The USB can deliver only a limited amount of power. In case the USB can not supply enough power, an extra cable is<br />
supplied which can be connected to the <strong>DI</strong>-<strong>770</strong> and between the computer and the keyboard cable. In that case the <strong>DI</strong>-<br />
<strong>770</strong> will be powered by the keyboard connection.<br />
Note: The outside of the external power connector is connected to +5 Volt. In order to avoid shortage, first connect<br />
the cable to the <strong>DI</strong>-<strong>770</strong> and then to the keyboard connector.<br />
Requirements<br />
To use the W<strong>in</strong>dows software you need:<br />
• An IBM compatible PC/AT with 386/25 processor or higher (mathematic coprocessor recommended)<br />
• Microsoft W<strong>in</strong>dows 3.1 or higher<br />
• 32 MB RAM<br />
• 4 MB free hard disk space<br />
• A mouse or other po<strong>in</strong>t<strong>in</strong>g device<br />
• A CD-ROM drive.<br />
Optional<br />
A sound card with wave file playback and/or general midi.<br />
Driver Installation<br />
1. With your computer powered, W<strong>in</strong>dows runn<strong>in</strong>g, and all other applications closed, plug the appropriate end of<br />
the supplied USB communications cable <strong>in</strong>to the USB port (labeled USB) on the rear panel of the <strong>in</strong>strument.<br />
Connect the other end of this cable to <strong>one</strong> of your computer's USB ports. The addition of this new piece of hardware<br />
will be “sensed” by W<strong>in</strong>dows and the “Found New Hardware Wizard” will automatically be launched,<br />
anticipat<strong>in</strong>g the <strong>in</strong>stallation of a device driver for the new hardware.<br />
2. Insert The WINDAQ Resource CD-ROM <strong>in</strong>to your CD-ROM drive. It conta<strong>in</strong>s the device drivers for the <strong>DI</strong>-<strong>770</strong>.<br />
If your W<strong>in</strong>dows auto play feature is enabled, the WINDAQ Software Installation will start. Click on the Exit button<br />
to leave the <strong>in</strong>stallation.<br />
3. Click through the defaults to <strong>in</strong>stall the Driver.<br />
Note: If you receive the Microsoft-issued warn<strong>in</strong>g that the software “has not passed W<strong>in</strong>dows Logo test<strong>in</strong>g to<br />
verify its compatibility with W<strong>in</strong>dows XP” click “Cont<strong>in</strong>ue Anyway” to cont<strong>in</strong>ue with <strong>in</strong>stallation.<br />
4. After the Driver is <strong>in</strong>stalled, click F<strong>in</strong>ish to close the Found New Hardware Wizard. W<strong>in</strong>dows should prompt you<br />
that the device has been <strong>in</strong>stalled properly.<br />
Hardware Installation<br />
11
<strong>DI</strong>-<strong>770</strong> and WINDAQ/Scope Manual<br />
Install<strong>in</strong>g WINDAQ/Scope Software<br />
The WINDAQ Resource CD-ROM conta<strong>in</strong>s all the software required for use with your <strong>DI</strong>-<strong>770</strong> <strong>in</strong>strument.<br />
1. Re-<strong>in</strong>sert the WINDAQ Resource CD for the auto play feature to run or run the Setup application.<br />
2. In the “What do you want to do” w<strong>in</strong>dow, select “Install Software” and click OK.<br />
3. In the “Install<strong>in</strong>g Software” w<strong>in</strong>dow, select “Install Software for all other products” and click OK.<br />
4. From the list provided select “W<strong>in</strong>Daq/Scope for <strong>DI</strong>-<strong>770</strong>” and click OK.<br />
5. In the Welcome! box, click OK to cont<strong>in</strong>ue.<br />
6. Read the License Agreement. If you accept the terms, click “Accept and Cont<strong>in</strong>ue.” If you choose not to accept,<br />
this will end the <strong>in</strong>stallation.<br />
7. When prompted, specify the directory where you want to <strong>in</strong>stall the software. It is recommended that you accept<br />
the default (C:\W<strong>in</strong>Daq<strong>770</strong>).<br />
8. When prompted to Select a Program Manager Group specify a dest<strong>in</strong>ation (or group w<strong>in</strong>dow) <strong>in</strong> the Start Menu<br />
for your software icons. It is recommended that you accept the default.<br />
9. Installation is complete - you will now see a Successful Installation box - click on OK to exit WINDAQ Installation.<br />
10. To run WINDAQ/Scope software go to the appropriate program group (specified above—default is Start > Programs<br />
> WINDAQ Scope) and click on W<strong>in</strong>Daq Scope.<br />
Hardware Installation<br />
12
<strong>DI</strong>-<strong>770</strong> and WINDAQ/Scope Manual<br />
4. Connections<br />
Extension connector<br />
To connect to the <strong>DI</strong>-<strong>770</strong>, a 25 p<strong>in</strong> female Sub-D connector is available, conta<strong>in</strong><strong>in</strong>g the follow<strong>in</strong>g signals:<br />
1 Ground 14 Ground<br />
2 not connected 15 Ground<br />
3 External power <strong>in</strong> 5V DC/ 500 mA 16 Ground<br />
4 Ground 17 Ground<br />
5 5 V out, 10 mA max. 18 Ground<br />
6 External, sampl<strong>in</strong>g clock <strong>in</strong> 19 Ground<br />
7 Ground 20 not connected<br />
8 External trigger <strong>in</strong> (TTL) 21 not connected<br />
9 Data OK out (TTL) 22 Ground<br />
10 Ground 23 I 2 C SDA<br />
11 Trigger out (TTL) 24 I 2 C SCL<br />
12 Square wave generator out (TTL) 25 Ground<br />
13 External sampl<strong>in</strong>g clock out<br />
External power<br />
The <strong>DI</strong>-<strong>770</strong> is powered through the USB. If the USB cannot deliver enough power, an external power cable, to the<br />
keyboard connector, can be connected.<br />
Note: The outside of the external power connector is connected to +5 Volt. In order to avoid shortage, first connect<br />
the cable to the <strong>DI</strong>-<strong>770</strong> and then to the keyboard connector.<br />
Center P<strong>in</strong> Ø 1.3 mm Ground<br />
Outside bush<strong>in</strong>g Ø 3.5 mm + 5 V DC<br />
Connections<br />
13
<strong>DI</strong>-<strong>770</strong> and WINDAQ/Scope Manual<br />
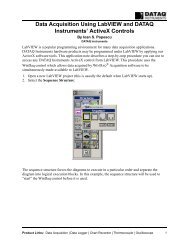
5. WINDAQ/Scope Software<br />
This manual expects that the reader has a basic knowledge how to control applications runn<strong>in</strong>g under w<strong>in</strong>dows, work<strong>in</strong>g<br />
with menus <strong>in</strong> w<strong>in</strong>dows applications, etc.<br />
1. Set the trigger level, the trigger hysteresis and the trigger slope by dragg<strong>in</strong>g and double click<strong>in</strong>g. Press the right<br />
mouse button and setup the complete trigger system.<br />
2. Toggle auto rang<strong>in</strong>g for channel 1. Press the right mouse button and select an <strong>in</strong>put sensitivity from a menu.<br />
3. Toggle the <strong>in</strong>vert for channel 1.<br />
4. Set the signal coupl<strong>in</strong>g for channel 1 to AC or DC.<br />
5. Copy, show, save and load reference signals.<br />
6. Select a math channel.<br />
7. Toggle envelope mode.<br />
Software<br />
15
<strong>DI</strong>-<strong>770</strong> and WINDAQ/Scope Manual<br />
8. With the auto setup the oscilloscope sets itself accord<strong>in</strong>g the <strong>in</strong>put signal.<br />
9. Switch between a number of pre def<strong>in</strong>ed offset and ga<strong>in</strong> sett<strong>in</strong>gs for channel 2. Press the right mouse button and<br />
select the sett<strong>in</strong>gs from a menu.<br />
10. Adjust the pre trigger po<strong>in</strong>t. Press the right mouse button and setup the complete time axis.<br />
1. The bar graph of display 2 of channel 1, for a quick <strong>in</strong>dication of the signal size.<br />
2. Display 1 of channel 1, press the right mouse button to setup the display.<br />
3. Reset the m<strong>in</strong>imum and maximum values.<br />
4. Stop the measurements with this button.<br />
5. Perform a s<strong>in</strong>gle measurement with this button.<br />
6. Perform a measurement at settable times and send the result to the pr<strong>in</strong>ter.<br />
7. Perform a measurement at settable times and store the result on disk.<br />
8. Switch the channel 2 signal coupl<strong>in</strong>g to AC or DC.<br />
Software<br />
16
<strong>DI</strong>-<strong>770</strong> and WINDAQ/Scope Manual<br />
1. Drag this end of the axis and adjust the ga<strong>in</strong> of channel 1. Press the right mouse button and setup channel 1.<br />
2. With the Stop button the data logger is stopped.<br />
3. Start a measurement with the data logger<br />
4. Zoom <strong>in</strong> to a specific part of the signal<br />
5. Erase the signal screen.<br />
6. The time axis can display sample times and real time and date. Set this by open<strong>in</strong>g the Sett<strong>in</strong>gs menu. The right<br />
mouse buttons allows the complete time base to be set up.<br />
7. Drag this end of the slider and change the horizontal magnification. Press the right mouse button and setup the<br />
time base.<br />
8. Drag the slider and adjust the horizontal position of the signal. Press the right mouse button and setup the time<br />
base.<br />
9. The h<strong>in</strong>t bar displays explanation of the objects the mouse is placed on.<br />
10. Drag the vertical axis and adjust the vertical position of the signal. Press the right mouse button and setup channel<br />
1.<br />
Software<br />
17
<strong>DI</strong>-<strong>770</strong> and WINDAQ/Scope Manual<br />
1. Press this button to place a comment label <strong>in</strong> the display.<br />
2. Press the W<strong>in</strong>dow button to select a w<strong>in</strong>dow function for the FFT.<br />
3. Stop the cont<strong>in</strong>uous measurements.<br />
4. Make a hard copy of the current signal.<br />
5. Measure the Total Harmonic Distortion.<br />
6. Double click here to switch channel 2 on.<br />
7. Press the right mouse button to setup the frequency axis.<br />
8. Dragg<strong>in</strong>g this slider adjusts the horizontal position of the signal. Press<strong>in</strong>g the right mouse button allows setup of<br />
the frequency axis.<br />
9. Drag this end of the slider (or the other end) to adjust the horizontal magnification. Press the right mouse button<br />
to setup the frequency axis.<br />
10. Drag this label of the axis and adjust the vertical magnification. Press the right mouse button to setup channel 1.<br />
11. Drag the axis and adjust the vertical position of channel 1. Press the right mouse button to setup channel 1.<br />
12. This led <strong>in</strong>dicates whether the <strong>in</strong>put signal is clipped (creates higher harmonics) or not.<br />
Software<br />
18
<strong>DI</strong>-<strong>770</strong> and WINDAQ/Scope Manual<br />
Structure of the program<br />
The program is divided <strong>in</strong>to 4 <strong>in</strong>tegrated measurement <strong><strong>in</strong>struments</strong>, which are available on the <strong>in</strong>strument taskbar:<br />
• An oscilloscope<br />
• A true RMS voltmeter<br />
• A data logger<br />
• A spectrum analyzer<br />
If an <strong>in</strong>strument is not active (<strong>in</strong>strument button state is up), the <strong>in</strong>strument can be made active by press<strong>in</strong>g the left<br />
mouse button over the <strong>in</strong>strument button. If the <strong>in</strong>strument is active (<strong>in</strong>strument button state is down) and you press<br />
the left mouse button over the <strong>in</strong>strument button, the <strong>in</strong>strument will be made <strong>in</strong>active and it will hide itself.<br />
If you have 2 or more <strong><strong>in</strong>struments</strong> active, <strong>one</strong> <strong>in</strong>strument can be on top of the other. To make the <strong>in</strong>active <strong>in</strong>strument<br />
active you can move the currently active w<strong>in</strong>dow away from the <strong>in</strong>active w<strong>in</strong>dow, so you can select it. However there<br />
is a faster way (assum<strong>in</strong>g the taskbar is visible): press the right mouse button over the <strong>in</strong>strument button.<br />
The other four buttons represent the follow<strong>in</strong>g:<br />
• The signal generator which is part of the hardware <strong>in</strong>strument. Not all <strong><strong>in</strong>struments</strong> do have a signal generator. In<br />
that case the button is not visible.<br />
• The program setup<br />
• The onl<strong>in</strong>e help<br />
• The exit button<br />
Start<strong>in</strong>g the program<br />
The program can easily be started by us<strong>in</strong>g the program group created by the setup program. By double click<strong>in</strong>g the<br />
icon with the same name as the hardware <strong>in</strong>strument you are us<strong>in</strong>g, the program is started.<br />
Now an <strong>in</strong>tro screen will appear with the logo, the <strong>in</strong>strument name, the program version number and the copyright<br />
notice.<br />
After a few seconds the <strong>in</strong>tro screen disappears and the <strong>in</strong>strument taskbar appears. If <strong>in</strong> the program setup any <strong><strong>in</strong>struments</strong><br />
are set to be active at power up, these <strong><strong>in</strong>struments</strong> are switched on as well.<br />
Help<br />
For all <strong><strong>in</strong>struments</strong> onl<strong>in</strong>e help is available by press<strong>in</strong>g the Help button <strong>in</strong> the <strong>in</strong>strument taskbar or by press<strong>in</strong>g the<br />
key <strong>in</strong> a w<strong>in</strong>dow.<br />
Controll<strong>in</strong>g the <strong><strong>in</strong>struments</strong><br />
All <strong><strong>in</strong>struments</strong> are controlled by use of the mouse, the keyboard and by menus.<br />
Software<br />
19
<strong>DI</strong>-<strong>770</strong> and WINDAQ/Scope Manual<br />
Keys that can be used<br />
<br />
Force a trigger (oscilloscope)<br />
Toggle reference 1<br />
Toggle reference 2<br />
Move the left side of the record view scrollbar to the left<br />
Move the left side of the record view scrollbar to the right<br />
Move the right side of the record view scrollbar to the left<br />
Move the right side of the record view scrollbar to the right<br />
< > Move the record view scrollbar to the left<br />
< > Move the record view scrollbar to the right<br />
<br />
<br />
<br />
<br />
<br />
<br />
<br />
<br />
<br />
<br />
<br />
<br />
Set the signal coupl<strong>in</strong>g of channel 1 to AC<br />
Set the signal coupl<strong>in</strong>g of channel 2 to AC<br />
Set the signal coupl<strong>in</strong>g of channel 1 to DC<br />
Set the signal coupl<strong>in</strong>g of channel 2 to DC<br />
Toggle Envelope mode<br />
Toggle <strong>in</strong>vert of channel 1 (oscilloscope and data logger)<br />
Toggle <strong>in</strong>vert of channel 1 (oscilloscope and data logger)<br />
Switch the vertical axis of channel 1 between L<strong>in</strong>ear and Log (spectrum analyzer)<br />
Switch the vertical axis of channel 2 between L<strong>in</strong>ear and Log (spectrum analyzer)<br />
Toggle Measur<strong>in</strong>g of Maximum values (spectrum analyzer)<br />
Perform a s<strong>in</strong>gle measurement (One shot)<br />
Make a pr<strong>in</strong>tout of the current display<br />
Toggle reference 1<br />
Toggle reference 2<br />
<br />
<br />
<br />
<br />
<br />
<br />
<br />
<br />
Start or Stop measur<strong>in</strong>g<br />
View the Total measured record<br />
Switch to X-Y mode (oscilloscope)<br />
Switch to Y-t mode (oscilloscope)<br />
Call the onl<strong>in</strong>e Help<br />
Switch the time base <strong>one</strong> step slower (oscilloscope and spectrum analyzer)<br />
Switch the time base <strong>one</strong> step faster (oscilloscope and spectrum analyzer)<br />
Switch channel 1 <strong>one</strong> step more sensitive<br />
Software<br />
20
<strong>DI</strong>-<strong>770</strong> and WINDAQ/Scope Manual<br />
<br />
<br />
<br />
<br />
<br />
Switch channel 1 <strong>one</strong> step less sensitive<br />
Switch channel 2 <strong>one</strong> step more sensitive<br />
Switch channel 2 <strong>one</strong> step less sensitive<br />
Make the record length <strong>one</strong> step shorter<br />
Make the record length <strong>one</strong> step longer<br />
Controll<strong>in</strong>g with the mouse<br />
All objects <strong>in</strong> the <strong>in</strong>strument w<strong>in</strong>dows give access to the correspond<strong>in</strong>g sett<strong>in</strong>gs by click<strong>in</strong>g the right mouse button on<br />
the objects. A popup menu will appear <strong>in</strong> which related sett<strong>in</strong>gs can be altered.<br />
When the mouse is placed on an object <strong>in</strong> an <strong>in</strong>strument w<strong>in</strong>dow, <strong>in</strong>formation about the object is given with "fly over<br />
h<strong>in</strong>ts" (small rectangles with a few words of text) and some text <strong>in</strong> the h<strong>in</strong>t bar, at the bottom of the <strong>in</strong>strument w<strong>in</strong>dow.<br />
Program setup<br />
Several parts of the program can be set up to your own demands. To change those sett<strong>in</strong>gs, press the Setup button <strong>in</strong><br />
the <strong>in</strong>strument taskbar. The follow<strong>in</strong>g dialog will appear:<br />
The dialog conta<strong>in</strong>s 5 pages with related sett<strong>in</strong>gs, the pages can be selected by click<strong>in</strong>g the tabs. Sett<strong>in</strong>gs that are<br />
made <strong>in</strong> these pages are saved when the application is closed and restored when the application is started aga<strong>in</strong>. The<br />
positions and sizes of the <strong>in</strong>strument w<strong>in</strong>dows are also saved and restored.<br />
Instrument taskbar always on top<br />
It is possible to let the <strong>in</strong>strument taskbar appear always on top of the other w<strong>in</strong>dows. In that case the <strong>in</strong>strument taskbar<br />
will always be visible. The selection for that is made on the Common page, with the Instrument taskbar always on<br />
top check box.<br />
Software<br />
21
<strong>DI</strong>-<strong>770</strong> and WINDAQ/Scope Manual<br />
Sett<strong>in</strong>g display colors<br />
The colors of channel 1, channel 2, reference signal 1, reference signal 2, math signal, trigger symbol, timebase,<br />
background, grid and cursors can be set to your own preferences. Press the Display colors button on the Common<br />
page and a dialog will appear <strong>in</strong> which the sett<strong>in</strong>gs can be made.<br />
Sett<strong>in</strong>g the application language<br />
By select<strong>in</strong>g the language selection pull down on the Common page, you can select an other language to be used <strong>in</strong><br />
the application. The program will <strong>in</strong>stantly switch to the selected language. Also a help file <strong>in</strong> the selected language<br />
will be opened when the Help function is activated.<br />
Sett<strong>in</strong>g the location of files<br />
By press<strong>in</strong>g the Directories button on the Common page, it is possible to set the directories for the files the program<br />
works with. A popup menu will appear. From this menu you can select a directory which you wish to change. After<br />
select<strong>in</strong>g a directory, an <strong>in</strong>put dialog appears <strong>in</strong> which you can enter the name for directory.<br />
Default text on the pr<strong>in</strong>ter output<br />
It is possible to add three l<strong>in</strong>es of text to the application. These l<strong>in</strong>es of text will be placed on every pr<strong>in</strong>tout. They are<br />
placed on the upper left corner of the pr<strong>in</strong>tout. Enter here e.g. the company address, employee name, teleph<strong>one</strong> number<br />
etc.<br />
To enter the text, click the button Default text on the Common page and an <strong>in</strong>put dialog will appear.<br />
The three l<strong>in</strong>es of text can be entered here. To switch between the three l<strong>in</strong>es, use the key or click with the<br />
mouse <strong>in</strong> the requested l<strong>in</strong>e.<br />
This text is saved when the application is closed and loaded when the application is started.<br />
Device <strong>in</strong>fo<br />
In the lower part of the Common page some device <strong>in</strong>fo is given. Information that is displayed is:<br />
• The hardware device<br />
• The address where the hardware is found<br />
• The resolution of the hardware<br />
Depend<strong>in</strong>g on the hardware device some extra <strong>in</strong>fo can be displayed:<br />
• The date of the last calibration<br />
• The serial number<br />
Sett<strong>in</strong>g the date and time style<br />
At several places <strong>in</strong> the program dates and/or times are displayed. The way they are displayed can be set at the date<br />
and time page. For both the date and the time several styles are available to select from.<br />
Search hardware<br />
When the software is started without an <strong>in</strong>strument, a dialog appears to notify the user that the <strong>in</strong>strument is not<br />
found. It is possible to press Ignore to be able to exam<strong>in</strong>e previous saved waveforms. When the <strong>in</strong>strument is then<br />
attached to the computer, it can be searched and activated by press<strong>in</strong>g the Search hardware button on the Hardware<br />
page.<br />
Manually adjust<strong>in</strong>g of calibration factors<br />
By select<strong>in</strong>g the Adjust cal. values button at the Hardware page, a dialog appears <strong>in</strong> which the current calibration values<br />
of the <strong>in</strong>strument can be changed.<br />
Software<br />
22
<strong>DI</strong>-<strong>770</strong> and WINDAQ/Scope Manual<br />
The dialog has a grid <strong>in</strong> which for both channels the ga<strong>in</strong> and offset calibration values can be adjusted. On the right<br />
are the follow<strong>in</strong>g buttons:<br />
Cont<strong>in</strong>ue<br />
Cancel<br />
Load values<br />
Save values<br />
Apply<br />
The currently displayed values are set as the calibration values to use. Load<strong>in</strong>g of a calibration<br />
file at start-up will be disabled.<br />
All changes (<strong>in</strong>clud<strong>in</strong>g the applied) are ignored and the calibration values which were used prior<br />
to press<strong>in</strong>g the adjust cal. values button are restored.<br />
A file dialog is presented <strong>in</strong> which a file can be selected with calibration values, which has to be<br />
loaded and displayed <strong>in</strong> the grid.<br />
A file dialog is presented <strong>in</strong> which a filename can be typed or selected to which the values currently<br />
displayed <strong>in</strong> the grid can be saved.<br />
Sets the current grid values as the calibration values to use. A <strong>one</strong> shot is d<strong>one</strong> so the result is<br />
displayed. The apply is not permanent until the Cont<strong>in</strong>ue button is pressed.<br />
Restore factory calibration factors<br />
The <strong>DI</strong>-<strong>770</strong> has a set of calibration factors <strong>in</strong> EEPROM which are read at power up of the software. If the calibration<br />
factors are altered manually, the orig<strong>in</strong>al values can be restored by press<strong>in</strong>g the Restore factory cal. button.<br />
If load<strong>in</strong>g a calibration file at startup is enabled, this will be disabled by press<strong>in</strong>g the Restore factory cal. button.<br />
Load<strong>in</strong>g a set of calibration values at start up<br />
When a specific set of calibration values is made, it can be stored on disk. To use this file of calibration values at<br />
power up, place a check mark <strong>in</strong> the Use cal. file check box at the Hardware page. If no file name was selected yet, a<br />
file open dialog will appear <strong>in</strong> which a file with calibration values can be selected. If an illegal file is selected or cancel<br />
is pressed the check box will be untagged.<br />
Press<strong>in</strong>g the Restore factory cal. button will override the values from the file.<br />
When load<strong>in</strong>g calibration values from a file is enabled and a different file has to be loaded, this file can be selected by<br />
press<strong>in</strong>g the Change cal. file button at the Hardware page. If cancel is pressed or an illegal file is selected, no changes<br />
are made to the current selected calibration file.<br />
Select<strong>in</strong>g the type of duty cycle<br />
The software can use two different types of duty cycle calculation:<br />
• The normal duty cycle sett<strong>in</strong>g displays the percentage of which the period is high.<br />
• The <strong>in</strong>verted duty cycle sett<strong>in</strong>g displays the percentage of which the period is low.<br />
Selection can be made on the Duty cycle page, by select<strong>in</strong>g <strong>one</strong> of the two radio buttons. The pictures next to the<br />
radio buttons display the two types <strong>in</strong> a graphical way.<br />
Active <strong><strong>in</strong>struments</strong> at start up<br />
At the Active <strong><strong>in</strong>struments</strong> page a selection can be made which <strong><strong>in</strong>struments</strong> have to be switched on at start up of the<br />
software.<br />
Place a check <strong>in</strong> the check boxes of the <strong><strong>in</strong>struments</strong> that have to be switched on at start up of the software.<br />
Note: The data logger can not be activated at the same time as <strong>one</strong> of the other <strong><strong>in</strong>struments</strong>.<br />
When at least <strong>one</strong> <strong>in</strong>strument is selected, it is possible to select a sett<strong>in</strong>gs file that has to be loaded at start up as well.<br />
Each s<strong>in</strong>gle <strong>in</strong>strument can have its own sett<strong>in</strong>gs file.<br />
Selection of the file is d<strong>one</strong> by press<strong>in</strong>g the Change file name button on the Active <strong><strong>in</strong>struments</strong> page. In the appear<strong>in</strong>g<br />
dialog the file can be selected. The name of the selected file will be displayed <strong>in</strong> the Instrument sett<strong>in</strong>gs file box.<br />
Software<br />
23
<strong>DI</strong>-<strong>770</strong> and WINDAQ/Scope Manual<br />
To clear the file name, press the Clear button.<br />
Note: When more than <strong>one</strong> <strong>in</strong>strument is selected to be switched on at start up, the sett<strong>in</strong>gs file associated with the<br />
<strong>in</strong>strument with the highest 'priority' will be loaded. The priorities <strong>in</strong> file load<strong>in</strong>g are: highest: the data logger, then<br />
the oscilloscope, then the voltmeter and lowest the spectrum analyzer.<br />
Sav<strong>in</strong>g <strong>in</strong>strument sett<strong>in</strong>gs on disk<br />
When a certa<strong>in</strong> k<strong>in</strong>d of measurement is d<strong>one</strong> often, it is useful to save the <strong>in</strong>strument sett<strong>in</strong>g on disk and restore it<br />
each time it is needed. This will avoid each time sett<strong>in</strong>g up the <strong>in</strong>strument <strong>in</strong> the same way.<br />
To save the <strong>in</strong>strument sett<strong>in</strong>g to disk, enter the File menu from the oscilloscope, the data logger or the spectrum analyzer<br />
and select Save <strong>in</strong>strument sett<strong>in</strong>g.... A save dialog will appear <strong>in</strong> which a drive and directory can be selected<br />
and a name for the sett<strong>in</strong>g can be entered.<br />
If an <strong>in</strong>valid file name or a name of an exist<strong>in</strong>g file name is entered, a warn<strong>in</strong>g will be displayed.<br />
The sett<strong>in</strong>gs for all <strong><strong>in</strong>struments</strong> are saved <strong>in</strong> <strong>one</strong> file. This file has the extension .SET. It is an ASCII file, <strong>in</strong> a W<strong>in</strong>dows<br />
INI format.<br />
Note: This file can be edited <strong>in</strong> any ASCII editor, but it is recommended not to do so, to avoid <strong>in</strong>valid (comb<strong>in</strong>ations<br />
of) sett<strong>in</strong>gs.<br />
Restore <strong>in</strong>strument sett<strong>in</strong>gs from disk<br />
When a certa<strong>in</strong> k<strong>in</strong>d of measurement is d<strong>one</strong> often, it is useful to save the <strong>in</strong>strument sett<strong>in</strong>g on disk and restore it<br />
each time it is needed. This will avoid each time sett<strong>in</strong>g up the <strong>in</strong>strument <strong>in</strong> the same way.<br />
To restore <strong>in</strong>strument sett<strong>in</strong>gs from disk, enter the File menu <strong>in</strong> the oscilloscope, data logger or spectrum analyzer and<br />
select the Restore <strong>in</strong>strument sett<strong>in</strong>gs... item. A restore dialog will appear <strong>in</strong> which a drive, a directory and a file name<br />
can be selected.<br />
After press<strong>in</strong>g the OK button the file is loaded and all <strong><strong>in</strong>struments</strong> are set accord<strong>in</strong>g the sett<strong>in</strong>gs <strong>in</strong> the file.<br />
Stor<strong>in</strong>g measurement data on disk<br />
To save measured data for later exam<strong>in</strong>ation, it can be stored on disk. This can be d<strong>one</strong> <strong>in</strong> two ways: by activat<strong>in</strong>g the<br />
Write waveform to disk... item from the File menu <strong>in</strong> the oscilloscope, data logger or spectrum analyzer or by click<strong>in</strong>g<br />
the Write waveform button ( ).<br />
Note: The voltmeter has a completely different way of stor<strong>in</strong>g measurement data to disk. This will be discussed <strong>in</strong> the<br />
chapter voltmeter.<br />
Both ways will br<strong>in</strong>g a save dialog <strong>in</strong> which the drive, the directory and the filename can be entered. When a name is<br />
entered and the OK button is pressed, all waveforms will be saved, together with the sett<strong>in</strong>gs of the <strong>in</strong>strument and<br />
the references. Three files are written:<br />
a file with the extension .DAT, conta<strong>in</strong><strong>in</strong>g the waveform data of both channels and both references<br />
a file with the extension .GEG, conta<strong>in</strong><strong>in</strong>g the <strong>in</strong>strument sett<strong>in</strong>gs<br />
a file with the extension .REF, conta<strong>in</strong><strong>in</strong>g the reference channels sett<strong>in</strong>gs<br />
The files conta<strong>in</strong><strong>in</strong>g the sett<strong>in</strong>gs are ASCII files, with a w<strong>in</strong>dows INI file structure. The .DAT file can be either b<strong>in</strong>ary<br />
or <strong>in</strong> ASCII.<br />
When the file already exists, a warn<strong>in</strong>g will be given. When the disk is full, the file will not be written and an error<br />
will be put on the screen.<br />
Sett<strong>in</strong>g the data file type<br />
The waveform data can be stored <strong>in</strong> a b<strong>in</strong>ary and <strong>in</strong> an ASCII format.<br />
Software<br />
24
<strong>DI</strong>-<strong>770</strong> and WINDAQ/Scope Manual<br />
The b<strong>in</strong>ary format is built of records of 8 bytes large. The first two bytes are for channel 1, bytes 3 and 4 are for channel<br />
2, bytes 5 and 6 are for reference 1 and bytes 7 and 8 are for reference 2. The two bytes for each channel form a 16<br />
bits value, where 0 represents -sensitivity and 65535 represents +sensitivity.<br />
The ASCII format exists of <strong>one</strong> l<strong>in</strong>e of <strong>in</strong>formation for each sample <strong>in</strong> the record. Each l<strong>in</strong>e exists of:<br />
the sample number, related to the trigger po<strong>in</strong>t (sample number 0)<br />
the sample time, related to the trigger po<strong>in</strong>t (t=0)<br />
the voltage value for channel 1<br />
the voltage value for channel 2<br />
the voltage value for reference 1<br />
the voltage value for reference 2<br />
The items are separated by commas.<br />
The ASCII files can simply be imported <strong>in</strong> other applications, like e.g. spread sheet programs.<br />
Files <strong>in</strong> ASCII format are much larger than files <strong>in</strong> b<strong>in</strong>ary format, up to 7 times.<br />
To set the file type, enter the File menu and select the item Data file type. Choose the requested sett<strong>in</strong>g from the<br />
menu.<br />
Load<strong>in</strong>g saved measurement data from disk<br />
Previously saved waveforms can be read from disk <strong>in</strong> the oscilloscope, data logger and the spectrum analyzer. There<br />
are two ways to do this: by activat<strong>in</strong>g the Read waveform from disk item from the File menu or by click<strong>in</strong>g the Read<br />
waveform button ( ).<br />
Both ways will br<strong>in</strong>g up a load dialog <strong>in</strong> which a drive, directory and file can be selected. When a file is selected and<br />
the OK button is pressed, the waveform will be read from disk.<br />
Each waveform consists of three files: a .DAT file, a .GEG file and a .REF file. If <strong>one</strong> of these files is miss<strong>in</strong>g or the<br />
waveform data is not compatible, an error is generated.<br />
The data file type <strong>in</strong> which the data is written will be determ<strong>in</strong>ed by the software and the correct read<strong>in</strong>g functions are<br />
used.<br />
Then the data is read accord<strong>in</strong>g to the Waveform read method that is set.<br />
After read<strong>in</strong>g the data, the <strong>in</strong>strument is set to Pause (not required <strong>in</strong> the data logger) to avoid the data be<strong>in</strong>g replaced<br />
by new measured data.<br />
Note: Measurement data stored <strong>in</strong> the voltmeter can be read <strong>in</strong> the oscilloscope and the data logger.<br />
The values of display 1 of channel 1 will be placed <strong>in</strong> channel 1 of the data logger.<br />
The values of display 2 of channel 1 will be placed <strong>in</strong> Reference 1 of the data logger.<br />
The values of display 1 of channel 2 will be placed <strong>in</strong> channel 2 of the data logger.<br />
The values of display 2 of channel 2 will be placed <strong>in</strong> Reference 2 of the data logger.<br />
Sett<strong>in</strong>g the Waveform read method<br />
When a waveform is written to disk, all four channels (Ch1, Ch2, Reference 1 and Reference 2) are written to disk.<br />
There are two methods to read waveforms from disk:<br />
Read all signals <strong>in</strong> file<br />
With this method all signals that were active when the waveform was written are read. If e.g. Ch1 and Reference 2<br />
were active when the waveforms were saved, Ch1 and Reference 2 are read. the data <strong>in</strong> Ch2 and Reference 1 will<br />
rema<strong>in</strong> unchanged. Ch1 and Reference 2 will be switched on and Ch2 and Reference 1 will be switched off.<br />
Only read current displayed signals<br />
Software<br />
25
<strong>DI</strong>-<strong>770</strong> and WINDAQ/Scope Manual<br />
With this method only the currently active channels are read from the waveform file. The other channels will rema<strong>in</strong><br />
unchanged and they will rema<strong>in</strong> switched off.<br />
To select the proper waveform read method, enter the File menu, select the Waveform read method item and select<br />
the correct method. When clos<strong>in</strong>g the application, the selected method is saved <strong>in</strong> the application sett<strong>in</strong>gs file. This<br />
file is always read when start<strong>in</strong>g the application.<br />
Compar<strong>in</strong>g signals us<strong>in</strong>g the reference channels<br />
To be able to compare live signals to other signals, the oscilloscope, the data logger and the spectrum analyzer have<br />
two reference channels, R1 and R2. R1 is a reference channel for channel 1 and R2 is a reference channel for channel<br />
2. These reference channels are filled once and rema<strong>in</strong> unchanged while measur<strong>in</strong>g. The references only change when<br />
new data is stored <strong>in</strong> the references.<br />
Fill the references<br />
To fill the reference channel(s), two ways are available: copy<strong>in</strong>g the current displayed signals to the reference channels<br />
or read previously saved waveform data from disk.<br />
To copy the current live signals to the reference channels, either press the correspond<strong>in</strong>g button on the speed button<br />
tool bar ( ) or select the item Copy live to refs from the References menu. This will copy the waveform data from<br />
the active channel(s) to the correspond<strong>in</strong>g reference channel(s). The sett<strong>in</strong>gs of the channel(s) will also be copied to a<br />
special reference sett<strong>in</strong>g. If the reference channel(s) was (were) not yet displayed, it is (they are) switched on as well.<br />
To fill a reference channel with data from disk, see the paragraph on Load<strong>in</strong>g saved measurement data from disk.<br />
The data <strong>in</strong> the reference channels will rema<strong>in</strong> unchanged until new data is stored <strong>in</strong> the reference channels. The reference<br />
channels are displayed with the same record view offset and record view ga<strong>in</strong> as the live channels. Chang<strong>in</strong>g<br />
the pre trigger value will not affect the reference channels. When the record length of the live channels is changed to<br />
a shorter record after fill<strong>in</strong>g the reference channels, less data of the reference channels is displayed, but the data is<br />
kept <strong>in</strong> memory. When the record length is changed to a longer record, the part of the reference channel that was not<br />
filled, is filled with zeroes.<br />
Switch<strong>in</strong>g references on or off<br />
Switch<strong>in</strong>g a reference channel on or off can be d<strong>one</strong> by select<strong>in</strong>g the item Display Refx from the Reference menu,<br />
where x stands for 1 or 2. It can also be d<strong>one</strong> by means of a button on the speed button tool bar: for reference 1<br />
and for reference 2. When a button appears to be pressed, the correspond<strong>in</strong>g reference is switched on.<br />
Scal<strong>in</strong>g references<br />
When a reference channel is filled, the data rema<strong>in</strong>s the same until new data is stored <strong>in</strong> the reference channel. When<br />
the <strong>in</strong>put sensitivity, the software offset or the software ga<strong>in</strong> for the correspond<strong>in</strong>g channel changes, the reference<br />
channel will not change.<br />
It can be useful that when a signal is copied to a reference channel to compare live measurements with that reference<br />
channel, that the sett<strong>in</strong>gs of the reference channel will follow the sett<strong>in</strong>gs of the live channel. So when e.g. the <strong>in</strong>put<br />
sensitivity of the live channel changes, the reference channel is scaled <strong>in</strong> such a way that the live channel and the reference<br />
channel can still be compared on a 1:1 base.<br />
To do that, select the item Scale references from the Reference menu. Any change of the <strong>in</strong>put sensitivity, the software<br />
offset or the software ga<strong>in</strong> of a channel will also be applied to the reference channel. When scal<strong>in</strong>g references is<br />
switched on, a check mark is placed <strong>in</strong> the menu item.<br />
To switch Scal<strong>in</strong>g references off, select the Scale references item aga<strong>in</strong>.<br />
Software<br />
26
<strong>DI</strong>-<strong>770</strong> and WINDAQ/Scope Manual<br />
Update reference comment<br />
When a measurement is taken, three l<strong>in</strong>es of comment text can be added to the measurement. This text is saved to<br />
disk together with the waveform data and pr<strong>in</strong>ted out with the waveform. (See Add comment text to a measurement)<br />
When the reference channels are filled with data from a file and the comment text has to be changed, this can be d<strong>one</strong><br />
us<strong>in</strong>g the item Update comments ... from the Reference menu. After activat<strong>in</strong>g the item, a dialog appears <strong>in</strong> which the<br />
three l<strong>in</strong>es of text can be entered / changed. When the dialog is closed with the OK button, the new text is automatically<br />
saved to disk.<br />
Documentation of measurements<br />
In the oscilloscope, the data logger and the spectrum analyzer several features are available to document measurement<br />
data.<br />
Add comment text to a measurement<br />
For explanation and documentation, each measurement can be supplied with three l<strong>in</strong>es of text.<br />
This text will be saved together with the waveform data when the waveform is written to disk. The text will also<br />
appear on a hardcopy pr<strong>in</strong>tout.<br />
To enter the text, open the Sett<strong>in</strong>gs menu and select the item Comment... A dialog appears <strong>in</strong> which the three l<strong>in</strong>es of<br />
text can be typed. To switch between the three l<strong>in</strong>es, use the mouse or the key.<br />
Note: The text rema<strong>in</strong>s the same until new text is entered or the l<strong>in</strong>es are cleared. So when text is entered and more<br />
than <strong>one</strong> waveforms is saved or pr<strong>in</strong>ted, each waveform will have the same comment.<br />
Place a comment label<br />
When document<strong>in</strong>g a measurement, it can be useful to add some comment to a specific part of the signal. This can be<br />
d<strong>one</strong> with the special comment labels.<br />
These comment labels are placed with<strong>in</strong> the signal display at a specific position <strong>in</strong> relation to the waveform. The<br />
comment labels conta<strong>in</strong> text and can have an arrow po<strong>in</strong>t<strong>in</strong>g at a specific po<strong>in</strong>t of the waveform. The shape, the colors<br />
and the arrow can all be customized to your specific wishes. When pr<strong>in</strong>t<strong>in</strong>g the measurement, the comment labels are<br />
placed as well. To place a comment label, press the comment label button (<br />
) or activate the Add a comment label<br />
item from the Sett<strong>in</strong>gs menu.<br />
The comment label is now placed with<strong>in</strong> the signal display. It can be dragged to any position with the mouse and the<br />
arrow can be dragged to any position as well. The comment labels are waveform based, when the record view offset<br />
or the record view ga<strong>in</strong> changes, the position of the comment label rema<strong>in</strong>s the same <strong>in</strong> relation to the record.<br />
Edit a comment label<br />
To change the properties of a comment label, place the mouse po<strong>in</strong>ter on the comment label or the arrow of the comment<br />
label and press the right mouse button. A menu will pop up <strong>in</strong> which all properties can be edited.<br />
Comment text...<br />
With this item the text <strong>in</strong> the comment label can be edited. An <strong>in</strong>put dialog with a text <strong>in</strong>put box appears after activat<strong>in</strong>g.<br />
Enter the text for the comment label <strong>in</strong> the <strong>in</strong>put box. Multiple l<strong>in</strong>es can be entered and will appear <strong>in</strong> the comment<br />
label as they appear <strong>in</strong> the text <strong>in</strong>put box.<br />
Comment shape<br />
With this item the shape of the comment label can be selected. Three choices are available: a rectangular shape, a<br />
rectangular shape with rounded corners and an ellipse shape.<br />
Draw arrow<br />
With this item the arrow can be switched on or off. When the arrow is switched on, a check mark is placed <strong>in</strong> front of<br />
the menu item.<br />
Software<br />
27
<strong>DI</strong>-<strong>770</strong> and WINDAQ/Scope Manual<br />
Arrow po<strong>in</strong>t shape<br />
The arrow po<strong>in</strong>t can have different shapes: no po<strong>in</strong>t at all, a square, a circle, a triangle and an arrow. When no po<strong>in</strong>t is<br />
selected, only a l<strong>in</strong>e from the comment label to the end po<strong>in</strong>t of the arrow is drawn. When the arrow po<strong>in</strong>t is selected,<br />
a triangle is drawn that is always po<strong>in</strong>t<strong>in</strong>g away from the comment label. When Draw arrow is switched off, this item<br />
is not available.<br />
Comment colors<br />
With this choice the foreground color and the background color of the comment label and the arrow can be selected.<br />
The foreground color is used for the l<strong>in</strong>e around the comment label, for the text, for the arrow and for the l<strong>in</strong>e around<br />
the arrow po<strong>in</strong>t. The background color is used to fill the comment label and the arrow po<strong>in</strong>t.<br />
Delet<strong>in</strong>g a comment label<br />
To delete a comment label, place the mouse cursor on the comment label to delete and press the right mouse button. A<br />
menu will pop up. Select the Delete comment item to delete the comment label.<br />
Make a hard copy pr<strong>in</strong>t out<br />
To save a measurement on paper, a WYSIWYG hardcopy utility is added.<br />
The pr<strong>in</strong>tout conta<strong>in</strong>s all active signals with the sett<strong>in</strong>gs at the moment of activat<strong>in</strong>g the hardcopy function. All relevant<br />
<strong>in</strong>formation about the signals (sensitivity, offsets, ga<strong>in</strong>s, sampl<strong>in</strong>g frequency, record length etc.) are placed<br />
around the signal display.<br />
A record view <strong>in</strong>dicator is placed <strong>in</strong> the upper right corner of the pr<strong>in</strong>tout, <strong>in</strong>dicat<strong>in</strong>g which part of the measured<br />
record is displayed, where the trigger po<strong>in</strong>t is located and where the cursors are located <strong>in</strong> the record (if switched on).<br />
If cursors are switched on, the cursors are drawn (when <strong>in</strong> the display) and a table with the cursor readout is drawn.<br />
If comment labels are placed, they are pr<strong>in</strong>ted <strong>in</strong> the same way as they appear on the screen.<br />
The hardcopy can be activated <strong>in</strong> three ways: us<strong>in</strong>g the key comb<strong>in</strong>ation , us<strong>in</strong>g the pr<strong>in</strong>t button (<br />
by enter<strong>in</strong>g the File menu and select<strong>in</strong>g the Pr<strong>in</strong>t... item.<br />
) or<br />
A pr<strong>in</strong>t dialog appears <strong>in</strong> which the current selected pr<strong>in</strong>ter is <strong>in</strong>dicated. To change the selected pr<strong>in</strong>ter or the sett<strong>in</strong>gs<br />
of the selected pr<strong>in</strong>ter, press the Setup button. A new dialog appears <strong>in</strong> which another pr<strong>in</strong>ter can be selected or the<br />
sett<strong>in</strong>gs of the current pr<strong>in</strong>ter can be changed.<br />
Note: In theory all paper sizes are supported, but envelope paper sizes will give unusable results. Select<strong>in</strong>g landscape<br />
or portrait has no use, s<strong>in</strong>ce the hardcopy function forces landscape.<br />
When the correct pr<strong>in</strong>ter is selected and all sett<strong>in</strong>gs are made, press the OK button to leave the dialog. Press the Cancel<br />
button to leave the dialog without changes.<br />
The check box Color pr<strong>in</strong>t out determ<strong>in</strong>es whether a color pr<strong>in</strong>tout is made or a black and white pr<strong>in</strong>tout is made.<br />
When this box is checked and the pr<strong>in</strong>ter supports colors, a color pr<strong>in</strong>tout is made. If the pr<strong>in</strong>ter does not support colors,<br />
different shades of gray are created (by the w<strong>in</strong>dows pr<strong>in</strong>ter driver). If the box is not checked, only black is used.<br />
To start pr<strong>in</strong>t<strong>in</strong>g now, press the Pr<strong>in</strong>t button. A dialog appears, <strong>in</strong>dicat<strong>in</strong>g that the hardcopy is generated and sent to<br />
the pr<strong>in</strong>ter.<br />
End<strong>in</strong>g the program<br />
With the right most button <strong>in</strong> the <strong>in</strong>strument taskbar the application can be term<strong>in</strong>ated. The application sett<strong>in</strong>gs and<br />
<strong>in</strong>strument w<strong>in</strong>dow positions are saved on disk.<br />
Software<br />
28
<strong>DI</strong>-<strong>770</strong> and WINDAQ/Scope Manual<br />
6. The <strong>Oscilloscope</strong><br />
The oscilloscope is an <strong>in</strong>strument with which electrical voltages vary<strong>in</strong>g <strong>in</strong> time can be displayed. With the oscilloscope<br />
time dependent electrical signals can be exam<strong>in</strong>ed easily.<br />
The oscilloscope has separated voltage <strong>in</strong>puts, channels, which can be configured <strong>in</strong>dividually. It is a digital sampl<strong>in</strong>g<br />
oscilloscope. That means that the oscilloscope takes samples at fixed times. From each sample the value is determ<strong>in</strong>ed<br />
and the size is displayed at the screen. The screen is filled with all samples. Between two adjacent samples on<br />
the screen a l<strong>in</strong>e is drawn. The speed at which the samples are taken, is adjustable.<br />
Cursors are available to perform voltage, time or frequency measurements on the displayed signal.<br />
The <strong>Oscilloscope</strong><br />
29
<strong>DI</strong>-<strong>770</strong> and WINDAQ/Scope Manual<br />
Alias<strong>in</strong>g<br />
A disadvantage of digital sampl<strong>in</strong>g oscilloscopes is the fact that alias<strong>in</strong>g can occur.<br />
Alias<strong>in</strong>g occurs when a too low and therefor wrong sampl<strong>in</strong>g frequency is used. The next illustration shows how<br />
alias<strong>in</strong>g occurs.<br />
The <strong>in</strong>put signal is a triangular signal with a frequency of 1.25 kHz (upper most <strong>in</strong> the illustration). The signal is sampled<br />
at a frequency of 1 kHz. The dotted signal is the result of the reconstruction. From that triangular signal the periodical<br />
time is 4 ms, which corresponds with an apparent frequency (alias) of 250 Hz (1.25 kHz - 1 kHz).<br />
To avoid alias<strong>in</strong>g, the sample frequency must be greater than 2 times the maximum frequency of the <strong>in</strong>put signal.<br />
If you have any doubts about the displayed signal, you can set the timebase of the oscilloscope <strong>one</strong> step faster or<br />
slower and check whether the signal at the display changes accord<strong>in</strong>gly. If that does not give any clearance, you can<br />
determ<strong>in</strong>e the frequency of the <strong>in</strong>put signal with the spectrum analyzer. Therefore you must set the frequency range of<br />
the spectrum analyzer to the maximum, to avoid alias<strong>in</strong>g with the spectrum analyzer. For more <strong>in</strong>formation, see the<br />
chapter Spectrum Analyzer.<br />
Display<strong>in</strong>g channels<br />
The oscilloscope has several modes to display the two channels. To select the measure mode, enter the Measure menu<br />
and select:<br />
Ch1 measure and display only channel 1<br />
Ch2 measure and display only channel 2<br />
Ch1 and Ch2<br />
measure channel 1 and channel 2 simultaneously and display the values of both channels<br />
Note: When the measure mode Ch1 and Ch2 is selected, display<strong>in</strong>g math signals becomes available.<br />
When only <strong>one</strong> channel is measured, the controls of the other channel are disabled or removed from the display.<br />
Envelope mode<br />
When a signal is monitored and a glitch is expected, envelope mode can be switched on to be sure to see the glitch. In<br />
envelope mode, for each sample <strong>in</strong> the record a highest value and a lowest value is stored. Each measurement is<br />
checked whether the new value lies between the previous highest and lowest or not. If not, the highest or lowest value<br />
The <strong>Oscilloscope</strong><br />
30
<strong>DI</strong>-<strong>770</strong> and WINDAQ/Scope Manual<br />
is changed to the new value. Then a vertical l<strong>in</strong>e is drawn between the lowest and highest value. So a glitch is always<br />
captured.<br />
Envelope mode is reset each time when the sett<strong>in</strong>g of the <strong>in</strong>strument changes (sensitivity, offset, record length etc.),<br />
when the w<strong>in</strong>dow size changes and when the pre def<strong>in</strong>ed reset number is reached. To set the reset number, enter the<br />
Envelope menu, which can be found <strong>in</strong> the Measure menu or by click<strong>in</strong>g the right mouse button on the Envelope<br />
mode button ( ). Select the item Reset envelope after and a menu with the possible option pops up. When the<br />
choice 32 measurements is selected, envelope mode will be reset after 32 measurements. When the choice <strong>in</strong>f<strong>in</strong>ite<br />
measurements is selected, envelope mode will not be reset automatically, only by changes <strong>in</strong> the <strong>in</strong>strument sett<strong>in</strong>gs<br />
or by a w<strong>in</strong>dow size change.<br />
Envelope mode can be switched on by click<strong>in</strong>g the envelope button, by press<strong>in</strong>g the key or be select<strong>in</strong>g the item<br />
Envelope mode from the Measure menu. When envelope mode is switched on, the Envelope button stays down.<br />
Envelope mode is switched off by press<strong>in</strong>g the button aga<strong>in</strong>, press<strong>in</strong>g the key aga<strong>in</strong> or by select<strong>in</strong>g the Envelope<br />
mode menu item aga<strong>in</strong>.<br />
Note: Envelope mode is only a display function. The envelope signal is not stored to disk or pr<strong>in</strong>ted <strong>in</strong> a hardcopy<br />
operation.<br />
Averag<strong>in</strong>g<br />
When a noisy signal is measured, the <strong>in</strong>fluence of the noise can be elim<strong>in</strong>ated by averag<strong>in</strong>g several measurements.<br />
The noise comp<strong>one</strong>nt(s) will disappear and the actual signal rema<strong>in</strong>s.<br />
Averag<strong>in</strong>g can be switched on by select<strong>in</strong>g the item Perform averag<strong>in</strong>g of from the Measure menu. In the next menu a<br />
number of measurements can be selected that have to be averaged. The item 1 measurement will switch off averag<strong>in</strong>g.<br />
Averag<strong>in</strong>g can also be switched on or off by press<strong>in</strong>g the Averag<strong>in</strong>g button ( ).<br />
When averag<strong>in</strong>g is set to e.g. 20 measurements and the oscilloscope is set to Pause, press<strong>in</strong>g the One shot button will<br />
result <strong>in</strong> tak<strong>in</strong>g 20 measurements which are averaged<br />
Averag<strong>in</strong>g is reset each time when the sett<strong>in</strong>g of the <strong>in</strong>strument hardware changes (sensitivity, coupl<strong>in</strong>g, sampl<strong>in</strong>g frequency,<br />
record length etc.) and when the pre def<strong>in</strong>ed reset number is reached.<br />
Note: When a number of pre samples is set, averag<strong>in</strong>g will have a large effect on the shape of the signal <strong>in</strong> the pre<br />
samples because this part of the measured record changes much.<br />
Math mode<br />
The oscilloscope is equipped with a special Math channel. This channel can display the follow<strong>in</strong>g signals:<br />
Ch1 + Ch2<br />
Ch1 - Ch2<br />
Ch2 - Ch1<br />
These are display added or subtracted signals. This means that the on screen signal sizes are added or subtracted. The<br />
position and size of the math signal can be controlled by the software offset and software ga<strong>in</strong> of both channels.<br />
To get a math channel, both channels have to be on. Select<strong>in</strong>g a math channel is d<strong>one</strong> by select<strong>in</strong>g a menu item from<br />
the Math menu. The Math menu can be found <strong>in</strong> the ma<strong>in</strong> menu or can be called by click<strong>in</strong>g the math button ( ).<br />
H<strong>in</strong>t: When the oscilloscope operates <strong>in</strong> split screen mode and ch1 uses the upper half of the screen and ch2 uses the<br />
lower half of the screen, the math channel comes <strong>in</strong> the center of the screen.<br />
The math channel can be switched off aga<strong>in</strong> by select<strong>in</strong>g the item No math from the Math menu.<br />
The <strong>Oscilloscope</strong><br />
31
<strong>DI</strong>-<strong>770</strong> and WINDAQ/Scope Manual<br />
Sett<strong>in</strong>g up a channel<br />
The two channels of the oscilloscope are completely configurable. Both channels are identical, each has its own menu<br />
item <strong>in</strong> the ma<strong>in</strong> menu. S<strong>in</strong>ce the possibilities for both channels are equal, channel 1 is expla<strong>in</strong>ed here. Where channel<br />
1 is described, the same applies to channel 2.<br />
With the menu item Ch1 (or Ch2) from the ma<strong>in</strong> menu a popup menu is called with all sett<strong>in</strong>gs for a channel.<br />
Sett<strong>in</strong>g the sensitivity of a channel<br />
The <strong>in</strong>put sensitivity of a channel determ<strong>in</strong>es how large a certa<strong>in</strong> signal will be displayed, the lower the full scale<br />
value, the larger the signal will be displayed. It is also possible to enable an autorang<strong>in</strong>g function.<br />
The sensitivity can be set through the Sensitivity menu. The Sensitivity menu is called by enabl<strong>in</strong>g the Ch1 menu and<br />
then select<strong>in</strong>g the Sensitivity menu. In this menu the <strong>in</strong>put sensitivities are available. Also an Autorang<strong>in</strong>g sett<strong>in</strong>g is<br />
available. The Sensitivity menu can also be entered by click<strong>in</strong>g the right mouse button over <strong>one</strong> of the Ch1 or Ch2<br />
controls and readouts.<br />
To switch on Autorang<strong>in</strong>g, a special button is available. When auto rang<strong>in</strong>g is switched on, the button caption is Auto,<br />
otherwise it holds the current set <strong>in</strong>put sensitivity. Press<strong>in</strong>g the right mouse button on this button will br<strong>in</strong>g up a menu<br />
with all sensitivities.<br />
Note: When autorang<strong>in</strong>g is switched on, several measurements might be needed to set the <strong>in</strong>put sensitivity, depend<strong>in</strong>g<br />
on the <strong>in</strong>put signal.<br />
Another way to set the sensitivity is by us<strong>in</strong>g the keyboard. A few keys have been reserved for sett<strong>in</strong>g the <strong>in</strong>put sensitivity<br />
of the channels. These keys are:<br />
<br />
<br />
<br />
<br />
Increase Ch1 sensitivity<br />
Decrease Ch1 sensitivity<br />
Increase Ch2 sensitivity<br />
Decrease Ch2 sensitivity<br />
Sett<strong>in</strong>g the signal coupl<strong>in</strong>g of a channel<br />
The <strong>in</strong>put signal can be coupled directly to the ADC (DC) or through a capacitor to the ADC (AC). In the hardware, a<br />
capacitor is switched <strong>in</strong>to (AC) or out of (DC) the signal path.<br />
In COUPLING DC the complete signal (AC+DC) at the <strong>in</strong>put is passed through. In COUPLING AC only the AC<br />
comp<strong>one</strong>nt of the <strong>in</strong>put signal is passed through. It is then possible to exam<strong>in</strong>e e.g. a ±20 mV ripple on a 30 V DC<br />
voltage, s<strong>in</strong>ce only the ripple is passed through and the DC voltage not. AC voltages with a frequency lower than ±4<br />
Hz are not coupled correctly.<br />
There are three different ways to set the coupl<strong>in</strong>g. Two ways are: by click<strong>in</strong>g the coupl<strong>in</strong>g button or by press<strong>in</strong>g keys.<br />
The third way is through the Signal coupl<strong>in</strong>g menu.<br />
The Signal coupl<strong>in</strong>g menu is called by enabl<strong>in</strong>g the Ch1 menu and then select<strong>in</strong>g the Signal coupl<strong>in</strong>g menu. In this<br />
menu the sett<strong>in</strong>gs Coupl<strong>in</strong>g AC and Coupl<strong>in</strong>g DC can be found. The menu can also be entered by click<strong>in</strong>g the right<br />
mouse button over <strong>one</strong> of the Ch1 or Ch2 controls and readouts.<br />
In the tool bar for each channel a coupl<strong>in</strong>g button is found, the coupl<strong>in</strong>g button for Ch1 at the left hand side of the<br />
screen, for Ch2 at the right hand side of the screen. The picture at the button <strong>in</strong>dicates the state of the coupl<strong>in</strong>g sett<strong>in</strong>g.<br />
The left button of the two buttons below is <strong>in</strong>dicat<strong>in</strong>g AC coupl<strong>in</strong>g, the right button is <strong>in</strong>dicat<strong>in</strong>g DC coupl<strong>in</strong>g.<br />
The current coupl<strong>in</strong>g state is displayed <strong>in</strong> the coupl<strong>in</strong>g button.<br />
The <strong>Oscilloscope</strong><br />
32
<strong>DI</strong>-<strong>770</strong> and WINDAQ/Scope Manual<br />
The keys which can be used to change the signal coupl<strong>in</strong>g are:<br />
<br />
<br />
<br />
<br />
sets the coupl<strong>in</strong>g of channel 1 to AC<br />
sets the coupl<strong>in</strong>g of channel 1 to DC<br />
sets the coupl<strong>in</strong>g of channel 2 to AC<br />
sets the coupl<strong>in</strong>g of channel 2 to DC<br />
Sett<strong>in</strong>g the vertical position of a channel<br />
The vertical position of a channel on the screen is software adjustable. When sett<strong>in</strong>g the vertical position of a channel<br />
the signal is adjusted graphically after all the samples have been taken. This only affects the display<strong>in</strong>g of the signal.<br />
If the <strong>in</strong>put signal is clipped, because it is larger than the selected <strong>in</strong>put sensitivity range, and the signal is adjusted,<br />
the signal stays clipped. The clipp<strong>in</strong>g will show very clearly on the screen. The signal is cut off at the top or bottom.<br />
This position<strong>in</strong>g method is ma<strong>in</strong>ly used to move signals which overlap each other on the screen.<br />
The software position<strong>in</strong>g can be changed by us<strong>in</strong>g a menu or by dragg<strong>in</strong>g the vertical axes. To adjust the offset by<br />
means of a menu, enter the Ch1 menu and select the choice Software offset ... A dialog box appears <strong>in</strong> which the offset<br />
can be entered. The value is <strong>in</strong> Volts.<br />
The easiest way of adjust<strong>in</strong>g the offset is by dragg<strong>in</strong>g the axis. This is d<strong>one</strong> by press<strong>in</strong>g the left mouse button with<strong>in</strong><br />
the vertical axis, but not over the <strong>in</strong>verted area (on the top and bottom of the axes) and mov<strong>in</strong>g the mouse up or down<br />
while keep<strong>in</strong>g the mouse button pressed.<br />
Magnify<strong>in</strong>g or reduc<strong>in</strong>g the vertical axis<br />
The measured values can be magnified or reduced by the software, by the Software ga<strong>in</strong>. By do<strong>in</strong>g this, the vertical<br />
axes can be made larger or smaller.<br />
This can be used to display two signals of different sizes on the screen, to be compared more easily. For example: Ch1<br />
is measur<strong>in</strong>g a 5 Volt signal, Ch2 is measur<strong>in</strong>g a 4 volt signal. Set the ga<strong>in</strong> of Ch1 to 0.8 and the ga<strong>in</strong> of Ch2 to 1.<br />
Both signals are displayed with the same size.<br />
Another application is to display two signals <strong>in</strong> a 'split screen mode'. By sett<strong>in</strong>g the ga<strong>in</strong> of the channels to 0.5 and the<br />
offset of Ch1 2 divs up and the offset of Ch2 2 divs down, the channels are displayed separately.<br />
The software ga<strong>in</strong> can be changed by us<strong>in</strong>g a menu or by dragg<strong>in</strong>g the vertical axes. To adjust the software ga<strong>in</strong><br />
through the menu, enter the Ch1 menu and select the choice Software ga<strong>in</strong>... A dialog box appears <strong>in</strong> which the ga<strong>in</strong><br />
can be entered. The value of the ga<strong>in</strong> has to be between 0.25 and 4, where values smaller than 1 make the signal<br />
appear smaller and values larger than 1 make the signal appear larger. To change the software ga<strong>in</strong> by dragg<strong>in</strong>g the<br />
vertical axis, place the mouse po<strong>in</strong>ter over either the upper most or the lower most label of the vertical axis. These<br />
labels are drawn <strong>in</strong>verted. When the mouse po<strong>in</strong>ter is over <strong>one</strong> of these labels, press the left mouse button and drag<br />
the label upwards or downwards, thereby enlarg<strong>in</strong>g or shr<strong>in</strong>k<strong>in</strong>g the axis and the signal.<br />
Invert<strong>in</strong>g a channel<br />
With the software it is possible to <strong>in</strong>vert the signal of a channel. This software <strong>in</strong>vert multiplies all measured values<br />
by -1 and adapts the values along the vertical axis accord<strong>in</strong>gly.<br />
There are three ways to <strong>in</strong>vert a signal: by means of a menu, by means the keyboard and by press<strong>in</strong>g the <strong>in</strong>vert button.<br />
The Invert menu is found <strong>in</strong> the Ch1 menu. In this menu two choices are available to switch the <strong>in</strong>vert on or off.<br />
A few keys have been reserved to set the <strong>in</strong>vert:<br />
toggles the <strong>in</strong>vert of channel 1<br />
toggles the <strong>in</strong>vert of channel 2<br />
The <strong>Oscilloscope</strong><br />
33
<strong>DI</strong>-<strong>770</strong> and WINDAQ/Scope Manual<br />
In the tool bar for each channel an <strong>in</strong>vert button is found, the <strong>in</strong>vert button for Ch1 at the left hand side of the screen,<br />
for Ch2 at the right hand side of the screen. The picture at the button <strong>in</strong>dicates the state of the <strong>in</strong>vert sett<strong>in</strong>g. The left<br />
button of the two buttons below is <strong>in</strong>dicat<strong>in</strong>g Invert On, the right button is <strong>in</strong>dicat<strong>in</strong>g Invert Off.<br />
The channel view button<br />
For controll<strong>in</strong>g the software offset and the software ga<strong>in</strong> some pre def<strong>in</strong>ed sett<strong>in</strong>gs are available by press<strong>in</strong>g the channel<br />
view button.<br />
These sett<strong>in</strong>gs are:<br />
offset = 0 and ga<strong>in</strong> = 1 (us<strong>in</strong>g full screen)<br />
offset = +0.5 <strong>in</strong>put sensitivity and ga<strong>in</strong> = 0.5 (upper half of the screen)<br />
offset = -0.5 <strong>in</strong>put sensitivity and ga<strong>in</strong> = 0.5 (lower half of the screen)<br />
offset and ga<strong>in</strong> have the last value set by the user<br />
These sett<strong>in</strong>gs are available by press<strong>in</strong>g the channel view button. Each sett<strong>in</strong>g has its own picture on the button. The<br />
image below displays the above menti<strong>one</strong>d sett<strong>in</strong>gs from left to right.<br />
The image at the button <strong>in</strong>dicates the current sett<strong>in</strong>gs. Each click on the button will select the next state. If the offset<br />
or ga<strong>in</strong> are changed by other means and <strong>one</strong> of the predef<strong>in</strong>ed states is obta<strong>in</strong>ed, the button will go to that state as<br />
well, otherwise user is displayed.<br />
The channel view button for channel 1 is found at the left hand side of the display, for channel 2 at the right hand side<br />
of the display.<br />
Chang<strong>in</strong>g the units of the vertical axis<br />
Along the vertical axis, normally the voltage of the <strong>in</strong>put signal is projected. The unit of measure is then Volt and the<br />
numbers along the axis correspond with the size of the <strong>in</strong>put signal.<br />
The oscilloscope allows you to create another def<strong>in</strong>ition of the vertical axis.<br />
By means of the choice Units of measure from the Ch1 menu the units of measure of the vertical axis can be changed.<br />
After activation, a popup menu with 13 choices appears. The unit that is selected, is displayed at the top of the vertical<br />
axis. It is also placed on the paper when pr<strong>in</strong>ted out. When activat<strong>in</strong>g the choice User def<strong>in</strong>ed ... a dialog box appears,<br />
<strong>in</strong> which a custom unit can be entered, with a maximum length of 5 characters.<br />
The Units of measure popup menu can also be called by click<strong>in</strong>g the right mouse button over the vertical axes.<br />
If you are measur<strong>in</strong>g e.g. with a temperature probe, you can choose DEGREE C for the units.<br />
By activat<strong>in</strong>g the choice Units ga<strong>in</strong>... from the Ch1 menu, a multiplication factor can be entered for the units of the<br />
vertical axis. A dialog box appears <strong>in</strong> which the factor can be entered. The numbers along the vertical axis are multiplied<br />
by the factor and replaced by the result.<br />
If you are us<strong>in</strong>g a 10x probe, you can by means of units ga<strong>in</strong> enter the value 10, to get correct numbers along the vertical<br />
axis.<br />
Another application is when measur<strong>in</strong>g with a temperature probe. Suppose the temperature probe gives a voltage<br />
change of 1 volt at a temperature change of 5 degrees. By enter<strong>in</strong>g the factor 5, the temperature change is displayed<br />
directly <strong>in</strong> the number of degrees.<br />
The <strong>Oscilloscope</strong><br />
34
<strong>DI</strong>-<strong>770</strong> and WINDAQ/Scope Manual<br />
It is also possible to add an offset to the numbers of the vertical axis. In the dialog box called by activat<strong>in</strong>g Units offset...<br />
from the Ch1 menu, an offset can be entered. This offset is added to the numbers along the vertical axis. Noth<strong>in</strong>g<br />
is d<strong>one</strong> to the signal.<br />
An application for this is the temperature measurement. Suppose the output voltage of the temperature probe at 0 C is<br />
+10 Volt. By enter<strong>in</strong>g a units offset of -10, the zero level of the axis is changed <strong>in</strong> a way that the absolute temperature<br />
is directly readable.<br />
Mouse sensitivity for the vertical axis<br />
For dragg<strong>in</strong>g the vertical axis, the mouse sensitivity can be adjusted from course to f<strong>in</strong>e, from 1 step per division to<br />
25 steps per division.<br />
When a mouse sensitivity of 1 step per division is selected, each mouse movement will make the software offset<br />
become <strong>one</strong> division larger or smaller. When the software ga<strong>in</strong> is adjusted, it will result <strong>in</strong> a two division smaller or<br />
larger signal size (<strong>one</strong> division at the top and <strong>one</strong> division at the bottom of the signal).<br />
When the mouse sensitivity is set to 25 steps per division each mouse movement will result <strong>in</strong> an offset change of 1/<br />
25th division or a signal size change of 2/25th division.<br />
The mouse sensitivity can be set by select<strong>in</strong>g the item Mouse sensitivity vertical axis from the Ch1 menu.<br />
Sett<strong>in</strong>g up the time axis<br />
Along the horizontal axis of an oscilloscope the measur<strong>in</strong>g time is projected. The measur<strong>in</strong>g time is determ<strong>in</strong>ed by<br />
the number of samples that is measured and the sample frequency<br />
Sett<strong>in</strong>g the sample frequency<br />
The sample frequency determ<strong>in</strong>es the speed with which the <strong>in</strong>strument will take samples of the <strong>in</strong>put signal(s).<br />
The sample frequency can be set <strong>in</strong> two ways: us<strong>in</strong>g the menu of by means of special function keys.<br />
To change the sample frequency us<strong>in</strong>g the menu, enter the Time base menu and select the Sample frequency item. A<br />
new menu will appear with all possible sample frequency sett<strong>in</strong>gs. Together with the sample frequency the maximum<br />
total measure time with the current record length and a pre trigger value of 0% is given. The Time base menu can also<br />
be entered by press<strong>in</strong>g the right mouse button over <strong>one</strong> of the time base controls or read outs.<br />
The last item <strong>in</strong> the menu is a user def<strong>in</strong>ed sett<strong>in</strong>g. Activat<strong>in</strong>g this item will br<strong>in</strong>g up a dialog box <strong>in</strong> which a self<br />
def<strong>in</strong>ed sample frequency (with<strong>in</strong> the <strong>in</strong>strument hardware limitations) can be entered. Due to the way the sample frequency<br />
is generated <strong>in</strong> the hardware, not all frequencies can be generated. If an <strong>in</strong>valid sample frequency is entered,<br />
the closest valid sample frequency will be generated.<br />
The follow<strong>in</strong>g keys can be used to change the sample frequency:<br />
<br />
<br />
Set the sample frequency <strong>one</strong> step slower<br />
Set the sample frequency <strong>one</strong> step faster<br />
Note: Because the record length, the number of post samples and the record view<strong>in</strong>g ga<strong>in</strong> are free settable, it is very<br />
difficult to set the time base <strong>in</strong> a certa<strong>in</strong> number of sec/div. Therefor the sampl<strong>in</strong>g frequency is set.<br />
Sett<strong>in</strong>g the record length<br />
The oscilloscope takes a number of samples to display the <strong>in</strong>put signal. This number of samples is called the Record<br />
length. To change the record length, two ways are available: by means of a menu or by means of function keys.<br />
To change the record length us<strong>in</strong>g the menu, enter the Time base menu and select the Record length item. Another<br />
menu will pop up, conta<strong>in</strong><strong>in</strong>g the available record lengths and an item for a user def<strong>in</strong>ed record length. Select<strong>in</strong>g this<br />
item will br<strong>in</strong>g up a dialog box <strong>in</strong> which a self def<strong>in</strong>ed record length (with<strong>in</strong> the <strong>in</strong>strument hardware limits) can be<br />
The <strong>Oscilloscope</strong><br />
35
<strong>DI</strong>-<strong>770</strong> and WINDAQ/Scope Manual<br />
entered. The Time base menu can also be entered by press<strong>in</strong>g the right mouse button over <strong>one</strong> of the time base controls<br />
or read outs.<br />
For chang<strong>in</strong>g the record length the follow<strong>in</strong>g function keys are available:<br />
<br />
<br />
Select a shorter record length<br />
Select a longer record length<br />
Select<strong>in</strong>g another record length will change the total measure time, but the pre trigger value will keep the same value.<br />
Sett<strong>in</strong>g the pre trigger value<br />
The oscilloscope is equipped with a trigger system. This trigger system monitors the <strong>in</strong>put signal(s) and determ<strong>in</strong>es,<br />
based on the sett<strong>in</strong>gs of the trigger system and the <strong>in</strong>put signal, when measur<strong>in</strong>g and display<strong>in</strong>g the signal(s) has to<br />
start.<br />
The moment of trigger, the trigger po<strong>in</strong>t, can be placed at any position <strong>in</strong> the record with measured data. This will<br />
result <strong>in</strong> a certa<strong>in</strong> number of samples before the trigger po<strong>in</strong>t (pre samples) and a number of samples after the trigger<br />
po<strong>in</strong>t (post samples). Pre and post samples together form the record length. The position of the trigger po<strong>in</strong>t is<br />
referred to as the pre trigger value, <strong>in</strong>dicat<strong>in</strong>g how many pre samples are recorded <strong>in</strong> the total record. Usually (and<br />
default) this number is given <strong>in</strong> a percentage of the record length, but it can be given <strong>in</strong> a number of samples or <strong>in</strong> a<br />
time value as well.<br />
To change the pre trigger value, two ways are possible: by a menu or with the special trigger position scroll bar,<br />
which is located below the signal display.<br />
This special scroll bar represents the complete record and the slider (^) represents the trigger po<strong>in</strong>t. In the above picture,<br />
the trigger po<strong>in</strong>t is set to 25%. To change the trigger po<strong>in</strong>t, place your mouse po<strong>in</strong>ter over the arrow (the mouse<br />
po<strong>in</strong>ter will change shape), press the left mouse button and drag the slider to the position you want it to have. When<br />
<strong>one</strong> of the small buttons at the left hand side or the right hand side of the scroll bar are clicked, the pre trigger value<br />
will change by 1%.<br />
When the mouse is clicked with<strong>in</strong> the scroll bar, but not on the slider, the pre trigger value will <strong>in</strong>crease or decrease<br />
by 5%, depend<strong>in</strong>g on whether the mouse is clicked to the right or to the left of the slider. When the mouse button<br />
rema<strong>in</strong>s pressed, an auto repeat function will be activated.<br />
To change the pre trigger value by us<strong>in</strong>g the menu, enter the Time base menu and select the Pre trigger value item.<br />
this will br<strong>in</strong>g up a menu with 5 pre trigger value options and a user def<strong>in</strong>ed option.<br />
The pre trigger value options are default given <strong>in</strong> a percentage, but can be given <strong>in</strong> a number of samples or <strong>in</strong> time. To<br />
do that, first the user def<strong>in</strong>ed option has to be selected. The Time base menu can also be entered by press<strong>in</strong>g the right<br />
mouse button over <strong>one</strong> of the time base controls or read outs.<br />
When the user def<strong>in</strong>ed option is selected, a dialog box appears. In this dialog box can be selected <strong>in</strong> what unit the pre<br />
trigger value has to be entered (percentage, samples or time) and what the pre trigger value has to be. When the dialog<br />
box is closed us<strong>in</strong>g the OK button, the entered value is accepted and the selected unit will be used the next time the<br />
pre trigger value menu is called.<br />
Mouse sensitivity pre trigger position adjustment<br />
For adjust<strong>in</strong>g the pre trigger value by dragg<strong>in</strong>g the slider of the pre trigger position scroll bar, the mouse sensitivity<br />
can be adjusted from course to f<strong>in</strong>e, from 4 steps per screen to 100 steps per screen.<br />
When a mouse sensitivity of 4 steps per screen is selected, the pre trigger position scroll bar is divided <strong>in</strong> 4 positions.<br />
Each mouse movement will adjust the pre trigger value to the next position <strong>in</strong> the direction the mouse is moved. So<br />
the available pre trigger positions are 0%, 25%, 50%, 75% and 100%.<br />
The <strong>Oscilloscope</strong><br />
36
<strong>DI</strong>-<strong>770</strong> and WINDAQ/Scope Manual<br />
When a mouse sensitivity of 10 steps per screen is selected, the available pre trigger positions are 0%, 10%, 20%,<br />
30%, ..., 90% and 100%.<br />
When the mouse sensitivity is set to 100 steps per screen each mouse movement will result <strong>in</strong> a pre trigger value<br />
change of 1%.<br />
Note: The mouse sensitivity does not affect adjust<strong>in</strong>g the pre trigger value by click<strong>in</strong>g the buttons of the scroll bar or<br />
by click<strong>in</strong>g <strong>in</strong> the scrollbar outside the slider.<br />
To set the Mouse sensitivity, enter the Time base menu and select Mouse sensitivity pre trigger position adjustment.<br />
In the menu that pops up, the choices are available.<br />
Magnify<strong>in</strong>g the horizontal axis<br />
The software supports a wide range of record lengths which can all been viewed completely. A special display<strong>in</strong>g<br />
algorithm guarantees that when-ever the record length is larger than the display size, no amplitude <strong>in</strong>formation will<br />
be lost.<br />
To take a closer look at a smaller part of the record, that part can be magnified to fill the screen. This is d<strong>one</strong> with the<br />
record view ga<strong>in</strong>, which is completely variable between 1.0 (full record view) and a value depend<strong>in</strong>g on the <strong>in</strong>strument<br />
w<strong>in</strong>dow width (about 40 - about 80).<br />
Adjust<strong>in</strong>g the record view ga<strong>in</strong> can be d<strong>one</strong> through a menu and by means of the special record view scroll bar.<br />
To change the record view ga<strong>in</strong> by means of a menu, enter the Time base menu and select the Record view ga<strong>in</strong> item.<br />
This will br<strong>in</strong>g up a dialog box <strong>in</strong> which the requested record view ga<strong>in</strong> can be entered. The Time base menu can also<br />
be entered by press<strong>in</strong>g the right mouse button over <strong>one</strong> of the time base controls or read outs.<br />
Sett<strong>in</strong>g the horizontal position of the signal(s)<br />
When a record view ga<strong>in</strong> > 1 is selected, only a part of the record is visible. To view a certa<strong>in</strong> part of the record, a<br />
record view offset can be applied.<br />
Apply<strong>in</strong>g a record view offset can be d<strong>one</strong> by means of the special record view scroll bar and by means of a menu.<br />
To use the menu, enter the Time base menu and select the Record view offset item. A dialog box will appear <strong>in</strong> which<br />
the record view offset can be entered, <strong>in</strong> seconds. When the trigger position is not equal to 0, a negative value will<br />
make pre samples visible, a positive value will make post samples visible. The Time base menu can also be entered<br />
by press<strong>in</strong>g the right mouse button over <strong>one</strong> of the time base controls or read outs.<br />
When the record view ga<strong>in</strong> is equal to 1.0, the Record view offset item is not available <strong>in</strong> the menu.<br />
The record view scroll bar<br />
For an easy way of adjust<strong>in</strong>g the record view ga<strong>in</strong> and the record view offset, the oscilloscope is equipped with a special<br />
record view scroll bar, located under the signal display.<br />
The dark gray part of the scroll bar represents the measured record, the slider (light gray) represents the visible part of<br />
the record. The red l<strong>in</strong>es represent the position of the cursors. If the cursors are not switched on, no red l<strong>in</strong>es are visible.<br />
To change the record view ga<strong>in</strong>, place the mouse po<strong>in</strong>ter on the left hand side or the right hand side of the slider (the<br />
mouse po<strong>in</strong>ter will change shape), click the left mouse button and drag the side of the slider to the position you want.<br />
Simultaneously the record view ga<strong>in</strong> will be adjusted and the signal <strong>in</strong> the display changes accord<strong>in</strong>gly.<br />
Note: The m<strong>in</strong>imum slider width is 10 display pixels and the scroll bar width is dependent of the w<strong>in</strong>dow size, so the<br />
maximum ga<strong>in</strong> is limited to (scroll bar width <strong>in</strong> pixels / 10). With a large w<strong>in</strong>dow, the record view ga<strong>in</strong> can be set to a<br />
larger value than with a small w<strong>in</strong>dow size.<br />
The <strong>Oscilloscope</strong><br />
37
<strong>DI</strong>-<strong>770</strong> and WINDAQ/Scope Manual<br />
To change the record view offset, place the mouse po<strong>in</strong>ter anywhere on the slider, except on the left hand side or the<br />
right hand side. The mouse po<strong>in</strong>ter will not change shape. Press the left mouse button and drag the slider to the position<br />
you want. The record view offset will be adjusted and the signal <strong>in</strong> the display changes accord<strong>in</strong>gly.<br />
When the small buttons are clicked, the record view offset is <strong>in</strong>creased or decreased by 1 sample. When the mouse is<br />
clicked with<strong>in</strong> the scroll bar but outside the slider, the record view offset is <strong>in</strong>creased or decreased by 5 samples,<br />
depend<strong>in</strong>g on which side of the scroll bar is clicked. When the mouse button is kept pressed, an auto repeat function<br />
is activated.<br />
Trigger<strong>in</strong>g<br />
To be able to exam<strong>in</strong>e a signal, the moment of display<strong>in</strong>g the signal has to be adjustable. Therefore an oscilloscope is<br />
equipped with a trigger<strong>in</strong>g system. This functions as follows:<br />
The <strong>in</strong>put signal is compared with two levels <strong>in</strong> the trigger system: the arm<strong>in</strong>g level and the fir<strong>in</strong>g level. When the<br />
<strong>in</strong>put signal passes the arm<strong>in</strong>g level, the trigger system is armed. If the <strong>in</strong>put signal passes the fir<strong>in</strong>g level, the trigger<br />
system becomes active and 'fires' a pulse. This pulse is used to start the display of the signal.<br />
The arm<strong>in</strong>g level and the fir<strong>in</strong>g level are coupled to each other by the trigger hysteresis and their level is determ<strong>in</strong>ed<br />
by the trigger level. The fir<strong>in</strong>g level corresponds to the trigger level. The trigger hysteresis def<strong>in</strong>es at which signal<br />
size change can be triggered, the change has to be that large that both levels are passed. With a small trigger hysteresis<br />
it is possible to trigger on small signals. If a signal conta<strong>in</strong>s a lot of noise, a small trigger hysteresis causes trigger<strong>in</strong>g<br />
on the noise, <strong>in</strong>stead of the orig<strong>in</strong>al signal, which gives an unstable display. A trigger hysteresis larger than the noise<br />
level is then necessary.<br />
In the illustration a signal and the two levels are displayed. In this case it is triggered on the ris<strong>in</strong>g slope of the signal.<br />
The signal passes the two levels from low to high. When trigger<strong>in</strong>g on the fall<strong>in</strong>g slope of a signal, the two levels are<br />
swapped. Then the signal has to pass the two levels from high to low, to generate a trigger.<br />
Select<strong>in</strong>g the trigger source<br />
The trigger system can have different sources to determ<strong>in</strong>e when measur<strong>in</strong>g has to start. These sources are:<br />
Ch1 Trigger on channel 1<br />
Ch2 Trigger on channel 2<br />
External<br />
Ch1 AND Ch2<br />
Ch1 OR Ch2<br />
Trigger on the external trigger <strong>in</strong>put<br />
Trigger on channel 1 and channel 2; the signals on both channels have to meet their trigger sett<strong>in</strong>gs<br />
Trigger on channel 1 or channel 2; only <strong>one</strong> of signals has to meet its trigger sett<strong>in</strong>g.<br />
The <strong>Oscilloscope</strong><br />
38
<strong>DI</strong>-<strong>770</strong> and WINDAQ/Scope Manual<br />
To change the trigger source, enter the Trigger menu and select the Source item. In this menu a source can be<br />
selected. The trigger menu can be found <strong>in</strong> the ma<strong>in</strong> menu and can be called by click<strong>in</strong>g the trigger button (<br />
) or<br />
by press<strong>in</strong>g the right mouse button when the mouse is over <strong>one</strong> of the trigger controls or readouts.<br />
Select<strong>in</strong>g the trigger mode<br />
The trigger system has several trigger modes:<br />
Ris<strong>in</strong>g slope<br />
Fall<strong>in</strong>g slope<br />
trigger on the ris<strong>in</strong>g slope of a signal<br />
trigger on the fall<strong>in</strong>g slope of a signal<br />
To change the trigger mode, enter the Trigger menu and select the Trigger mode item. A menu will popup and a trigger<br />
mode selection can be made. Another way to change the trigger mode is by us<strong>in</strong>g the trigger symbol. Double<br />
click<strong>in</strong>g the left mouse button on the trigger symbol will change the trigger mode from:<br />
Fall<strong>in</strong>g slope to Ris<strong>in</strong>g slope<br />
Ris<strong>in</strong>g slope to Fall<strong>in</strong>g slope<br />
Sett<strong>in</strong>g the trigger level<br />
Adjust<strong>in</strong>g a trigger level can be d<strong>one</strong> is several ways: by means of a menu or by us<strong>in</strong>g the special trigger symbol.<br />
To change a trigger level by means of a menu, enter the Trigger menu and select the Level Ch1 ... or Level Ch2 ...<br />
item. An <strong>in</strong>put dialog appears <strong>in</strong> which the trigger level can be entered, <strong>in</strong> volts.<br />
In this dialog, also a check box for select<strong>in</strong>g auto level trigger<strong>in</strong>g is found. When auto level trigger<strong>in</strong>g is selected, the<br />
trigger level will be set to a value that lies <strong>in</strong> the middle between the highest and the lowest value of the previous<br />
measurement. This can be very useful with cont<strong>in</strong>uously chang<strong>in</strong>g signals. When auto level trigger<strong>in</strong>g is selected, the<br />
trigger symbol will show that with a letter A <strong>in</strong> the symbol. The level can no longer be adjusted with the symbol.<br />
Note: When a trigger source External is selected the trigger level adjustment is disabled.<br />
Sett<strong>in</strong>g the trigger hysteresis<br />
Adjust<strong>in</strong>g a trigger hysteresis can be d<strong>one</strong> <strong>in</strong> several ways: by means of a menu or by us<strong>in</strong>g the special trigger symbol.<br />
To change a trigger hysteresis by means of a menu, enter the Trigger menu and select the Hysteresis Ch1 ... or Hysteresis<br />
Ch2 ... item. An <strong>in</strong>put dialog appears <strong>in</strong> which the trigger hysteresis can be entered, <strong>in</strong> volts.<br />
When auto level trigger<strong>in</strong>g is selected, the trigger symbol will show that with a letter A <strong>in</strong> the symbol. The hysteresis<br />
can still be adjusted with the symbol.<br />
Note: When a trigger source External is selected the trigger hysteresis adjustment is disabled.<br />
The trigger symbol<br />
The oscilloscope is equipped with a special trigger symbol, that is used to adjust the trigger level, the trigger hysteresis<br />
and the trigger mode. The WYSIWYG trigger symbol is found at the left hand side or the right hand side of the<br />
signal display, depend<strong>in</strong>g on the trigger source.<br />
The <strong>Oscilloscope</strong><br />
39
<strong>DI</strong>-<strong>770</strong> and WINDAQ/Scope Manual<br />
In the above picture, the trigger mode of the left hand symbol is set to Ris<strong>in</strong>g slope and the trigger mode of the right<br />
hand symbol is set to Fall<strong>in</strong>g slope.<br />
To adjust the trigger level us<strong>in</strong>g the trigger symbol, place the mouse po<strong>in</strong>ter on the trigger symbol, <strong>in</strong> the area that is<br />
marked adjust trigger level <strong>in</strong> the above picture. The mouse po<strong>in</strong>ter will change to a symbol. Press the left mouse<br />
button and drag the trigger symbol to the correct position, while keep<strong>in</strong>g the left mouse button pressed. While dragg<strong>in</strong>g,<br />
the trigger level is adjusted accord<strong>in</strong>g the position of the trigger symbol on the screen. When the mouse button<br />
is released, trigger level adjustment stops and the normal mouse po<strong>in</strong>ter shape is returned.<br />
To adjust the trigger hysteresis us<strong>in</strong>g the trigger symbol, place the mouse po<strong>in</strong>ter on the trigger symbol, <strong>in</strong> the area<br />
that is marked adjust trigger hysteresis <strong>in</strong> the above picture. The mouse po<strong>in</strong>ter will change to a symbol. Press<br />
the left mouse button and drag the hysteresis level of the trigger symbol to the correct position, while keep<strong>in</strong>g the left<br />
mouse button pressed. While dragg<strong>in</strong>g, the trigger hysteresis is adjusted accord<strong>in</strong>g the size of the trigger symbol.<br />
When the mouse button is released, trigger hysteresis adjustment stops and the normal mouse po<strong>in</strong>ter shape is<br />
returned.<br />
To adjust the trigger mode us<strong>in</strong>g the trigger symbol, place the mouse po<strong>in</strong>ter on the trigger symbol and double click<br />
the left mouse button. The trigger mode will change from:<br />
Fall<strong>in</strong>g slope to Ris<strong>in</strong>g slope<br />
Ris<strong>in</strong>g slope to Fall<strong>in</strong>g slope<br />
The trigger time out<br />
When the <strong>in</strong>put signal does not meet the trigger conditions, no new measurement data will be displayed and the last<br />
displayed signal will rema<strong>in</strong> on the screen. This can be very <strong>in</strong>convenient with unknown signals, s<strong>in</strong>ce it is not known<br />
how the trigger system has to be set. To provide <strong>in</strong> that case for a representation of the <strong>in</strong>put signal on the screen, a<br />
trigger time out sett<strong>in</strong>g is available.<br />
With the time out sett<strong>in</strong>g it is determ<strong>in</strong>ed how long the delay will be for a trigger pulse. If that time expires, a trigger<br />
pulse is forced by the software and the available data will be displayed. This will not result <strong>in</strong> a stable display, but it<br />
will give an impression how the trigger has to be set.<br />
To set the trigger time out, enter the Trigger menu and select the Time out ... item. An <strong>in</strong>put dialog will come up <strong>in</strong><br />
which the time out time can be entered, <strong>in</strong> seconds.<br />
When a time of zero is entered, there will be no trigger time out, but no trigger<strong>in</strong>g as well. As soon as a signal is displayed,<br />
the <strong>in</strong>strument will be set up for a new measurement and immediately a trigger pulse is generated, without<br />
wait<strong>in</strong>g for a trigger. This can be useful when e.g. a slowly chang<strong>in</strong>g DC level has to be monitored, on which can't be<br />
triggered.<br />
In the dialog also a check box for an <strong>in</strong>f<strong>in</strong>ite time out is available. When this box is checked, the software will keep<br />
wait<strong>in</strong>g for the <strong>in</strong>put signal to meet the trigger sett<strong>in</strong>gs, without ever forc<strong>in</strong>g a trigger pulse. This can be very useful <strong>in</strong><br />
<strong>one</strong> shot measurements and with auto disk measur<strong>in</strong>g.<br />
Perform<strong>in</strong>g measurements<br />
When the oscilloscope is completely set up, measurements can be performed.<br />
By default the oscilloscope is always measur<strong>in</strong>g and display<strong>in</strong>g. Changes that are made <strong>in</strong> the sett<strong>in</strong>gs can be made<br />
while measur<strong>in</strong>g and will be executed while measur<strong>in</strong>g, so the effects are immediately visible.<br />
Stopp<strong>in</strong>g the measurements<br />
To avoid a new screen of measurement data replac<strong>in</strong>g an old screen, measur<strong>in</strong>g and display<strong>in</strong>g of data can be stopped.<br />
This can be d<strong>one</strong> <strong>in</strong> several ways: by press<strong>in</strong>g the Pause button (<br />
item Stop cont<strong>in</strong>uous measur<strong>in</strong>g from the Measure menu.<br />
), by press<strong>in</strong>g the key or by activat<strong>in</strong>g the<br />
The <strong>Oscilloscope</strong><br />
40
<strong>DI</strong>-<strong>770</strong> and WINDAQ/Scope Manual<br />
When measur<strong>in</strong>g is stopped, the latest measured data will rema<strong>in</strong> on the screen. The Pause button changes to a Play<br />
button ( ) and the One shot button ( ) becomes available.<br />
The measured signal can now be exam<strong>in</strong>ed.<br />
To perform a s<strong>in</strong>gle measurement, press the One shot button, press the key or activate the Perform a s<strong>in</strong>gle measurement<br />
item from the Measure menu.<br />
Cont<strong>in</strong>uous measur<strong>in</strong>g can be started aga<strong>in</strong> by press<strong>in</strong>g the Play button, the key or the item Start cont<strong>in</strong>uous measur<strong>in</strong>g<br />
from the Measure menu. The One shot button will be disabled aga<strong>in</strong>.<br />
Perform Auto disk measurements<br />
The oscilloscope can store measurement data automatically on disk. This is very useful when e.g. an <strong>in</strong>terference<br />
glitch has to be measured. Suppose that at unpredictable times a glitch occurs. By us<strong>in</strong>g the auto disk measurements,<br />
the oscilloscope will wait for the glitch to occur. When the glitch occurs, it is measured and the data is stored on disk.<br />
The time and date of the measurement are stored as well.<br />
To activate the auto disk function, first set up the oscilloscope to the appropriate sett<strong>in</strong>gs (<strong>in</strong>put sensitivity, sample<br />
frequency, record length etc.) Then, enter the Measure menu and select the Auto disk item. A special auto disk dialog<br />
will appear. In this dialog, a target disk, a target directory and a name for the files can be selected. For the file name,<br />
only 5 characters can be entered, three characters will be added by the software for a file serial number. At the bottom<br />
of the dialog a bar graph is display<strong>in</strong>g the available disk space on the selected drive.<br />
The trigger system of the oscilloscope has a time out function. When the <strong>in</strong>put signal does not meet the trigger conditions<br />
with<strong>in</strong> a certa<strong>in</strong> time, a trigger is forced. This is used to see an unknown signal. This feature can be unwanted <strong>in</strong><br />
the auto disk function, therefor a Time out <strong>in</strong>f<strong>in</strong>ite check mark is available to set the time out to <strong>in</strong>f<strong>in</strong>ite. Then the<br />
oscilloscope will keep wait<strong>in</strong>g for the <strong>in</strong>put signal to meet the trigger conditions.<br />
When all is set, press the Start button to start the auto disk measurements. The Cancel button will change to a Stop<br />
button and measur<strong>in</strong>g takes place.<br />
The auto disk measurements stop when the Stop button is pressed or when the disk is full.<br />
Note: In the root of a disk only 128 files can be stored. A RAM drive has a user def<strong>in</strong>able number of entries (default<br />
64) and can store no more files than there are entries available. The auto disk function will stop with a disk full error<br />
when this number of files are written. However, DOS or W<strong>in</strong>dows might still report a certa<strong>in</strong> amount of free space on<br />
the disk. To be able to store more files, create a directory on the disk and store the files <strong>in</strong> that directory. A directory<br />
can conta<strong>in</strong> many more files.<br />
Note: The auto disk function can store only 999 files, due to the three characters that are used for creat<strong>in</strong>g the file<br />
serial number.<br />
Auto setup<br />
When an unknown signal is connected to the oscilloscope, the easiest way to setup the oscilloscope is by us<strong>in</strong>g the<br />
Auto setup function.<br />
The Auto setup function is activated by select<strong>in</strong>g the item Auto setup from the Measure menu or by press<strong>in</strong>g the Auto<br />
setup button ( ).<br />
This function sets the sensitivity for both channels to auto rang<strong>in</strong>g, so the optimal signal size is obta<strong>in</strong>ed. Also the<br />
trigger level of the channel that is the trigger source is set to auto level, to <strong>in</strong>sure there is always a trigger.<br />
Then the time base is set <strong>in</strong> a way that the signal at the channel that is triggered on, is displayed with 2 to 6 periods.<br />
The auto setup function does noth<strong>in</strong>g to the signal coupl<strong>in</strong>g, the measure mode (ch1, ch2 or ch1 and ch2) or the trigger<br />
source.<br />
The <strong>Oscilloscope</strong><br />
41
<strong>DI</strong>-<strong>770</strong> and WINDAQ/Scope Manual<br />
Zoom<strong>in</strong>g<br />
When a certa<strong>in</strong> part of the screen has to be enlarged to full screen, the zoom function is the easiest way to do that.<br />
The zoom function is activated by press<strong>in</strong>g the zoom button ( ). This button stays down until the zoom function is<br />
f<strong>in</strong>ished.<br />
When the zoom function is activated, a rectangular area <strong>in</strong> the signal display can be selected with the mouse. Place<br />
the mouse at <strong>one</strong> of the corners of the rectangle, press the left mouse button, keep it pressed and drag the mouse to the<br />
opposite corner of the rectangle. While dragg<strong>in</strong>g, a dashed rectangle is drawn. When the rectangle has the correct<br />
size, release the mouse button. The zoom<strong>in</strong>g function will f<strong>in</strong>ish and the software offset and ga<strong>in</strong> of both channels and<br />
the record view offset and ga<strong>in</strong> are adjusted to the values that result <strong>in</strong> view<strong>in</strong>g the selected part of the screen.<br />
Perform<strong>in</strong>g cursor measurements<br />
To perform measurements on the measured data, two pairs of cursors are available. Each cursor pair exists of a horizontal<br />
and a vertical cursor that can be placed anywhere <strong>in</strong>side or outside the signal display. Where the two cursors<br />
cross each other, a l<strong>in</strong>k is made. For the left cursor this l<strong>in</strong>k is p<strong>in</strong>k, for the right cursor this l<strong>in</strong>k is black.<br />
Switch<strong>in</strong>g on cursors<br />
To switch on cursors, enter the Cursors menu and select the Large cursors item or the Small cursors item. Large cursors<br />
are drawn from the left to the right hand side of the signal display or from the top to the bottom of the signal display.<br />
Small cursors only form a small cross. The Cursors menu can be found <strong>in</strong> the ma<strong>in</strong> menu or can be called by<br />
click<strong>in</strong>g the right mouse button <strong>in</strong> the signal display. When the cursors are switched on, a special cursor readout w<strong>in</strong>dow<br />
appears as well.<br />
The cursors are waveform based. This means that the cursor position is related to the waveform. If the record view<br />
offset or record view ga<strong>in</strong> is changed, the cursor position will rema<strong>in</strong> at the same position <strong>in</strong> the waveform. If the<br />
<strong>in</strong>put sensitivity, the software offset or software ga<strong>in</strong> is changed, the cursor will stay at the same voltage level.<br />
Because of this, cursors can get off screen. In the record view scroll bar two red l<strong>in</strong>es are drawn to <strong>in</strong>dicate the position<br />
of the cursors <strong>in</strong> the record.<br />
To position a cursor, br<strong>in</strong>g the mouse po<strong>in</strong>ter on the cursor to position. The mouse po<strong>in</strong>ter will change shape:<br />
position a horizontal cursor<br />
position a vertical cursor<br />
position a cursor pair<br />
H<strong>in</strong>t: To position an off screen cursor, br<strong>in</strong>g the mouse po<strong>in</strong>ter to the edge of the signal display at which the cursor<br />
exceeds. The mouse po<strong>in</strong>ter will change shape.<br />
Now press the left mouse button and drag the cursor to the correct position. When that is reached, release the left<br />
mouse button. The orig<strong>in</strong>al mouse po<strong>in</strong>ter shape is restored.<br />
Sett<strong>in</strong>g up the cursor measurements<br />
With the cursors it is possible to measure the <strong>in</strong>put signal(s) <strong>in</strong> several ways. To set up the cursor measurements,<br />
press the sett<strong>in</strong>gs button at the cursor readout w<strong>in</strong>dow (the right most button at the left top of the w<strong>in</strong>dow caption) A<br />
menu appears, conta<strong>in</strong><strong>in</strong>g the follow<strong>in</strong>g options. The menu can also be called by press<strong>in</strong>g the right mouse button over<br />
the table.<br />
Voltmeter measurements<br />
All measurements which can be selected <strong>in</strong> the voltmeter measurements submenu are also available <strong>in</strong> the voltmeter.<br />
The only difference between the measurements is that the voltmeter uses the previous two measurement values and<br />
The <strong>Oscilloscope</strong><br />
42
<strong>DI</strong>-<strong>770</strong> and WINDAQ/Scope Manual<br />
the current measured values which are added together and meaned before the value is displayed. For a complete<br />
description of the measurements, see the chapter on the voltmeter.<br />
Time<br />
Rise time left: the rise time of the signal at the position of the left cursor is determ<strong>in</strong>ed. The rise time is determ<strong>in</strong>ed<br />
by f<strong>in</strong>d<strong>in</strong>g the closest zero cross<strong>in</strong>g ((max + m<strong>in</strong>) / 2) relative to the cursor position. Next the 10% and 90% values are<br />
calculated. Now, the 10% and 90% po<strong>in</strong>ts are searched left and right of the zero cross<strong>in</strong>g po<strong>in</strong>t. By us<strong>in</strong>g the number<br />
of samples between the 10% and 90% po<strong>in</strong>ts, the rise time is calculated.<br />
Rise time right: the rise time at the position of the right cursor is determ<strong>in</strong>ed.<br />
Sample time left: us<strong>in</strong>g the left cursor position, the time on which the selected sample is taken will be displayed.<br />
Sample time right: us<strong>in</strong>g the right cursor position, the time on which the selected sample is taken will be displayed.<br />
Sample time difference: the difference between the right and the left cursor sample time is determ<strong>in</strong>ed.<br />
Cursor frequency: us<strong>in</strong>g the number of samples between the left and the right cursor, the frequency is calculated. The<br />
calculation is d<strong>one</strong> us<strong>in</strong>g the follow<strong>in</strong>g formula: (number of samples between cursors / total number of samples) *<br />
sample frequency. To determ<strong>in</strong>e a correct frequency always select <strong>one</strong> period or multiply the frequency by the number<br />
of selected periods for greater precision.<br />
Voltage<br />
Voltage left: the voltage of the left cursor will be displayed.<br />
Voltage right: the voltage of the right cursor will be displayed.<br />
Voltage difference: the difference between the voltage of the left and the voltage of the right cursor is calculated.<br />
Select<strong>in</strong>g the m<strong>in</strong> and max of the signal, the top-top value is calculated.<br />
Slew rate<br />
Slew rate left: the slew rate of the signal at the position of the left cursor is determ<strong>in</strong>ed. The slew rate is the voltage<br />
level which a signal drops or ga<strong>in</strong>s per millisecond.<br />
Slew rate right: the slew rate of the signal at the position of the right cursor is determ<strong>in</strong>ed.<br />
Phase difference<br />
These measurements are only available when both channels are switched on. They measure the phase angle difference<br />
between the signals on channel 1 and channel 2. When the software can not detect a complete period of the signal<br />
on both channels or when the frequency of the two signals are different, no phase difference is determ<strong>in</strong>ed.<br />
Degrees: The angle is presented <strong>in</strong> degrees<br />
Radials: The angle is presented <strong>in</strong> radials<br />
cos(): The cos<strong>in</strong>e value of the angle is presented<br />
Set impedance value<br />
The dBm and power measurements require a reference resistance. The value of the resistance can be set us<strong>in</strong>g this<br />
menu item. The value has to be entered <strong>in</strong> Ohm and is default 600.<br />
Automatic correct po<strong>in</strong>ts<br />
By select<strong>in</strong>g this option, the automatic correction of the cursors to the nearest zero cross<strong>in</strong>g is enabled or disabled.<br />
The right cursor is positi<strong>one</strong>d <strong>one</strong> or more periods from the left cursor. To determ<strong>in</strong>e a frequency or duty cycle, position<br />
the right cursor at the end of the second period or further for correct results.<br />
Automatic track<strong>in</strong>g cursors<br />
If this option is enabled, the voltage levels of the cursors are automatically set to the voltage levels of the sample<br />
numbers which correspond to the left and right cursor.<br />
Calculate values<br />
If this option is disabled, no new calculations will be d<strong>one</strong> until the option is enabled.<br />
Show measurement name<br />
The <strong>Oscilloscope</strong><br />
43
<strong>DI</strong>-<strong>770</strong> and WINDAQ/Scope Manual<br />
Show measured value<br />
Show measurement unit<br />
To reduce the space used by the w<strong>in</strong>dow on the screen, the measurement name, value and/or unit can be hidden. This<br />
results <strong>in</strong> the disappearance of the correspond<strong>in</strong>g column which results <strong>in</strong> a smaller w<strong>in</strong>dow.<br />
Display font<br />
By select<strong>in</strong>g this option, the font which is used to display the str<strong>in</strong>gs and values can be changed. The font sett<strong>in</strong>gs<br />
which can be changed are: font name, font style, font size and the font color.<br />
Background color<br />
By select<strong>in</strong>g this option, the background color can be altered. Some font colors (e.g. light green) are not show<strong>in</strong>g up<br />
very good on a white background. Change the background color to e.g. black for a better result.<br />
Select<strong>in</strong>g the active channel<br />
The cursors can only calculate values for <strong>one</strong> channel.<br />
The buttons <strong>in</strong> the left top of the w<strong>in</strong>dow caption bar can be used to select the channel from which data is used to calculate<br />
the selected measurements.<br />
There are two ways to change between channels, press<strong>in</strong>g the buttons with the mouse or by us<strong>in</strong>g the correspond<strong>in</strong>g<br />
number on the keyboard.<br />
Show<strong>in</strong>g or hid<strong>in</strong>g the cursor readout<br />
The left button of the two <strong>in</strong> the right top corner of the w<strong>in</strong>dow caption bar can be used to hide (<br />
) or show<br />
( ) the grid with measured data. When hid<strong>in</strong>g the data, the height of the w<strong>in</strong>dow equals the height of the w<strong>in</strong>dow<br />
caption bar.<br />
Switch<strong>in</strong>g off cursors<br />
To switch off cursors, enter the Cursors menu and select the No cursors item. The Cursors menu can be found <strong>in</strong> the<br />
ma<strong>in</strong> menu or can be called by click<strong>in</strong>g the right mouse button <strong>in</strong> the signal display.<br />
When the cursors are switched off, the cursor readout w<strong>in</strong>dow disappear as well.<br />
The cursors can also be switched off by click<strong>in</strong>g the close button (<br />
) <strong>in</strong> the cursor readout w<strong>in</strong>dow.<br />
The <strong>Oscilloscope</strong><br />
44
<strong>DI</strong>-<strong>770</strong> and WINDAQ/Scope Manual<br />
7. The Voltmeter<br />
If from the <strong>in</strong>put signals only the size is important and not the time <strong>in</strong>formation or frequency comp<strong>one</strong>nts, a voltmeter<br />
is a suitable <strong>in</strong>strument to measure with. The software is equipped with a two channel digital voltmeter. The voltmeter<br />
functions as follows:<br />
• A measurement is performed (m<strong>in</strong>imal 200 samples).<br />
• The measured data is processed, e.g. for calculat<strong>in</strong>g the RMS value or the mean value. Eleven different operations<br />
are available.<br />
• The calculated values are displayed, e.g. add CH1 and CH2 and display on channel <strong>one</strong>. Sixteen different display<br />
methods are available.<br />
For each channel the voltmeter has up to three displays to present the measured and calculated values. The value displayed<br />
<strong>in</strong> a display is fully configurable. Also for each display a bar graph is available, to give a quick overview of<br />
the signal size <strong>in</strong> relation to the <strong>in</strong>put range.<br />
Of all four <strong><strong>in</strong>struments</strong>, the voltmeter has the lowest sett<strong>in</strong>gs priority. This means that if for example the oscilloscope<br />
is active, the record length, pre samples and post samples of the oscilloscope are used <strong>in</strong> the voltmeter. The voltmeter<br />
only uses post samples to perform the calculations. If less than 200 post samples are available, no calculations are<br />
d<strong>one</strong> and a message is displayed. The only sett<strong>in</strong>g that can be changed by the voltmeter when the oscilloscope or<br />
spectrum analyzer is active, is the sample frequency.<br />
The measure system of the voltmeter<br />
The voltmeter takes 200 samples of the <strong>in</strong>put signal with a certa<strong>in</strong> sample frequency. These 200 samples are used to<br />
perform several calculations.<br />
The Voltmeter<br />
45
<strong>DI</strong>-<strong>770</strong> and WINDAQ/Scope Manual<br />
The voltmeter has a limited frequency range <strong>in</strong> which the measurements are performed correctly. If the periodical<br />
time of the <strong>in</strong>put signal is much larger than the measur<strong>in</strong>g time, a wrong value is measured. See the next illustration.<br />
If the time <strong>in</strong> which the 200 samples are taken is too long <strong>in</strong> relation to the periodical time of the <strong>in</strong>put signal, alias<strong>in</strong>g<br />
can occur (see also the chapter about the oscilloscope).<br />
Sett<strong>in</strong>g the frequency range<br />
To avoid errors like the <strong>one</strong>s menti<strong>one</strong>d above, the frequency range of the voltmeter has to be set properly. The sampl<strong>in</strong>g<br />
frequency is then changed. By activat<strong>in</strong>g the choice Frequency range from the Sett<strong>in</strong>gs menu, a popup menu<br />
appears, <strong>in</strong> which several frequencies are available. The frequencies <strong>in</strong>dicate the center frequency of a frequency<br />
range <strong>in</strong> which the voltmeter measures properly. The size of the frequency range is determ<strong>in</strong>ed from 0.2 x f center to 5<br />
x f center .<br />
When Auto freq. is chosen, the voltmeter determ<strong>in</strong>es the best frequency sett<strong>in</strong>g by itself. For each measurement the<br />
frequency has to be determ<strong>in</strong>ed, result<strong>in</strong>g <strong>in</strong> a longer time before updat<strong>in</strong>g the displays.<br />
Note: The Auto frequency sett<strong>in</strong>g overrides the sample frequency sett<strong>in</strong>g <strong>in</strong> the oscilloscope and the spectrum analyzer.<br />
This will result <strong>in</strong> a less usable display <strong>in</strong> those <strong><strong>in</strong>struments</strong>.<br />
To avoid this, the choice Scope freq. is available <strong>in</strong> the menu. The voltmeter will use the same sample frequency as<br />
the oscilloscope or spectrum analyzer.<br />
Display<strong>in</strong>g channels<br />
The voltmeter has several modes to display the two channels. To select the measure mode, enter the Sett<strong>in</strong>gs menu<br />
and select Channels. Use the Measure channel option to enable or disable measur<strong>in</strong>g from a channel. Measur<strong>in</strong>g takes<br />
place from at least <strong>one</strong> channel.<br />
When only <strong>one</strong> channel is measured, the controls of the other channel are disabled or removed from the display.<br />
Sett<strong>in</strong>g up a channel<br />
The channels of the voltmeter can be setup <strong>in</strong> several ways. Both channels have the same sett<strong>in</strong>gs, so only channel 1<br />
is discussed here.<br />
Sett<strong>in</strong>g the <strong>in</strong>put range<br />
In the voltmeter, the <strong>in</strong>put range or sensitivity can be set through the channels sett<strong>in</strong>gs dialog.<br />
The channels sett<strong>in</strong>g dialog is called by select<strong>in</strong>g the Channels option from the Sett<strong>in</strong>gs menu. In this dialog, the <strong>in</strong>put<br />
sensitivities are available, as well as an autorang<strong>in</strong>g sett<strong>in</strong>g.<br />
The Voltmeter<br />
46
<strong>DI</strong>-<strong>770</strong> and WINDAQ/Scope Manual<br />
To switch on Autorang<strong>in</strong>g for the Voltmeter, a special button is available. When auto rang<strong>in</strong>g is switched on, the button<br />
caption is Auto, otherwise it holds the current set <strong>in</strong>put sensitivity. Press<strong>in</strong>g the right mouse button on this button<br />
will br<strong>in</strong>g up a menu with all sensitivities.<br />
When the <strong>in</strong>put signal is larger than the selected <strong>in</strong>put range, '-------' is displayed.<br />
Note: When Autorang<strong>in</strong>g is switched on, several measurements might be needed to set the <strong>in</strong>put sensitivity properly,<br />
depend<strong>in</strong>g on the <strong>in</strong>put signal.<br />
Another way to set the sensitivity is by us<strong>in</strong>g the keyboard. A few keys have been reserved for sett<strong>in</strong>g the <strong>in</strong>put sensitivity<br />
of the channels. These keys are:<br />
<br />
<br />
<br />
<br />
Increase Ch1 sensitivity<br />
Decrease Ch1 sensitivity<br />
Increase Ch2 sensitivity<br />
Decrease Ch2 sensitivity<br />
Sett<strong>in</strong>g the <strong>in</strong>put coupl<strong>in</strong>g<br />
The <strong>in</strong>put signal can be coupled directly to the ADC (DC) or through a capacitor to the ADC (AC). In the hardware, a<br />
capacitor is switched <strong>in</strong>to (AC) or out of (DC) the signal path.<br />
In COUPLING DC the complete signal (AC+DC) at the <strong>in</strong>put is passed through. In COUPLING AC only the AC<br />
comp<strong>one</strong>nt of the <strong>in</strong>put signal is passed through. It is then possible to exam<strong>in</strong>e e.g. a ±20 mV ripple on a 30 V DC<br />
voltage, s<strong>in</strong>ce only the ripple is passed through and the DC voltage not. AC voltages with a frequency lower than ±4<br />
Hz are not coupled correctly.<br />
There are three different ways to set the coupl<strong>in</strong>g. Two ways are: by click<strong>in</strong>g the coupl<strong>in</strong>g button or by press<strong>in</strong>g keys.<br />
The third way is through the channel sett<strong>in</strong>gs dialog. The channels sett<strong>in</strong>g dialog is called by select<strong>in</strong>g the Channels<br />
option from the Sett<strong>in</strong>gs menu. In this dialog, the signal coupl<strong>in</strong>g sett<strong>in</strong>g is available.<br />
In the tool bar for each channel a coupl<strong>in</strong>g button is found, the coupl<strong>in</strong>g button for Ch1 at the left hand side of the<br />
screen, for Ch2 at the right hand side of the screen. The picture at the button <strong>in</strong>dicates the state of the coupl<strong>in</strong>g sett<strong>in</strong>g.<br />
The left button of the two buttons below is <strong>in</strong>dicat<strong>in</strong>g AC coupl<strong>in</strong>g, the right button is <strong>in</strong>dicat<strong>in</strong>g DC coupl<strong>in</strong>g.<br />
The current coupl<strong>in</strong>g state is displayed <strong>in</strong> the coupl<strong>in</strong>g button.<br />
The keys which can be used to change the signal coupl<strong>in</strong>g are:<br />
<br />
<br />
<br />
<br />
sets the coupl<strong>in</strong>g of channel 1 to AC<br />
sets the coupl<strong>in</strong>g of channel 1 to DC<br />
sets the coupl<strong>in</strong>g of channel 2 to AC<br />
sets the coupl<strong>in</strong>g of channel 2 to DC<br />
Sett<strong>in</strong>g a DC hardware offset<br />
The signal offset is adjustable <strong>in</strong> two ways: a hardware method and a (per display) software method.<br />
Us<strong>in</strong>g the hardware method, an adjustable DC voltage is added before sampl<strong>in</strong>g the <strong>in</strong>put signal. The hardware<br />
method can be realized by select<strong>in</strong>g the Channels option from the Sett<strong>in</strong>gs menu. Type the offset <strong>in</strong> the DC hardware<br />
offset edit box. This voltage will be added to the <strong>in</strong>put signal. If a voltage has to be subtracted, enter a negative value.<br />
The Voltmeter<br />
47
<strong>DI</strong>-<strong>770</strong> and WINDAQ/Scope Manual<br />
Configur<strong>in</strong>g the displays<br />
The voltmeter can display the measured values <strong>in</strong> several different ways, <strong>in</strong> up to six displays. Below the display, a<br />
bargraph is show<strong>in</strong>g the value <strong>in</strong> the display <strong>in</strong> a graphic format.<br />
By activat<strong>in</strong>g the choice Displays from the Sett<strong>in</strong>gs menu, a dialog appears <strong>in</strong> which the sett<strong>in</strong>gs of all the displays<br />
can be changed. This method works always, even if the display and bargraph for which the sett<strong>in</strong>gs are changed are<br />
<strong>in</strong>visible.<br />
These sett<strong>in</strong>gs can also be d<strong>one</strong> by plac<strong>in</strong>g the mouse cursor over a display and press<strong>in</strong>g the right mouse button. A<br />
popup menu appears with all sett<strong>in</strong>gs for that display. This method only works if the display or bargraph is visible.<br />
All sett<strong>in</strong>gs applied to a display are also applied to the correspond<strong>in</strong>g bargraph.<br />
The follow<strong>in</strong>g explanations expect that the Display sett<strong>in</strong>gs dialog is displayed and active.<br />
Switch<strong>in</strong>g displays on and off<br />
A display can be made visible by plac<strong>in</strong>g a checkmark <strong>in</strong> front of the Show display str<strong>in</strong>g. If a display is turned on,<br />
while the match<strong>in</strong>g channel is not measured, the display will not be showed.<br />
If all six displays are visible, the layout is as follow<strong>in</strong>g:<br />
- The left hand side displays belong to channel 1.<br />
- The right hand side displays belong to channel 2.<br />
Switch<strong>in</strong>g bargraphs on and off<br />
Each display has a bargraph that can be switched on or off <strong>in</strong>dependently from the displays. The bargraphs can be<br />
switched on or off by tagg<strong>in</strong>g or untagg<strong>in</strong>g the Show bargraph option.<br />
The Voltmeter<br />
48
<strong>DI</strong>-<strong>770</strong> and WINDAQ/Scope Manual<br />
Process<strong>in</strong>g the measured value<br />
The software can process the measured value <strong>in</strong> 11 different ways. By activat<strong>in</strong>g the Measurement selector, the follow<strong>in</strong>g<br />
calculations can be set:<br />
TRUE RMS:<br />
Peak-peak:<br />
Mean:<br />
Max:<br />
M<strong>in</strong>:<br />
dBm:<br />
Power:<br />
The true RMS value of the <strong>in</strong>put signal is calculated. The true RMS value (Root Mean Square)<br />
is the value of a random voltage, correspond<strong>in</strong>g to a DC voltage, dissipat<strong>in</strong>g the same power <strong>in</strong><br />
a resistance <strong>in</strong> the same amount of time. So an AC voltage of 1 volt RMS corresponds to a DC<br />
voltage of 1 volt. (Most -cheap- voltmeters only display, when measur<strong>in</strong>g AC voltage, the correct<br />
value when the <strong>in</strong>put signal is a true s<strong>in</strong>e wave and usually <strong>in</strong> a limited frequency range.<br />
This <strong>in</strong>strument always displays the correct value.)<br />
The peak-peak value of the <strong>in</strong>put signal is determ<strong>in</strong>ed. The peak-peak value of a DC voltage is<br />
zero. The peak-peak value of a true s<strong>in</strong>e wave with a RMS value of 1 volt is 2.828 volt.<br />
The mean value of the <strong>in</strong>put signal is determ<strong>in</strong>ed. The mean value of a vary<strong>in</strong>g voltage corresponds<br />
with the value of a DC voltage across the same load. The mean value of a 1 volt DC<br />
voltage is 1 volt. The mean value of a true s<strong>in</strong>e wave AC voltage is 0.<br />
The maximum of the <strong>in</strong>put signal is determ<strong>in</strong>ed. The maximum value of a 1 volt DC voltage is<br />
1 volt. The maximum value of a 1 volt AC s<strong>in</strong>e wave voltage is 1.414 volt. This is determ<strong>in</strong>ed<br />
from the 200 samples.<br />
The m<strong>in</strong>imum of the <strong>in</strong>put signal is determ<strong>in</strong>ed. The m<strong>in</strong>imum value of a 1 volt DC voltage is<br />
1 volt. The m<strong>in</strong>imum value of a 1 volt AC s<strong>in</strong>e wave is -1.414 volt. Determ<strong>in</strong>ed from the 200<br />
samples.<br />
The value of the <strong>in</strong>put signal is converted to dB. This is d<strong>one</strong> us<strong>in</strong>g the formula:<br />
dBm = 10 ×<br />
1000 × value 2<br />
log----------------------------------------------<br />
reference resistance<br />
'value' is the RMS value of the <strong>in</strong>put signal. The reference resistance can be set us<strong>in</strong>g the edit<br />
box set impedance value.<br />
The value of the <strong>in</strong>put signal is converted to a power, us<strong>in</strong>g the formula:<br />
POWER<br />
=<br />
value 2<br />
----------------------------------------------<br />
reference resistance<br />
'value' is the RMS value of the <strong>in</strong>put signal. The reference resistance can be set us<strong>in</strong>g the edit<br />
box Set impedance value.<br />
Crest:<br />
Frequency:<br />
Duty cycle:<br />
The value of the <strong>in</strong>put signal is converted to a crest factor, us<strong>in</strong>g the formula:<br />
CREST = ---------------------------------<br />
peak value<br />
RMS – Value<br />
'peak value' is the highest voltage of the <strong>in</strong>put signal with respect to the zero level.<br />
The frequency of the <strong>in</strong>put signal is determ<strong>in</strong>ed. Frequencies lower than 0.5 Hz, are displayed<br />
as 0 Hz. The frequency can be determ<strong>in</strong>ed for <strong>one</strong> channel at a time. If the frequency is determ<strong>in</strong>ed<br />
for channel 1, the frequency of channel 2 can't be determ<strong>in</strong>ed.<br />
The duty cycle of the <strong>in</strong>put signal is determ<strong>in</strong>ed. The duty cycle <strong>in</strong>dicates how much of a signal<br />
is low/high (depend<strong>in</strong>g on the duty cycle sett<strong>in</strong>g) <strong>in</strong> relation to the periodic time of the signal.<br />
The number is given <strong>in</strong> percent.<br />
The Voltmeter<br />
49
<strong>DI</strong>-<strong>770</strong> and WINDAQ/Scope Manual<br />
Moment. value:<br />
Displays the voltage level of the first post sample.<br />
Note: If a frequency or duty cycle measurement is set, the voltmeter is slower on all displays, because for determ<strong>in</strong>ation<br />
of the frequency or duty cycle more measurements have to be d<strong>one</strong>.<br />
Display<strong>in</strong>g the calculated value<br />
For display<strong>in</strong>g the measured and calculated values, 16 methods are available. Activate the Display measured value<br />
selector to set the follow<strong>in</strong>g possibilities:<br />
CH1:<br />
CH2:<br />
CH1*CH2:<br />
CH1/CH2:<br />
CH2/CH1:<br />
CH1-CH2:<br />
CH2-CH1:<br />
CH1+CH2:<br />
The measured value of Ch1 is displayed.<br />
The measured value of Ch2 is displayed.<br />
The values of Ch1 and Ch2 are multiplied and the result is displayed.<br />
The value of Ch1 is divided by the value of Ch2. The result is displayed.<br />
The value of Ch2 is divided by the value of Ch1. The result is displayed.<br />
The value of Ch2 is subtracted from the value of Ch1. The result is displayed.<br />
The value of Ch1 is subtracted from the value of Ch2. The result is displayed.<br />
The values of Ch1 and Ch2 are added and the sum is displayed.<br />
> than HI: The value is compared to the high value. If the value is higher than the high value, then PASS is<br />
displayed, else LO is displayed.<br />
< than LO: The value is compared to the low value. If the value is lower than the low value, then PASS is displayed,<br />
else HI is displayed.<br />
>< COMP: The value is compared to the high value and the low value. If the value is higher than the high<br />
value, HI is displayed. If the value is lower than the low value, LO is displayed. If the value is<br />
lower than or equal to the high value and higher than or equal to the low value, PASS is displayed.<br />
HI LO: The value is compared to the high value and the low value. If the measured value is higher than the<br />
high value, PASS is displayed. If the value is lower than the low value, PASS is displayed. If the<br />
value is lower than or equal to the high value and higher than or equal to the low value, FAIL is<br />
displayed.<br />
The Voltmeter<br />
50
<strong>DI</strong>-<strong>770</strong> and WINDAQ/Scope Manual<br />
MAX:<br />
MIN:<br />
The maximum measured value ever is displayed.<br />
The m<strong>in</strong>imum measured value ever is displayed.<br />
LOG(1/2):<br />
LOG(2/1):<br />
The result of the calculation<br />
is displayed.<br />
The result of the calculation<br />
is displayed.<br />
20 ×<br />
log<br />
measured<br />
------------------------------------------------<br />
valueCH1<br />
measured valueCH2<br />
20 × log<br />
measured<br />
------------------------------------------------<br />
valueCH2<br />
measured valueCH1<br />
Change the units of measure<br />
Normally, every type of measurement has its own unit. The voltmeter allows you to change this unit for each display<br />
separately. There are twelve predef<strong>in</strong>ed values and a user def<strong>in</strong>ed value.<br />
The selection can be made with the Units of measure pulldown. The unit which is selected, is displayed <strong>in</strong> the display.<br />
To select a user def<strong>in</strong>ed unit of measure, just type a str<strong>in</strong>g with a maximum length of <strong>five</strong> characters.<br />
Change the units per measurement unit<br />
Us<strong>in</strong>g the edit box Units per measurement unit, the number of units per selected unit can be set. In the edit box, the<br />
multiplication factor can be entered. The measured value is multiplied by the factor and displayed.<br />
This can be used if e.g. a 1:10 probe is used. To correct the read<strong>in</strong>g, enter a value 10 <strong>in</strong> the edit box.<br />
Relative measurements<br />
The voltmeter can take absolute measurements and relative measurements. When measur<strong>in</strong>g absolute, the measurements<br />
are related to the 0 level (ground). When measur<strong>in</strong>g relative, the measurements are related to a settable value.<br />
This value is subtracted from the measured value by the software. This means that before display<strong>in</strong>g the value <strong>in</strong> the<br />
display, the relative value is subtracted from the calculated value.<br />
The Voltmeter<br />
51
<strong>DI</strong>-<strong>770</strong> and WINDAQ/Scope Manual<br />
The value can be set by enter<strong>in</strong>g a value <strong>in</strong> the Set relative value edit box. The value has to be entered <strong>in</strong> volts.<br />
To enable relative measurements, a checkmark has to be placed after Relative measur<strong>in</strong>g. Relative measur<strong>in</strong>g is then<br />
enabled.<br />
Relative measurements can be used with e.g. a temperature measurement. Suppose the output voltage of a temperature<br />
probe at 0 degrees Celsius equals +10 volt. By enter<strong>in</strong>g a relative value of 10 volt, the absolute temperature is<br />
directly readable.<br />
Comparison measurements<br />
For display<strong>in</strong>g the measured and calculated values, 16 methods are available (See: display<strong>in</strong>g the measured value).<br />
Four of those methods are comparison measurements:<br />
> than HI<br />
< than LO<br />
>< COMP<br />
LO HI<br />
These measurements require a high and a low value. By enter<strong>in</strong>g a value <strong>in</strong> the Set high value or Set low value edit<br />
boxes, the high and low levels can be set.<br />
Note: For easy enter<strong>in</strong>g of low and high values, the software does not check whether the high value is larger than the<br />
low value. So it is possible to enter a low value which is larger than the high value. Measurements us<strong>in</strong>g these values<br />
will give useless results.<br />
Sett<strong>in</strong>g the reference impedance<br />
The dBm and power measurements require a reference resistance. The value of the resistance can be set us<strong>in</strong>g the Set<br />
impedance value edit box. The value has to be entered <strong>in</strong> Ohm. The default value is 600.<br />
Sett<strong>in</strong>g the number of digits after the decimal separator<br />
With every calculation d<strong>one</strong> on a measurement, a default number of digits after the separator is set (auto sett<strong>in</strong>g). This<br />
number corresponds with the significant number of figures determ<strong>in</strong>ed by the hardware. The number of digits after<br />
the separator can be changed us<strong>in</strong>g the Number precision selector.<br />
Note: The displays have a maximum number of 6 digits. When the value <strong>in</strong> the display is that large that digits before<br />
the decimal separator can't be displayed, an arrow po<strong>in</strong>t<strong>in</strong>g to the left is displayed left from the first digit. The displayed<br />
digits are correct though.<br />
Sound sett<strong>in</strong>gs<br />
With comparison measurements, for each value a sound signal can be set. When this is d<strong>one</strong>, the set limits are <strong>in</strong>dicated<br />
audibly.<br />
By activat<strong>in</strong>g the choice Sounds from the Sett<strong>in</strong>gs menu, a dialog appears from which for each display value a sound<br />
signal can be set. For each display value can be chosen from: No sound, 100 Hz, 200 Hz, 500 Hz, 1 kHz, 2 kHz, 5<br />
kHz and 10 kHz.<br />
With the choice No sound, no sound signal is generated with the selected display value.<br />
If you are us<strong>in</strong>g the PC speaker or a WAV device, it is only possible to make <strong>one</strong> sound at a time. This means that the<br />
sound which is played first, is repeated until the condition is <strong>in</strong>valid. As soon as the condition is <strong>in</strong>valid, the sound for<br />
the next condition can be played.<br />
Note: If your computer is equipped with a digital playback soundcard (a soundcard which can play WAV files), you<br />
can also play the sounds through your soundcard. Select the sound device pull down after which you can select wav<br />
device from the list. If this option is miss<strong>in</strong>g and you have a soundcard, you should <strong>in</strong>stall drivers for the soundcard<br />
or you don’t have a digital playback soundcard.<br />
The Voltmeter<br />
52
<strong>DI</strong>-<strong>770</strong> and WINDAQ/Scope Manual<br />
Note: If the computer is equipped with a soundcard, it is also possible to select the MI<strong>DI</strong> device option. The MI<strong>DI</strong><br />
device uses the <strong>in</strong>strument sett<strong>in</strong>gs as def<strong>in</strong>ed <strong>in</strong> the General MI<strong>DI</strong> standard. When us<strong>in</strong>g MI<strong>DI</strong>, it is possible to play<br />
all four sounds (LO, HI, FAIL and PASS) at <strong>one</strong> time.<br />
Resett<strong>in</strong>g the m<strong>in</strong>imum and maximum values<br />
When display<strong>in</strong>g the measured values, the maximum value ever and/or the m<strong>in</strong>imum value ever can be displayed.<br />
These values are kept until the software is closed.<br />
To reset the m<strong>in</strong>imum and maximum values, for each channel a reset button is available <strong>in</strong> the speedbar (<br />
) and<br />
through the sett<strong>in</strong>gs, channel menu. By press<strong>in</strong>g this button, the maximum value is set to the lowest possible measured<br />
value. The m<strong>in</strong>imum value is set to the maximum measured value possible.<br />
Perform<strong>in</strong>g measurements<br />
H<strong>in</strong>t: Use the frequency meter to determ<strong>in</strong>e the frequency of the <strong>in</strong>put signal.<br />
When the device voltmeter is switched on, and the measurement process is not <strong>in</strong> <strong>one</strong> shot mode, measurements take<br />
place. The measured values are displayed cont<strong>in</strong>uously. If the oscilloscope is active, the trigger conditions also apply<br />
to the voltmeter.<br />
Start and stop measur<strong>in</strong>g<br />
The measur<strong>in</strong>g can be halted by press<strong>in</strong>g the pause button ( ) or key. The <strong>one</strong>shot button ( ) next to the<br />
pause button becomes available ( key), and the pause button changes to a play button ( ).<br />
The measur<strong>in</strong>g can also be halted by select<strong>in</strong>g the Stop cont<strong>in</strong>uous measur<strong>in</strong>g option from the Measure menu. The<br />
option Perform a s<strong>in</strong>gle measurement becomes available and the Stop cont<strong>in</strong>uous measur<strong>in</strong>g option changes to Start<br />
cont<strong>in</strong>uous measur<strong>in</strong>g.<br />
Averag<strong>in</strong>g<br />
Normally the voltmeter adds the two previous measured values with the current measured value and divides it by<br />
three. In this way, very small changes do not show up which results <strong>in</strong> a more stable values.<br />
To switch averag<strong>in</strong>g on or off, enter the Sett<strong>in</strong>gs menu and select the Mean values option. The check mark <strong>in</strong> front of<br />
the menu item <strong>in</strong>dicates whether averag<strong>in</strong>g is on or off.<br />
Fast measur<strong>in</strong>g<br />
By select<strong>in</strong>g the option Fast measur<strong>in</strong>g from the Sett<strong>in</strong>gs menu, fast measur<strong>in</strong>g is enabled or disabled. Before the fast<br />
measur<strong>in</strong>g option can be enabled, you have to set a frequency range other than scope or auto.<br />
When enabl<strong>in</strong>g the fast measur<strong>in</strong>g option, the trigger timeout is set to zero, the record length and post samples are set<br />
to 200 and the averag<strong>in</strong>g is disabled.<br />
One shot measurements<br />
A s<strong>in</strong>gle measurement can be performed by press<strong>in</strong>g the <strong>one</strong>shot button or by select<strong>in</strong>g the Perform s<strong>in</strong>gle measurement<br />
option from the measure menu.<br />
Note: One measurement consists of three successive measurements (except if fast measur<strong>in</strong>g is selected or mean values<br />
is disabled, these take <strong>one</strong> measurement), from which the measured values are averaged. Between the measurements<br />
the display is updated. If the voltmeter has to perform an autorang<strong>in</strong>g action or has to change the sample<br />
frequency dur<strong>in</strong>g an <strong>one</strong>shot, measurements are taken until all changes to the range and the frequency have been<br />
d<strong>one</strong>. Then three measurements are taken with the f<strong>in</strong>al sett<strong>in</strong>gs.<br />
The Voltmeter<br />
53
<strong>DI</strong>-<strong>770</strong> and WINDAQ/Scope Manual<br />
Cont<strong>in</strong>uous measur<strong>in</strong>g can be switched on by activat<strong>in</strong>g the play button or press<strong>in</strong>g the key.<br />
Stor<strong>in</strong>g measurement values on disk or paper<br />
The voltmeter can store measurements on disk or pr<strong>in</strong>t them. This is d<strong>one</strong> <strong>in</strong> a completely different way than the other<br />
<strong><strong>in</strong>struments</strong>.<br />
The voltmeter can be set to measure (acquire) at fixed times. The measured value will then be stored on disk or sent<br />
to the pr<strong>in</strong>ter.<br />
The time at which measurements are taken is not 100% guaranteed. The reason for this is the W<strong>in</strong>dows environment<br />
which is not a real-time multitask<strong>in</strong>g system. Because of this there is no guarantee that the time between two measurements<br />
is the set <strong>in</strong>terval. If this occurs, close all w<strong>in</strong>dows programs except the voltmeter and then try aga<strong>in</strong>.<br />
Sett<strong>in</strong>g the time between two measurements<br />
By activat<strong>in</strong>g the choice Time from the Acquisition menu, the time between two measurements can be set. A dialog<br />
box appears <strong>in</strong> which the time <strong>in</strong> seconds can be entered.<br />
Note: When a time shorter than 0.5 seconds is entered, the acquisition speed is determ<strong>in</strong>ed by the changes of the displays.<br />
Sett<strong>in</strong>g the hysteresis<br />
With an acquisition time smaller than 0.5 seconds, the acquisition speed is determ<strong>in</strong>ed by the changes <strong>in</strong> the displays.<br />
It can occur that the <strong>in</strong>put signal has a value just between two displayable values. In that case the display will constantly<br />
change between the two values. To avoid a constant storage to disk or pr<strong>in</strong>ter <strong>in</strong> that case, a hysteresis can be<br />
set. Only when the <strong>in</strong>put value change exceeds the hysteresis value, the <strong>in</strong>put value will be stored.<br />
By activat<strong>in</strong>g the item Hysteresis from the Acquisition menu, a dialog appears <strong>in</strong> which the hysteresis can be entered.<br />
The hysteresis is entered as a percentage of the last measured value. With each new measurement, the size of the hysteresis<br />
<strong>in</strong> volts is recalculated.<br />
The hysteresis can only be set with an acquisition time smaller than 0.5 seconds.<br />
Start an acquisition<br />
By activat<strong>in</strong>g the choice Write data from the Acquire menu, a menu is shown with which a selection can be made to<br />
write to disk or pr<strong>in</strong>ter.<br />
The choice Disk will cause the measurement data to be stored on disk. After activat<strong>in</strong>g the choice, a save dialog<br />
appears <strong>in</strong> which the drive, directory and name of the file can be typed. If the typed file already exists, an overwrite<br />
prompt will appear. The measur<strong>in</strong>g will start after this. At fixed times a measurement is taken and stored on disk.<br />
Measur<strong>in</strong>g can be aborted by press<strong>in</strong>g the cancel button.<br />
The choice Pr<strong>in</strong>ter will cause the measurement data to be written to the pr<strong>in</strong>ter. After activat<strong>in</strong>g the choice, a pr<strong>in</strong>t dialog<br />
appears from which a pr<strong>in</strong>ter can be selected. A dialog will appear <strong>in</strong> which the title of the job can be typed. Now<br />
measur<strong>in</strong>g starts. At fixed times a measurement is taken and sent to the pr<strong>in</strong>ter. Measur<strong>in</strong>g can be aborted by press<strong>in</strong>g<br />
the Cancel button.<br />
The pr<strong>in</strong>t<strong>in</strong>g and writ<strong>in</strong>g can also be activated by press<strong>in</strong>g the follow<strong>in</strong>g buttons on the speedbar:<br />
In both modes, the measurement values are preceded by a block of <strong>in</strong>formation. In that block is <strong>in</strong>dicated how the<br />
channels are set and how the high, low and relative levels are set. Each measurement is preceded by the time and date<br />
of the measurement.<br />
If a measured value is larger than the selected <strong>in</strong>put range, '-------' is displayed. This will also be stored on disk or sent<br />
to the pr<strong>in</strong>ter. The date/time format can be set through the program sett<strong>in</strong>gs dialog.<br />
The Voltmeter<br />
54
<strong>DI</strong>-<strong>770</strong> and WINDAQ/Scope Manual<br />
8. The Data Logger<br />
For measur<strong>in</strong>g slowly chang<strong>in</strong>g signals (e.g. the temperature change <strong>in</strong> a room) the data logger is the most suitable<br />
<strong>in</strong>strument.<br />
The data logger is a two channel, direct register<strong>in</strong>g measur<strong>in</strong>g <strong>in</strong>strument, display<strong>in</strong>g the changes of the <strong>in</strong>put signal<br />
graphically on the screen or on paper.<br />
The data logger measures at settable, fixed times and processes the measured value if necessary. The number of measurements<br />
to be taken is also settable.<br />
Note: The data logger displays each measured sample immediately, the oscilloscope first takes all samples and then<br />
displays the complete record.<br />
The data logger measures the <strong>in</strong>put signals at adjustable times. The time between two measurements is adjustable<br />
from 0.01 second to 500 seconds. The number of samples is also adjustable from 1 to 32760. The maximum measur<strong>in</strong>g<br />
time is 500 sec x 32760 samples = 16380000 seconds (189.6 days).<br />
Note: Due to the different way of measur<strong>in</strong>g the <strong>in</strong>put signals, the data logger can not be used together with the<br />
oscilloscope, voltmeter or spectrum analyzer.<br />
The data logger measur<strong>in</strong>g system<br />
Before measur<strong>in</strong>g with the data logger, the channels and the time base have to be set up completely.<br />
When all sett<strong>in</strong>gs (<strong>in</strong>put sensitivity, coupl<strong>in</strong>g, number of samples, sample speed etc.) are made, the data logger can be<br />
started. All sett<strong>in</strong>gs will be applied to the hardware and the hardware beg<strong>in</strong>s to measure. The hardware will cont<strong>in</strong>ue<br />
measur<strong>in</strong>g until the predef<strong>in</strong>ed number of samples is measured or when the user <strong>in</strong>terrupts the measurement. Each<br />
measured sample will be stored <strong>in</strong> the board memory of the hardware.<br />
The Data Logger<br />
55
<strong>DI</strong>-<strong>770</strong> and WINDAQ/Scope Manual<br />
When the measurement is runn<strong>in</strong>g, the software will constantly monitor whether a new sample is measured. If a new<br />
sample is measured, it is obta<strong>in</strong>ed from the hardware acquisition memory and displayed on the display. This will cont<strong>in</strong>ue<br />
until the measurement is ready.<br />
Note: At certa<strong>in</strong> sample speeds and/or relatively slow computers, it might occur that the software can't keep up with<br />
the hardware, <strong>in</strong> other words, the software misses samples the hardware has measured and stored. This is only a<br />
m<strong>in</strong>or problem. The software detects that it has missed samples and will warn the user by light<strong>in</strong>g up a red LED <strong>in</strong> the<br />
display and display<strong>in</strong>g a warn<strong>in</strong>g message <strong>in</strong> the h<strong>in</strong>t bar.<br />
Note: The missed sample <strong>in</strong> the record is filled with the value of the previous sample.<br />
Note: Try<strong>in</strong>g to reload the missed sample(s) would take so much time, that aga<strong>in</strong> samples would be missed.<br />
When the total measurement is ready, the software will reload the complete measured record from the hardware<br />
acquisition memory and display it.<br />
H<strong>in</strong>t: There are a few th<strong>in</strong>gs to make the software keep up with the hardware longer:<br />
- make the data logger w<strong>in</strong>dow as small as possible<br />
- Select Scan mode <strong>in</strong>stead of Roll mode<br />
- Do not show references while measur<strong>in</strong>g<br />
- close all other applications (especially applications <strong>in</strong> DOS w<strong>in</strong>dows)<br />
- Set the W<strong>in</strong>dows video driver to display up to 256 colors <strong>in</strong>stead of True color or High color<br />
Display<strong>in</strong>g channels<br />
The two channels can be measured <strong>in</strong> several different ways:<br />
Ch1<br />
Ch2<br />
Ch1 and Ch2<br />
only channel 1 is measured and displayed<br />
only channel 2 is measured and displayed<br />
channel 1 and channel 2 are measured and displayed simultaneously<br />
Select<strong>in</strong>g which way to measure the channels can be d<strong>one</strong> us<strong>in</strong>g the Measure menu.<br />
When only <strong>one</strong> channel is measured, the controls of the other channel are disabled or removed from the display.<br />
Sett<strong>in</strong>g up a channel<br />
Sett<strong>in</strong>g up a channel <strong>in</strong> the data logger is d<strong>one</strong> <strong>in</strong> the same way as <strong>in</strong> the oscilloscope. The only difference is that <strong>in</strong><br />
the data logger no auto rang<strong>in</strong>g for the <strong>in</strong>put sensitivity is available.<br />
For <strong>in</strong>formation on sett<strong>in</strong>g up a channel, see chapter 2, the oscilloscope.<br />
Sett<strong>in</strong>g up the time axis<br />
The time base <strong>in</strong> the data logger is almost the same as <strong>in</strong> the oscilloscope. However, the data logger has no pre trigger<br />
sett<strong>in</strong>g.<br />
Therefor only the items that differ from the oscilloscope time base sett<strong>in</strong>gs are discussed here.<br />
Sett<strong>in</strong>g up the sample speed<br />
The data logger measures a number of samples with a certa<strong>in</strong> time between two samples. This results <strong>in</strong> a total measure<br />
time of (number of samples x time between two samples).<br />
To setup the tim<strong>in</strong>g characteristics of the data logger measurement, open the data logger measurement speed dialog.<br />
The dialog can be opened by activat<strong>in</strong>g the choice Sampl<strong>in</strong>g speed... from the Time base menu.<br />
In the upper part of the dialog a selection has to be made how the tim<strong>in</strong>g characteristics of the data logger measurement<br />
have to be set. There are three possible ways:<br />
The Data Logger<br />
56
<strong>DI</strong>-<strong>770</strong> and WINDAQ/Scope Manual<br />
• Enter the number of samples and the time between to measurements. The total measur<strong>in</strong>g time is determ<strong>in</strong>ed by<br />
the dialog.<br />
• Enter the number of samples and the total measur<strong>in</strong>g time. The time between two samples is determ<strong>in</strong>ed by the<br />
dialog.<br />
• Enter the time between two samples and the total measur<strong>in</strong>g time. The number of samples is determ<strong>in</strong>ed by the<br />
dialog.<br />
When a selection is made, the selected items can be entered <strong>in</strong> the <strong>in</strong>put boxes <strong>in</strong> the lower part of the dialog. Under<br />
the <strong>in</strong>put boxes, the determ<strong>in</strong>ed value of the third parameter is displayed. When an <strong>in</strong>valid comb<strong>in</strong>ation is made, the<br />
text <strong>in</strong> the <strong>in</strong>put box that causes the <strong>in</strong>valid comb<strong>in</strong>ation turns <strong>in</strong>to red. When this is ignored, the value is clipped to<br />
the nearest valid value.<br />
When the parameters are set properly the OK button can be clicked to apply the values and return to the data logger.<br />
Note: The tim<strong>in</strong>g <strong>in</strong> the hardware is generated by a crystal oscillator and two programmable <strong>in</strong>teger dividers. This<br />
system can't generate all frequencies, but comes close. When the OK button is clicked, the software will determ<strong>in</strong>e the<br />
division values for both dividers, <strong>in</strong> such a way that the generated frequency approaches the requested frequency as<br />
close as possible. A lot of divider comb<strong>in</strong>ations have to be checked for that. While determ<strong>in</strong><strong>in</strong>g the correct division<br />
factors, an hour glass is displayed<br />
Sett<strong>in</strong>g the record length<br />
The data logger takes a number of samples to display the <strong>in</strong>put signal. This number of samples is called the Record<br />
length. To change the record length, three ways are available: us<strong>in</strong>g the record length menu, us<strong>in</strong>g the sample speed<br />
dialog or by means of function keys.<br />
To change the record length us<strong>in</strong>g the menu, enter the Time base menu and select the Record length item. Another<br />
menu will pop up, conta<strong>in</strong><strong>in</strong>g the available record lengths and an item for a user def<strong>in</strong>ed record length. Select<strong>in</strong>g this<br />
item will br<strong>in</strong>g up a dialog box <strong>in</strong> which a self def<strong>in</strong>ed record length (with<strong>in</strong> the <strong>in</strong>strument hardware limits) can be<br />
entered. The Time base menu can also be entered by press<strong>in</strong>g the right mouse button over <strong>one</strong> of the time base controls<br />
or read outs.<br />
For chang<strong>in</strong>g the record length the follow<strong>in</strong>g function keys are available:<br />
<br />
<br />
Select a shorter record length<br />
Select a longer record length<br />
For the third way to change the record length, see sett<strong>in</strong>g up the sampl<strong>in</strong>g speed.<br />
Sett<strong>in</strong>g the horizontal axis type<br />
The data logger can measure for a very long time. In that case it can be useful to have real time and date values along<br />
the time axis <strong>in</strong>stead of the number of seconds s<strong>in</strong>ce the start<strong>in</strong>g moment.<br />
This can be selected by open<strong>in</strong>g the Sett<strong>in</strong>gs menu and select the Horizontal axis type item. Now you can select<br />
between Date / Time and Sample times.<br />
Perform measurements<br />
Before measur<strong>in</strong>g with the data logger, the channels and the time base have to be set up completely.<br />
The channels do not have auto rang<strong>in</strong>g, so the sensitivity has to be set manually. S<strong>in</strong>ce the data logger usually measures<br />
slow signals, the <strong>in</strong>put coupl<strong>in</strong>g should be set to DC, otherwise the <strong>in</strong>put capacitor will block the signal.<br />
Start measur<strong>in</strong>g<br />
When all sett<strong>in</strong>gs are made, the data logger can be started. This can be d<strong>one</strong> <strong>in</strong> three ways:<br />
The Data Logger<br />
57
<strong>DI</strong>-<strong>770</strong> and WINDAQ/Scope Manual<br />
• Click<strong>in</strong>g the Play button ( ).<br />
• Press<strong>in</strong>g the key<br />
• Enter the Measure menu and select the Start measur<strong>in</strong>g item<br />
When the measurement is started, all controls except the Stop controls are disabled.<br />
Stop measur<strong>in</strong>g<br />
When the predef<strong>in</strong>ed number of samples is reached, the data logger will stop measur<strong>in</strong>g. It is also possible to stop the<br />
data logger manually, e.g. when the event to measure is measured, or the <strong>in</strong>strument sett<strong>in</strong>gs are wrong (coupl<strong>in</strong>g,<br />
sensitivity etc.). This can be d<strong>one</strong> <strong>in</strong> three ways:<br />
• Click<strong>in</strong>g the Stop button ( )<br />
• Press<strong>in</strong>g the key<br />
• Enter the Measure menu and select the Stop measur<strong>in</strong>g item<br />
When the measurement is stopped, all controls are enabled aga<strong>in</strong>.<br />
Scroll mode<br />
While measur<strong>in</strong>g, the data logger displays the measured signal on a 1:1 base, mean<strong>in</strong>g that for each sample 1 display<br />
pixel is used. When the number of measured samples is larger than the available number of pixels <strong>in</strong> the display, the<br />
record view offset has to be changed <strong>in</strong> such a way that the latest samples will be visible.<br />
There are two ways to do this:<br />
Scan mode: When the display is full, the record view offset will change a full screen, so the new samples will start<br />
fill<strong>in</strong>g the display from the left hand side of the display aga<strong>in</strong>.<br />
Roll mode: When the display is full, the record view offset will change with <strong>one</strong> sample, mak<strong>in</strong>g space for <strong>one</strong> new<br />
sample. Each new sample causes a change <strong>in</strong> the record view offset.<br />
Roll mode looks nicer than Scan mode, but is also slower, so the data logger will so<strong>one</strong>r miss samples <strong>in</strong> Roll mode<br />
than <strong>in</strong> Scan mode.<br />
To set the scroll mode, enter the Measure menu, select the item Scroll mode and choose between the two possibilities.<br />
Compar<strong>in</strong>g signals us<strong>in</strong>g the reference channels<br />
To make the data logger keep up with the measur<strong>in</strong>g hardware longer, references can be switched off while measur<strong>in</strong>g.<br />
To do this, open the References menu and select the Show references while measur<strong>in</strong>g item.<br />
When the item Show references while measur<strong>in</strong>g is checked, switched on references are shown while the data logger<br />
measures. If the item is not checked, the references are switched off when the measurement is started and switched on<br />
aga<strong>in</strong> when the data logger is ready.<br />
Perform<strong>in</strong>g cursor measurements<br />
Like <strong>in</strong> the oscilloscope, the data logger has a set of cursors to perform measurements on the displayed signals.<br />
The cursors <strong>in</strong> the data logger work exactly like the oscilloscope, so refer to chapter 2, the oscilloscope, for an explanation<br />
on how to work with the cursors.<br />
The Data Logger<br />
58
<strong>DI</strong>-<strong>770</strong> and WINDAQ/Scope Manual<br />
9. The Spectrum Analyzer<br />
The common way to exam<strong>in</strong>e electrical signals is <strong>in</strong> the time doma<strong>in</strong>, us<strong>in</strong>g an oscilloscope. The time doma<strong>in</strong> is used<br />
to determ<strong>in</strong>e amplitude, time and phase <strong>in</strong>formation, which is necessary to describe the behavior of an electrical system.<br />
Not all electrical systems can be characterized <strong>in</strong> the time doma<strong>in</strong>. Circuits like filters, amplifiers, oscillators, mixers,<br />
modulators and detectors can be characterized best by their frequency behavior. That frequency behavior is best<br />
obta<strong>in</strong>ed by observ<strong>in</strong>g the electrical signals <strong>in</strong> the frequency doma<strong>in</strong>. To display the frequency doma<strong>in</strong>, an <strong>in</strong>strument<br />
is needed that can dist<strong>in</strong>guish different frequencies from each other and measure the signal size at the different frequencies.<br />
An <strong>in</strong>strument that can display the frequency doma<strong>in</strong> is the spectrum analyzer. It graphically displays voltage<br />
as a function of frequency.<br />
In the time doma<strong>in</strong> all frequency comp<strong>one</strong>nts of a signal are seen summed together. In the frequency doma<strong>in</strong>, complex<br />
signals (signals composed of more than <strong>one</strong> frequency) are separated <strong>in</strong>to their frequency comp<strong>one</strong>nts, where the<br />
voltage of each comp<strong>one</strong>nt is displayed.<br />
The frequency doma<strong>in</strong> conta<strong>in</strong>s <strong>in</strong>formation which is not available <strong>in</strong> the time doma<strong>in</strong>. Therefore the spectrum analyzer<br />
has certa<strong>in</strong> advantages compared with an oscilloscope.<br />
• With a spectrum analyzer small harmonic distortions on a signal can be displayed better than on an oscilloscope.<br />
A s<strong>in</strong>e wave may look good <strong>in</strong> the time doma<strong>in</strong>, however <strong>in</strong> the frequency doma<strong>in</strong> the harmonic distortion is visible.<br />
• A noise signal may look fully random <strong>in</strong> the time doma<strong>in</strong>, <strong>in</strong> the frequency doma<strong>in</strong> it can appear that <strong>one</strong> frequency<br />
is dom<strong>in</strong>antly present.<br />
The Spectrum Analyzer<br />
59
<strong>DI</strong>-<strong>770</strong> and WINDAQ/Scope Manual<br />
• In the frequency doma<strong>in</strong> it is very simple to determ<strong>in</strong>e carrier frequency, modulation frequency, modulation level<br />
and modulation distortion from a modulated signal (AM or FM).<br />
Description of FFT<br />
The spectrum analyzer is us<strong>in</strong>g the Fast Fourier Transform (FFT) pr<strong>in</strong>ciple. For this transform, a number of samples<br />
are taken with a previously set sample speed. The number of samples has to be a power of 2, e.g. 512, 1024 or 2048.<br />
With these samples, here called FFT-block, the spectrum is calculated. Therefore the FFT places an <strong>in</strong>f<strong>in</strong>ite number of<br />
FFT-blocks beh<strong>in</strong>d each other, <strong>in</strong> the positive and negative direction. Each FFT-block forms 1 period of the created<br />
periodic signal.<br />
From the signal obta<strong>in</strong>ed like this, the spectrum is calculated. The FFT calculation results <strong>in</strong> a number of spectral<br />
comp<strong>one</strong>nts which is half the number of samples <strong>in</strong> the FFT block (e.g. 256, 512, 1024). These spectral comp<strong>one</strong>nts<br />
together form the frequency spectrum of the <strong>in</strong>put signal.<br />
The spectrum analyzer displays an amplitude spectrum, which means that a 2 volt peak-peak s<strong>in</strong>e wave is displayed<br />
with a 1 volt spectral comp<strong>one</strong>nt.<br />
Alias<strong>in</strong>g<br />
Like the oscilloscope, the spectrum analyzer needs a high enough sampl<strong>in</strong>g frequency to avoid alias<strong>in</strong>g. The result of<br />
alias<strong>in</strong>g when us<strong>in</strong>g FFT is that the frequency curve is folded back on itself.<br />
The Spectrum Analyzer<br />
60
<strong>DI</strong>-<strong>770</strong> and WINDAQ/Scope Manual<br />
The orig<strong>in</strong>al signal is sampled at a sample time t. The critical frequency (Nyquist frequency) is (1/2t) Hz.<br />
W<strong>in</strong>dow<strong>in</strong>g<br />
FFT treats the FFT-block like it is <strong>one</strong> period of a periodic signal. If the sampled signal is not periodic, harmonic distortion<br />
can arise, s<strong>in</strong>ce the periodic waveform, 'created by the FFT', can have sharp discont<strong>in</strong>uities. See also the follow<strong>in</strong>g<br />
illustration. These discont<strong>in</strong>uities are also called calculation errors.<br />
This means that because of the calculation errors extra frequency comp<strong>one</strong>nts are generated around the true frequency.<br />
Because of this 'smear<strong>in</strong>g' the amplitude of the true frequency decreases, s<strong>in</strong>ce the area under the curve<br />
rema<strong>in</strong>s the same.<br />
The smear<strong>in</strong>g, caused by the calculation errors, can be decreased by plac<strong>in</strong>g a w<strong>in</strong>dow on the FFT-block samples, <strong>in</strong><br />
such a way that the ends of the FFT-block are smoothly tapered to zero and discont<strong>in</strong>uities do not occur when the FFT<br />
treats the w<strong>in</strong>dowed block as <strong>one</strong> period of a periodic signal. Each sample of the FFT-block is therefore multiplied by<br />
a factor, whose size is dependent on the position of the sample <strong>in</strong> the FFT-block.<br />
The software supports six different w<strong>in</strong>dows:<br />
rectangular (all data is not changed)<br />
Hann<strong>in</strong>g (s<strong>in</strong>usoidal)<br />
Hamm<strong>in</strong>g (s<strong>in</strong>usoidal)<br />
Bartlett (s<strong>in</strong>usoidal)<br />
Blackman (triangular)<br />
Parzen (triangular)<br />
Display<strong>in</strong>g channels<br />
The spectrum analyzer has several modes to display the two channels. To select the measure mode, enter the Measure<br />
menu and select:<br />
Ch1 measure and display only channel 1<br />
Ch2 measure and display only channel 2<br />
Ch1 and Ch2<br />
measure channel 1 and channel 2 simultaneously and display the values of both channels<br />
When only <strong>one</strong> channel is measured, the controls of the other channel are disabled or removed from the display.<br />
The Spectrum Analyzer<br />
61
<strong>DI</strong>-<strong>770</strong> and WINDAQ/Scope Manual<br />
Sett<strong>in</strong>g up a channel<br />
The two channels of the spectrum analyzer are completely configurable. Both channels are identical, each has its own<br />
menu item <strong>in</strong> the ma<strong>in</strong> menu. The possibilities of the vertical axes <strong>in</strong> the spectrum analyzer are the same as <strong>in</strong> the<br />
oscilloscope, so only the differences are discussed here. S<strong>in</strong>ce the possibilities for both channels are equal, channel 1<br />
is expla<strong>in</strong>ed here.<br />
Sett<strong>in</strong>g the <strong>in</strong>put sensitivity<br />
The <strong>in</strong>put sensitivity of a channel determ<strong>in</strong>es how large a certa<strong>in</strong> signal will be displayed, the lower the full scale<br />
value, the larger the signal will be displayed. It is possible to enable an autorang<strong>in</strong>g function.<br />
Note: The vertical axis <strong>in</strong> the spectrum analyzer has a range that is twice the <strong>in</strong>put sensitivity. This is d<strong>one</strong> because<br />
the frequency comp<strong>one</strong>nts of which a signal is built, can have a larger amplitude than the <strong>in</strong>put sensitivity. So if an<br />
<strong>in</strong>put sensitivity of 8 Volt full scale is selected, the axis will have values from 0 to 16 Volt full scale.<br />
The sensitivity can be set through the Sensitivity menu. The Sensitivity menu is called by enabl<strong>in</strong>g the Ch1 menu and<br />
then select<strong>in</strong>g the Sensitivity menu. In this menu the <strong>in</strong>put sensitivities are available. In the spectrum analyzer also an<br />
Autorang<strong>in</strong>g sett<strong>in</strong>g is available. The Sensitivity menu can also be entered by click<strong>in</strong>g the right mouse button over<br />
<strong>one</strong> of the Ch1 or Ch2 controls and readouts.<br />
To switch on Autorang<strong>in</strong>g, a special button is available. When autorang<strong>in</strong>g is switched on, the button caption is Auto,<br />
otherwise it holds the current set <strong>in</strong>put sensitivity. Press<strong>in</strong>g the right mouse button on this button will br<strong>in</strong>g up a menu<br />
with all sensitivities.<br />
Note: When Autorang<strong>in</strong>g is switched on, several measurements might be needed to set the <strong>in</strong>put sensitivity properly,<br />
depend<strong>in</strong>g on the <strong>in</strong>put signal.<br />
Another way to set the sensitivity is by us<strong>in</strong>g the keyboard. A few keys have been reserved for sett<strong>in</strong>g the <strong>in</strong>put sensitivity<br />
of the channels. These keys are:<br />
<br />
<br />
<br />
<br />
Increase Ch1 sensitivity<br />
Decrease Ch1 sensitivity<br />
Increase Ch2 sensitivity<br />
Decrease Ch2 sensitivity<br />
Logarithmic or l<strong>in</strong>ear vertical axis<br />
The vertical axis of the spectrum analyzer can be set to l<strong>in</strong>ear or to logarithmic.<br />
When set to l<strong>in</strong>ear, the normal axis is used, runn<strong>in</strong>g from 0 to 2 x Sensitivity. When set to logarithmic, the position on<br />
the l<strong>in</strong>ear axis that is mark-ed Sensitivity will get the value<br />
Value = 20 x 10 log Sensitivity<br />
The rest of the labels will get a value that is related to this value and differ from it with 10 dB per division (when Software<br />
ga<strong>in</strong> is set to 1). The measured data will be transformed to logarithmic data as well.<br />
Select<strong>in</strong>g the axis type can be d<strong>one</strong> by enter<strong>in</strong>g the Ch1 menu, choos<strong>in</strong>g the Axis type menu and select<strong>in</strong>g the axis<br />
type.<br />
The axis type can also be set by the keyboard us<strong>in</strong>g the follow<strong>in</strong>g keys:<br />
<br />
<br />
toggle the Ch1 axis between L<strong>in</strong>ear and Logarithmic<br />
toggle the Ch2 axis between L<strong>in</strong>ear and Logarithmic<br />
The Spectrum Analyzer<br />
62
<strong>DI</strong>-<strong>770</strong> and WINDAQ/Scope Manual<br />
Note: Due to 'smear<strong>in</strong>g' errors, caused by discont<strong>in</strong>uities (See W<strong>in</strong>dow<strong>in</strong>g) and (with<strong>in</strong> specifications) distortion <strong>in</strong><br />
the Analog to Digital Converter non-exist<strong>in</strong>g frequency comp<strong>one</strong>nts will show up when a logarithmic axis is selected.<br />
These comp<strong>one</strong>nts are all outside the dynamic range of the measurement system.<br />
To avoid confusion with these non-exist<strong>in</strong>g frequency comp<strong>one</strong>nts, the logarithmic graph can be clipped on the theoretical<br />
dynamic range of the measurement system. This is d<strong>one</strong> by select<strong>in</strong>g the Vertical log axis range item from the<br />
Sett<strong>in</strong>gs menu and choos<strong>in</strong>g either Not clipped or Clipped conform hardware specs.<br />
Sett<strong>in</strong>g up the frequency range<br />
Along the horizontal axis of the screen, the frequency of the measured spectrum is projected.<br />
Magnify<strong>in</strong>g the frequency axis and horizontally position<strong>in</strong>g the signal is d<strong>one</strong> <strong>in</strong> the same way as <strong>in</strong> the oscilloscope<br />
and is therefor not discussed here.<br />
Sett<strong>in</strong>g up the frequency axis type<br />
The frequency axis can be set up <strong>in</strong> four different modes:<br />
L<strong>in</strong>ear<br />
Logarithmic<br />
Octaves<br />
the frequency axis runs from 0 to the maximum frequency and has a l<strong>in</strong>ear division.<br />
the frequency axis runs from the m<strong>in</strong>imum frequency to the maximum frequency and has a logarithmic<br />
division.<br />
the frequency axis runs from 22.1 Hz to 22.6 kHz and is divided <strong>in</strong> 10 octaves. The center frequencies,<br />
the lower limits and the higher limits of the octaves are:<br />
f center f lo f hi<br />
31.25 Hz 22.1 Hz 44.2 Hz<br />
62.5 Hz 44.2 Hz 88.4 Hz<br />
125 Hz 88.4 Hz 176.8 Hz<br />
250 Hz 176.8 Hz 353.5 Hz<br />
500 Hz 353.5 Hz 707.1 Hz<br />
1 kHz 707.1 Hz 1.414 kHz<br />
2 kHz 1.414 kHz 2.828 kHz<br />
4 kHz 2.828 kHz 5.656 kHz<br />
8 kHz 5.656 kHz 11.314 kHz<br />
16 kHz 11.314 kHz 22.627 kHz<br />
Each octave is displayed with the same width on the display.<br />
This mode requires that the sampl<strong>in</strong>g frequency is about 44 kHz and the record length is at least<br />
1024 spectral comp<strong>one</strong>nts. When this display mode is switched on, the sampl<strong>in</strong>g frequency can<br />
no longer be set and the record length can only be set to a few lengths.<br />
Third octaves<br />
the frequency axis runs from 17.54 Hz to 22.6 kHz and is divided <strong>in</strong> 31 thirds of octaves. The<br />
center frequencies, the lower limits and the higher limits of the octaves are:<br />
f center f lo f hi<br />
19.68 Hz 17.54 Hz 22.09 Hz<br />
The Spectrum Analyzer<br />
63
<strong>DI</strong>-<strong>770</strong> and WINDAQ/Scope Manual<br />
24.80 Hz 22.09 Hz 17.84 Hz<br />
31.25 Hz 27.84 Hz 35.1 Hz<br />
39.4 Hz 35.1 Hz 44.2 Hz<br />
49.6 Hz 44.2 Hz 55.7 Hz<br />
62.5 Hz 55.7 Hz 70.2 Hz<br />
78.7 Hz 70.2 Hz 88.4 Hz<br />
99.2 Hz 88.4 Hz 111 Hz<br />
125 Hz 111 Hz 140 Hz<br />
157 Hz 140 Hz 177 Hz<br />
198 Hz 177 Hz 223 Hz<br />
250 Hz 223 Hz 280 Hz<br />
315 Hz 280 Hz 354 Hz<br />
397 Hz 354 Hz 445 Hz<br />
500 Hz 445 Hz 561 Hz<br />
630 Hz 561 Hz 707 Hz<br />
794 Hz 707 Hz 891 Hz<br />
1.00 kHz 891 Hz 1.12 kHz<br />
1.26 kHz 1.12 kHz 1.41 kHz<br />
1.59 kHz 1.41 kHz 1.78 kHz<br />
2.00 kHz 1.78 kHz 2.24 kHz<br />
2.52 kHz 2.24 kHz 2.82 kHz<br />
3.17 kHz 2.82 kHz 3.56 kHz<br />
4.00 kHz 3.56 kHz 4.49 kHz<br />
5.04 kHz 4.49 kHz 5.66 kHz<br />
6.35 kHz 5.66 kHz 7.13 kHz<br />
8.00 kHz 7.13 kHz 8.98 kHz<br />
10.1 kHz 8.98 kHz 11.3 kHz<br />
12.7 kHz 11.3 kHz 14.3 kHz<br />
16.0 kHz 14.3 kHz 17.9 kHz<br />
20.2 kHz 17.9 kHz 22.6 kHz<br />
The Spectrum Analyzer<br />
64
<strong>DI</strong>-<strong>770</strong> and WINDAQ/Scope Manual<br />
Each third octave is displayed with the same width on the display.<br />
This mode requires that the sampl<strong>in</strong>g frequency is about 44 kHz and the record length is at least<br />
4096 spectral comp<strong>one</strong>nts. When this display mode is switched on, the sampl<strong>in</strong>g frequency and<br />
the record length can no longer be set.<br />
Note: When the spectrum analyzer is set to Hold and the frequency axis is set to octaves or third octaves, the signal<br />
will not match with the axis and the grid until a new measurement is taken.<br />
Sett<strong>in</strong>g the frequency range<br />
The frequency range can be set <strong>in</strong> two ways: us<strong>in</strong>g the menu of by means of special function keys.<br />
The frequency range is determ<strong>in</strong>ed fully on the sample frequency: the frequency range is half of the sample frequency.<br />
To change the Frequency range us<strong>in</strong>g the menu, enter the Frequency axis menu and select the Frequency range item.<br />
A new menu will appear with all possible frequency range sett<strong>in</strong>gs. The Frequency axis menu can also be entered by<br />
press<strong>in</strong>g the right mouse button over <strong>one</strong> of the frequency axis controls or read outs.<br />
The last item <strong>in</strong> the menu is a user def<strong>in</strong>ed sett<strong>in</strong>g. Activat<strong>in</strong>g this item will br<strong>in</strong>g up a dialog box <strong>in</strong> which a self<br />
def<strong>in</strong>ed frequency range (with<strong>in</strong> the <strong>in</strong>strument hardware limitations) can be entered. Due to the way the sample frequency<br />
is generated <strong>in</strong> the hardware, not all frequencies and thus not all frequency ranges can be generated. If an<br />
<strong>in</strong>valid frequency range is entered, the closest valid frequency range will be generated.<br />
The follow<strong>in</strong>g keys can be used to change the frequency range:<br />
<br />
<br />
Set the frequency range <strong>one</strong> step smaller<br />
Set the frequency range <strong>one</strong> step larger<br />
Sett<strong>in</strong>g the spectrum record length<br />
The spectrum analyzer takes a number of samples to determ<strong>in</strong>e the frequency spectrum of the <strong>in</strong>put signal. This number<br />
has to be a power of 2. After the FFT calculation, a spectrum with half of that number spectral comp<strong>one</strong>nts is<br />
obta<strong>in</strong>ed. This number of spectral comp<strong>one</strong>nts is called the Record length.<br />
To change the record length, two ways are available: by means of a menu or by means of function keys.<br />
To change the record length us<strong>in</strong>g the menu, enter the Frequency axis menu and select the Record length item.<br />
Another menu will pop up, conta<strong>in</strong><strong>in</strong>g the available record lengths. The Frequency axis menu can also be entered by<br />
press<strong>in</strong>g the right mouse button over <strong>one</strong> of the frequency axis controls or read outs.<br />
For chang<strong>in</strong>g the record length the follow<strong>in</strong>g function keys are available:<br />
<br />
<br />
Select a shorter record length<br />
Select a longer record length<br />
Note: Calculat<strong>in</strong>g a spectrum is time consum<strong>in</strong>g. The time need for calculat<strong>in</strong>g a spectrum is strongly dependent on<br />
the calculat<strong>in</strong>g power of the computer and of the selected record length.<br />
Sett<strong>in</strong>g up the FFT<br />
FFT w<strong>in</strong>dow function<br />
To reduce 'smear<strong>in</strong>g' errors (See W<strong>in</strong>dow<strong>in</strong>g), a w<strong>in</strong>dow<strong>in</strong>g function can be selected.<br />
The Spectrum Analyzer<br />
65
<strong>DI</strong>-<strong>770</strong> and WINDAQ/Scope Manual<br />
To select a w<strong>in</strong>dow<strong>in</strong>g function, press the W<strong>in</strong>dow button ( ) or select the item FFT w<strong>in</strong>dow function... from<br />
the Sett<strong>in</strong>gs menu. A dialog will appear <strong>in</strong> which the requested w<strong>in</strong>dow can be selected. A graphic display will show<br />
effect of the w<strong>in</strong>dow<strong>in</strong>g function on the sampled signal.<br />
The available w<strong>in</strong>dow types are:<br />
rectangular (all data is not changed)<br />
Hann<strong>in</strong>g (s<strong>in</strong>usoidal)<br />
Hamm<strong>in</strong>g (s<strong>in</strong>usoidal)<br />
Bartlett (s<strong>in</strong>usoidal)<br />
Blackman (triangular)<br />
Parzen (triangular)<br />
Perform<strong>in</strong>g measurements<br />
When all sett<strong>in</strong>gs are made, measurements can be made.<br />
Start and stop measur<strong>in</strong>g<br />
To avoid a new screen of measurement data replac<strong>in</strong>g an old screen, measur<strong>in</strong>g an display<strong>in</strong>g of data can be stopped.<br />
This can be d<strong>one</strong> <strong>in</strong> several ways: by press<strong>in</strong>g the Pause button (<br />
), by press<strong>in</strong>g the key of by activat<strong>in</strong>g the<br />
item Stop cont<strong>in</strong>uous measur<strong>in</strong>g from the Measure menu.<br />
When measur<strong>in</strong>g is stopped, the latest measured data will rema<strong>in</strong> on the screen. The Pause button changes to a Play<br />
button ( ) and the One shot button ( ) becomes available.<br />
The measured signal can now be exam<strong>in</strong>ed.<br />
S<strong>in</strong>gle measurements<br />
To perform a s<strong>in</strong>gle measurement, press the One shot button, press the key of activate the Perform a s<strong>in</strong>gle measurement<br />
item from the Measure menu. When <strong>in</strong> the Spectrum analyzer averag<strong>in</strong>g is selected, there will be performed<br />
as many measurements as there are set for the averag<strong>in</strong>g and then measur<strong>in</strong>g will stop.<br />
Cont<strong>in</strong>uous measur<strong>in</strong>g can be started aga<strong>in</strong> by press<strong>in</strong>g the Play button, the key or the item Start cont<strong>in</strong>uous measur<strong>in</strong>g<br />
from the Measure menu. The One shot button will be disabled aga<strong>in</strong>.<br />
Averag<strong>in</strong>g<br />
When a noisy signal is measured, the <strong>in</strong>fluence of the noise can be elim<strong>in</strong>ated by averag<strong>in</strong>g several spectra. The noise<br />
comp<strong>one</strong>nt(s) will disappear and the actual signal rema<strong>in</strong>s.<br />
Averag<strong>in</strong>g can be switched on by select<strong>in</strong>g the item Perform averag<strong>in</strong>g of from the Measure menu. In the next menu a<br />
number of measurements can be selected that have to be averaged. The item 1 measurement will switch off averag<strong>in</strong>g.<br />
When averag<strong>in</strong>g is set to e.g. 20 measurements and the spectrum analyzer is set to Pause, press<strong>in</strong>g the One shot button<br />
will result <strong>in</strong> tak<strong>in</strong>g 20 measurements which are averaged<br />
Measur<strong>in</strong>g maximum values<br />
The spectrum analyzer can be set to measure and display only the maximum values of the spectral comp<strong>one</strong>nts. After<br />
a number of measurements the highest value of each spectral comp<strong>one</strong>nt is displayed then.<br />
To enable measur<strong>in</strong>g maximum values, enter the Measure menu and select the choice Measure max values. A check<br />
mark <strong>in</strong> front of the menu item <strong>in</strong>dicates whether measur<strong>in</strong>g maximum values is switched on or off.<br />
The Spectrum Analyzer<br />
66
<strong>DI</strong>-<strong>770</strong> and WINDAQ/Scope Manual<br />
Note: The display of maximum values is reset when the <strong>in</strong>strument sett<strong>in</strong>g changes<br />
H<strong>in</strong>t: This mode can be useful when the frequency response characteristic of a device needs to be determ<strong>in</strong>ed. Apply<br />
a frequency sweeped signal and switch on Measure max values and the characteristic will be created.<br />
Measure the Total Harmonic Distortion of a signal<br />
With the spectrum analyzer it is possible to measure the Total Harmonic Distortion of a signal.<br />
The THD is def<strong>in</strong>ed as:<br />
where V 1 is the RMS amplitude of the base frequency of the <strong>in</strong>put signal, V 2 .. V n are the RMS amplitudes of each<br />
higher harmonic.<br />
To measure the THD, enter the Measure menu and select the Total Harmonic Distortion item or by press<strong>in</strong>g the THD<br />
button (<br />
2 2 2 2 2 2 2 2 2<br />
10 V<br />
20<br />
2 + V 3 + V 4 + V 5 + V 6 + V 7 + V 8 + V 9 + .. + V<br />
× log--------------------------------------------------------------------------------------------------------------------------------------------------- n<br />
V 1<br />
). The software will determ<strong>in</strong>e the base frequency of the signal by assum<strong>in</strong>g that the spectral<br />
comp<strong>one</strong>nt with the largest amplitude is the base frequency. Then the amplitudes of all higher harmonics (up to 100)<br />
<strong>in</strong> the measured record are determ<strong>in</strong>ed and the THD is determ<strong>in</strong>ed.<br />
In the THD output w<strong>in</strong>dow the base frequency of the signal is given, the harmonic distortion <strong>in</strong> dB is given and a<br />
table with the amplitudes of all used harmonics is given. This is d<strong>one</strong> for all active channels.<br />
The number of harmonics that is used for the calculation depends on the base frequency. If the base frequency is low,<br />
more harmonics are found than when the base frequency is high. The calculation rout<strong>in</strong>e will use up to 100 harmonics<br />
or up to a user def<strong>in</strong>ed number. This user def<strong>in</strong>ed number can be set by enter<strong>in</strong>g the Measure menu and select<strong>in</strong>g the<br />
item Max. number of harmonics to use. A new menu will pop up with the possible numbers.<br />
Perform<strong>in</strong>g cursor measurements<br />
Like <strong>in</strong> the oscilloscope, the spectrum analyzer has a set of cursors to perform measurements on the displayed signals.<br />
The cursors <strong>in</strong> the spectrum analyzer work almost like <strong>in</strong> the oscilloscope, so only the differences are discussed here.<br />
Refer to chapter 2, the oscilloscope, for more explanation on how to work with the cursors.<br />
Sett<strong>in</strong>g up the cursor measurements<br />
With the cursors it is possible to measure the <strong>in</strong>put signal(s) <strong>in</strong> several ways. To set up the cursor measurements,<br />
press the sett<strong>in</strong>gs button at the cursor readout w<strong>in</strong>dow (the right most button at the left top of the w<strong>in</strong>dow caption) A<br />
menu appears, conta<strong>in</strong><strong>in</strong>g the follow<strong>in</strong>g options. The menu can also be called by press<strong>in</strong>g the right mouse button over<br />
the table.<br />
Time<br />
Frequency left:<br />
Frequency right:<br />
Frequency difference:<br />
the frequency at the position of the left cursor is determ<strong>in</strong>ed.<br />
the frequency at the position of the right cursor is determ<strong>in</strong>ed.<br />
the frequency difference between the left and right cursor is determ<strong>in</strong>ed.<br />
Voltage<br />
Voltage left:<br />
Voltage right:<br />
the voltage of the left cursor will be displayed.<br />
the voltage of the right cursor will be displayed.<br />
The Spectrum Analyzer<br />
67
<strong>DI</strong>-<strong>770</strong> and WINDAQ/Scope Manual<br />
Voltage difference:<br />
the difference between the voltage of the left and the voltage of the right cursor is calculated.<br />
Select<strong>in</strong>g the m<strong>in</strong> and max of the signal, the top-top value is calculated.<br />
Distortion<br />
The Total Harmonic Distortion of the <strong>in</strong>put signal is determ<strong>in</strong>ed. Up to 100 harmonics are used for the calculation<br />
Automatic track<strong>in</strong>g cursors<br />
If this option is enabled, the voltage levels of the cursors are automatically set to the voltage levels of the sample<br />
numbers which correspond to the left and right cursor.<br />
Calculate values<br />
If this option is disabled, no new calculations will be d<strong>one</strong> until the option is enabled.<br />
Show measurement name<br />
Show measured value<br />
Show measurement unit<br />
To reduce the space used by the w<strong>in</strong>dow on the screen, the measurement name, value and/or unit can be hidden.<br />
This results <strong>in</strong> the disappearance of the correspond<strong>in</strong>g column which results <strong>in</strong> a smaller w<strong>in</strong>dow.<br />
Display font<br />
By select<strong>in</strong>g this option, the font which is used to display the str<strong>in</strong>gs and values can be changed. The font sett<strong>in</strong>gs<br />
which can be changed are: font name, font style, font size and the font color.<br />
Background color<br />
By select<strong>in</strong>g this option, the background color can be changed. Some font colors like e.g. light green are not show<strong>in</strong>g<br />
up very good on a white background. Change the background color to, e.g. black for a better result.<br />
The Spectrum Analyzer<br />
68
<strong>DI</strong>-<strong>770</strong> and WINDAQ/Scope Manual<br />
10. The Function Generator<br />
The <strong>DI</strong>-<strong>770</strong> is also equipped with a function generator.<br />
With the function generator, signals of various shapes, with adjustable frequency, symmetry, amplitude and offset.<br />
Next to that, the function generator conta<strong>in</strong>s a sweep generator, which can <strong>in</strong> comb<strong>in</strong>ation with the spectrum analyzer,<br />
be used for creat<strong>in</strong>g frequency response characteristics of comp<strong>one</strong>nts or circuits.<br />
And the function generator <strong>provides</strong> for a number of user def<strong>in</strong>able preset positions.<br />
Pr<strong>in</strong>ciple of the function generator<br />
The function generator uses the DDS technique. DDS stands for Direct Digital Synthesis, a technique that uses digital<br />
data process<strong>in</strong>g blocks to generate a frequency-tunable with a fixed-frequency precision clock. DDS allows to<br />
generate low distortion signals with very accurate frequency adjustment, <strong>in</strong> a fully digital way.<br />
Structure of the function generator<br />
The function generator is built out of a number of functional blocks.<br />
At the top a display is located, which shows the signal shape and the other sett<strong>in</strong>gs of the function generator. Left of<br />
the display there are the signal shape selector buttons. Below the display are the controls for the frequency, symmetry,<br />
amplitude and offset of the signal. At the right of the display are a key pad for numerical <strong>in</strong>put and a key pad for the<br />
presets.<br />
This part of the screen can be hidden us<strong>in</strong>g the small button at the right upper corner of the display of the function<br />
generator. The function generator will become smaller and tak<strong>in</strong>g up less space on the computer display. Press<strong>in</strong>g the<br />
button aga<strong>in</strong> will expand the w<strong>in</strong>dow aga<strong>in</strong>. The same can be obta<strong>in</strong>ed by press<strong>in</strong>g keys .<br />
The Function Generator<br />
69
<strong>DI</strong>-<strong>770</strong> and WINDAQ/Scope Manual<br />
Controll<strong>in</strong>g the function generator<br />
Signal shape<br />
With the signal shape selector buttons the signal type can be set. Possible signals are:<br />
S<strong>in</strong>e<br />
Triangle<br />
Square<br />
DC<br />
White noise<br />
File<br />
a s<strong>in</strong>e wave is generated<br />
a triangle wave is generated<br />
a square wave is generated<br />
a constant DC level is generated<br />
a white noise is generated<br />
a signal from a file is generated<br />
The signal type File is discussed later.<br />
Frequency<br />
In the Frequency box all controls for adjust<strong>in</strong>g the signal frequency are located. Seven decade buttons set a frequency<br />
range <strong>in</strong> which the frequency can be set us<strong>in</strong>g the slider. Each range runs from 0.2 to 2 times the value on the button.<br />
When the signal shape is set to DC, the frequency adjustment is disabled.<br />
Symmetry<br />
The symmetry of a signal <strong>in</strong>dicates the relation between the length of the positive part of the period to the total length<br />
of the period. A symmetry of 50% means that the positive part is exactly half of the total period.<br />
Us<strong>in</strong>g the slider <strong>in</strong> the Symmetry box, the symmetry can be adjusted between 1% and 99%. The Mid button sets the<br />
symmetry to 50%, the centre position.<br />
When the signal shape is set to DC or White noise, the symmetry adjustment is disabled.<br />
The Function Generator<br />
70
<strong>DI</strong>-<strong>770</strong> and WINDAQ/Scope Manual<br />
Amplitude<br />
The amplitude of the output signal can be adjusted <strong>in</strong> three ranges: not attenuated, -20 dB attenuated or -40 dB attenuated.<br />
With the slider a voltage between 0 Volt and 12 Volt (or 0 Volt and 10 Volt, depend<strong>in</strong>g on the <strong>in</strong>strument) can<br />
be set.<br />
DC offset<br />
It is possible to add a DC offset to the output signal. In the DC offset box there is a slider for the amplitude of the offset.<br />
The button will set the DC offset back to zero.<br />
When the signal shape is set to DC, the slider is used to toggle the polarity of the DC signal<br />
Numerical <strong>in</strong>put<br />
All described functions can also be controlled us<strong>in</strong>g the keyboard. When the w<strong>in</strong>dow is expanded, a small key pad is<br />
located which enables enter<strong>in</strong>g all sett<strong>in</strong>gs.<br />
This key pad can be controlled by mouse but also with the keyboard of the computer. In that case, the w<strong>in</strong>dow doesn't<br />
need to be expanded.<br />
The top four keys <strong>in</strong>dicate which sett<strong>in</strong>g will be adjusted. The correspond<strong>in</strong>g read<strong>in</strong>g <strong>in</strong> the display will start bl<strong>in</strong>k<strong>in</strong>g.<br />
Also the numerical keys will be enabled and the required value can be entered. The <strong>in</strong>put can be ended by press<strong>in</strong>g<br />
the key.<br />
The follow<strong>in</strong>g keys are available:<br />
Adjust the symmetry of the signal<br />
Adjust the DC offset of the signal<br />
The Function Generator<br />
71
<strong>DI</strong>-<strong>770</strong> and WINDAQ/Scope Manual<br />
Adjust the amplitude of the signal<br />
Adjust the frequency of the signal<br />
...<br />
Add this figure to the entered number<br />
Add a decimal po<strong>in</strong>t to the entered number<br />
Reverse the polarity of the entered number<br />
Term<strong>in</strong>ate the <strong>in</strong>put<br />
Remove the last entered character<br />
End the <strong>in</strong>put and apply it<br />
Term<strong>in</strong>ate the <strong>in</strong>put<br />
Presets<br />
The function generator has 8 preset positions to store signal sett<strong>in</strong>gs.<br />
With a s<strong>in</strong>gle press on a button, a signal with a specified shape, amplitude, offset, frequency and symmetry can be<br />
generated.<br />
The presets are stored together with the application sett<strong>in</strong>gs and are restored each time the application is started.<br />
Stor<strong>in</strong>g<br />
When a signal is set that is not yet stored <strong>in</strong> a preset position, and there is a free preset position available, the store<br />
button is enabled. By press<strong>in</strong>g the button, the signal sett<strong>in</strong>gs are stored <strong>in</strong> the free preset position with the lowest<br />
number.<br />
The Function Generator<br />
72
<strong>DI</strong>-<strong>770</strong> and WINDAQ/Scope Manual<br />
Select<strong>in</strong>g<br />
When presets are stored, the correspond<strong>in</strong>g preset buttons are enabled. By hover<strong>in</strong>g the mouse po<strong>in</strong>ter over <strong>one</strong> of the<br />
buttons, the sett<strong>in</strong>gs of that preset position are displayed.<br />
By press<strong>in</strong>g a preset button, the function generator is set accord<strong>in</strong>g to the stored sett<strong>in</strong>gs. The button of the preset will<br />
be lowered, <strong>in</strong>dicat<strong>in</strong>g that preset is active.<br />
When dur<strong>in</strong>g use of the function generator a sett<strong>in</strong>g is changed, and the new sett<strong>in</strong>g corresponds with a stored preset,<br />
the correspond<strong>in</strong>g button of that preset will be lowered. When a preset is selected and the sett<strong>in</strong>g of the function generator<br />
is changed to a sett<strong>in</strong>g that does not correspond with the preset, the correspond<strong>in</strong>g button will be raised.<br />
Clear<strong>in</strong>g<br />
To clear a stored preset, it first needs to be selected by press<strong>in</strong>g the correspond<strong>in</strong>g button.<br />
The clear button will become active. Press<strong>in</strong>g this button will clear the preset position and make the location available<br />
for a new preset. The correspond<strong>in</strong>g button will be disabled.<br />
Perform<strong>in</strong>g a sweep<br />
The function generator offers, <strong>in</strong> comb<strong>in</strong>ation with the spectrum analyzer, the possibility to generate a signal with a<br />
frequency sweep.<br />
For this purpose the spectrum analyzer needs to be active as well. After each measurement the spectrum analyzer performs,<br />
the frequency of the generator is <strong>in</strong>creased with a certa<strong>in</strong> step size, until the highest value is reached. In that<br />
case the frequency will be set to the lowest value.<br />
Below the signal shape buttons is a sweep button located, for sett<strong>in</strong>g the sweep parameters. Next to the button there is<br />
an on/off button, for switch<strong>in</strong>g the sweep function on and off. When the sweep button is pressed, the sweep generator<br />
sett<strong>in</strong>gs dialog is displayed.<br />
In this dialog all sett<strong>in</strong>gs of the sweep can be made.<br />
The easiest sett<strong>in</strong>g is Fully controlled by spectrum analyzer. In this sett<strong>in</strong>g, the sett<strong>in</strong>g of the frequency axis of the<br />
spectrum analyzer determ<strong>in</strong>es how the start and stop frequency and the frequency step size are set. The lowest visible<br />
The Function Generator<br />
73
<strong>DI</strong>-<strong>770</strong> and WINDAQ/Scope Manual<br />
frequency <strong>in</strong> the spectrum analyzer sets the start frequency of the sweep. The highest visible frequency <strong>in</strong> the spectrum<br />
analyzer sets the stop frequency of the sweep. This is limited to the maximum range of the function generator.<br />
The frequency step size is determ<strong>in</strong>ed by the frequency range of the spectrum analyzer, divided by the number of b<strong>in</strong>s<br />
<strong>in</strong> the spectrum. When a sweep is active and a sett<strong>in</strong>g <strong>in</strong> the spectrum analyzer is changed, the sweep parameters will<br />
change accord<strong>in</strong>gly.<br />
At each step, the frequency of the generator will be set to a value that falls exactly <strong>in</strong> <strong>one</strong> s<strong>in</strong>gle b<strong>in</strong>, therefor no calculation<br />
errors occur and no w<strong>in</strong>dow is required.<br />
The sett<strong>in</strong>g Manual requires that all sett<strong>in</strong>gs are set by the user. The start and stop frequency can be set freely. The frequency<br />
axis of the spectrum analyzer will be set accord<strong>in</strong>gly, so only the range that is sweeped will be visible.<br />
The frequency step size can be determ<strong>in</strong>ed from the spectrum length. With each step a frequency will be set that generates<br />
no calculation errors. It's also possible to set the step size manually, but that will probably do generate calculation<br />
errors <strong>in</strong> the FFT.<br />
H<strong>in</strong>t: For easy creat<strong>in</strong>g frequency response characteristics, set the measure mode of the spectrum analyzer to Measure<br />
maximum values and switch off autorang<strong>in</strong>g for the channels<br />
After sett<strong>in</strong>g the sweep parameters, the sweep function can be switched on us<strong>in</strong>g the on/off button. Dur<strong>in</strong>g the sweep,<br />
the frequency readout <strong>in</strong> the display will follow the output frequency.<br />
Note: When the sweep function is used to determ<strong>in</strong>e frequency response characteristics, be certa<strong>in</strong> to set the signal<br />
shape to S<strong>in</strong>e.<br />
Generat<strong>in</strong>g a previous measured signal from a file<br />
It is possible to generate previously measured signals with the function generator, provided of course that the amplitude<br />
and frequency of the signal are with<strong>in</strong> the specs of the generator.<br />
Measur<strong>in</strong>g and stor<strong>in</strong>g a signal<br />
The function generator has two possibilities to generate previous measured signals. It can either use the DDS mode or<br />
it can use a l<strong>in</strong>ear mode.<br />
In the DDS mode, a waveform of 1024 po<strong>in</strong>ts is used to generate the signal. Due to the DDS technique, very accurate<br />
output signal frequencies can be obta<strong>in</strong>ed.<br />
In l<strong>in</strong>ear mode, a waveform of 64K po<strong>in</strong>ts is used. The sample clock of the generator can be set to a number of sett<strong>in</strong>gs,<br />
<strong>in</strong> order to obta<strong>in</strong> different output frequencies. The number of sett<strong>in</strong>gs is limited. When a stored waveform is<br />
used that is smaller than 64K po<strong>in</strong>ts, the rema<strong>in</strong><strong>in</strong>g po<strong>in</strong>ts are filled with a 0 volt value.<br />
A signal that is measured, stored and later generated, has to meet certa<strong>in</strong> po<strong>in</strong>ts, <strong>in</strong> order to be usable.<br />
• The signal has to be measured <strong>in</strong> channel 1 of the scope.<br />
• For DDS mode, the record length of the scope has to be set to 1024 po<strong>in</strong>ts, for l<strong>in</strong>ear mode to any required<br />
length, but 64K is preferred.<br />
• If possible, the sampl<strong>in</strong>g frequency of the scope has to be set <strong>in</strong> such a way that exactly 1 period of the signal is<br />
captured <strong>in</strong> the 1024 po<strong>in</strong>ts or 64K po<strong>in</strong>ts.<br />
After the signal is measured, it can be saved to disk us<strong>in</strong>g Save waveform... from the File-menu.<br />
Sett<strong>in</strong>g the function generator<br />
At the left hand side of the display <strong>in</strong> the generator, a number of signal shape buttons are located, <strong>one</strong> of them is<br />
named File. With this button a signal from a file can be selected and loaded <strong>in</strong>to the generator.<br />
Press<strong>in</strong>g this button will pop up a file selection dialog <strong>in</strong> which the proper waveform file can be selected.<br />
After read<strong>in</strong>g the signal, the amplitude and frequency of the signal can be adjusted us<strong>in</strong>g the proper controls.<br />
The Function Generator<br />
74
DATAQ Instruments, Inc.<br />
241 Spr<strong>in</strong>gside Drive<br />
Akron, Ohio 44333<br />
Teleph<strong>one</strong>: 330-668-1444<br />
Fax: 330-666-5434<br />
E-mail: support@dataq.com<br />
Direct Product L<strong>in</strong>ks<br />
(click on text to jump to page)<br />
Data Acquisition | Data Logger | Chart Recorder | Thermocouple | <strong>Oscilloscope</strong>