
You also want an ePaper? Increase the reach of your titles
YUMPU automatically turns print PDFs into web optimized ePapers that Google loves.
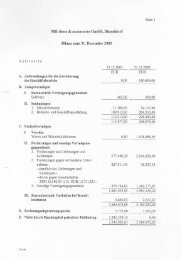
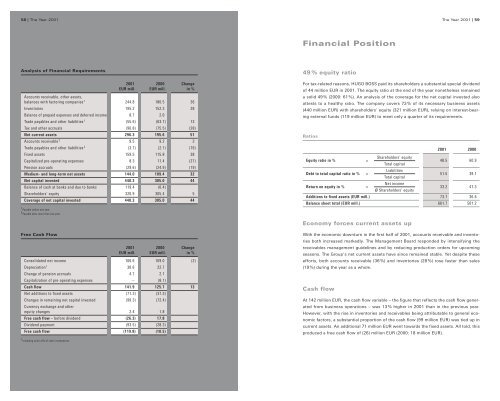
58 | The Year <strong>2001</strong><br />
Analysis of Financial Requirements<br />
Free Cash Flow<br />
<strong>2001</strong> 2000 Change<br />
EUR mill. EUR mill. in %<br />
Accounts receivable, other assets,<br />
balances with factoring companies 1 244.8 180.5 36<br />
Inventories 195.2 152.3 28<br />
Balance of prepaid expenses and deferred income 8.7 2.0<br />
Trade payables and other liabilities 1 (55.6) (63.7) 13<br />
Tax and other accruals (96.8) (75.5) (28)<br />
Net current assets 296.3 195.6 51<br />
Accounts receivable 2 9.5 9.2 3<br />
Trade payables and other liabilities 2 (3.7) (2.1) (76)<br />
Fixed assets 159.5 115.8 38<br />
Capitalized pre-operating expenses 8.3 11.4 (27)<br />
Pension accruals (29.6) (24.9) (19)<br />
Medium- and long-term net assets 144.0 109.4 32<br />
Net capital invested 440.3 305.0 44<br />
Balance of cash at banks and due to banks 119.4 (0.4)<br />
Shareholders’ equity 320.9 305.4 5<br />
Coverage of net capital invested 440.3 305.0 44<br />
1 Payable within one year.<br />
2 Payable after more than one year.<br />
<strong>2001</strong> 2000 Change<br />
EUR mill. EUR mill. in %<br />
Consolidated net income 106.6 109.0 (2)<br />
Depreciation 1 30.6 22.7<br />
Change of pension accruals 4.7 2.1<br />
Capitalization of pre-operating expenses – (8.1)<br />
Cash flow 141.9 125.7 13<br />
Net additions to fixed assets (71.3) (37.3)<br />
Changes in remaining net capital invested<br />
Currency exchange and other<br />
(99.3) (72.4)<br />
equity changes 2.4 1.8<br />
Free cash flow – before dividend (26.3) 17.8<br />
Dividend payment (93.5) (28.3)<br />
Free cash flow (119.8) (10.5)<br />
1 Including write-offs of other investments.<br />
Financial Position<br />
49 % equity ratio<br />
For tax-related reasons, <strong>HUGO</strong> <strong>BOSS</strong> paid its shareholders a substantial special dividend<br />
of 44 million EUR in <strong>2001</strong>. The equity ratio at the end of the year nonetheless remained<br />
a solid 49% (2000: 61%). An analysis of the coverage for the net capital invested also<br />
attests to a healthy ratio. The company covers 73% of its necessary business assets<br />
(440 million EUR) with shareholders’ equity (321 million EUR), relying on interest-bearing<br />
external funds (119 million EUR) to meet only a quarter of its requirements.<br />
Ratios<br />
Equity ratio in % =<br />
Debt to total capital ratio in % =<br />
Return on equity in % =<br />
Economy forces current assets up<br />
With the economic downturn in the first half of <strong>2001</strong>, accounts receivable and inventories<br />
both increased markedly. The Management Board responded by intensifying the<br />
receivables management guidelines and by reducing production orders for upcoming<br />
seasons. The Group’s net current assets have since remained stable. Yet despite these<br />
efforts, both accounts receivable (36%) and inventories (28%) rose faster than sales<br />
(19%) during the year as a whole.<br />
Cash flow<br />
Shareholders’ equity<br />
Total capital<br />
Liabilities<br />
Total capital<br />
Net income<br />
ø Shareholders’ equity<br />
The Year <strong>2001</strong> | 59<br />
<strong>2001</strong> 2000<br />
48.5 60.9<br />
51.5 39.1<br />
33.2 41.3<br />
Additions to fixed assets (EUR mill.) 73.7 36.6<br />
Balance sheet total (EUR mill.) 661.7 501.2<br />
At 142 million EUR, the cash flow variable – the figure that reflects the cash flow generated<br />
from business operations – was 13% higher in <strong>2001</strong> than in the previous year.<br />
However, with the rise in inventories and receivables being attributable to general economic<br />
factors, a substantial proportion of the cash flow (99 million EUR) was tied up in<br />
current assets. An additional 71 million EUR went towards the fixed assets. All told, this<br />
produced a free cash flow of (26) million EUR (2000: 18 million EUR).