Late Quaternary activity of the Feldbiss Fault Zone, Roer ... - Falw.vu
Late Quaternary activity of the Feldbiss Fault Zone, Roer ... - Falw.vu
Late Quaternary activity of the Feldbiss Fault Zone, Roer ... - Falw.vu

You also want an ePaper? Increase the reach of your titles
YUMPU automatically turns print PDFs into web optimized ePapers that Google loves.
Tectonophysics 352 (2002) 295–315<br />
www.elsevier.com/locate/tecto<br />
<strong>Late</strong> <strong>Quaternary</strong> <strong>activity</strong> <strong>of</strong> <strong>the</strong> <strong>Feldbiss</strong> <strong>Fault</strong> <strong>Zone</strong>,<br />
<strong>Roer</strong> Valley Rift System, <strong>the</strong> Ne<strong>the</strong>rlands, based on<br />
displaced fluvial terrace fragments<br />
R.F. Houtgast *, R.T. Van Balen , L.M. Bouwer , G.B.M. Brand , J.M. Brijker<br />
Faculteit der Aardwetenschappen, Department <strong>of</strong> <strong>Quaternary</strong> Geology and Geomorphology, Vrije Universiteit, de Boelelaan 1085,<br />
1081 HV, Amsterdam, The Ne<strong>the</strong>rlands<br />
Received 5 November 2001; accepted 19 April 2002<br />
Abstract<br />
The Meuse River crosses <strong>the</strong> <strong>Feldbiss</strong> <strong>Fault</strong> <strong>Zone</strong>, one <strong>of</strong> <strong>the</strong> main border fault zones <strong>of</strong> <strong>the</strong> <strong>Roer</strong> Valley Graben in <strong>the</strong><br />
sou<strong>the</strong>rn part <strong>of</strong> <strong>the</strong> Ne<strong>the</strong>rlands. Uplift <strong>of</strong> <strong>the</strong> area south <strong>of</strong> <strong>the</strong> <strong>Feldbiss</strong> <strong>Fault</strong> <strong>Zone</strong> forced <strong>the</strong> Meuse River to incise and, as a<br />
result, a flight <strong>of</strong> terraces was formed. <strong>Fault</strong>s <strong>of</strong> <strong>the</strong> <strong>Feldbiss</strong> <strong>Fault</strong> <strong>Zone</strong> have displaced <strong>the</strong> Middle and <strong>Late</strong> Pleistocene terrace<br />
deposits. In this study, an extensive geomorphological survey was carried out to locate <strong>the</strong> faults <strong>of</strong> <strong>the</strong> <strong>Feldbiss</strong> <strong>Fault</strong> <strong>Zone</strong> and<br />
to determine <strong>the</strong> displacement history <strong>of</strong> terrace deposits.The <strong>Feldbiss</strong> <strong>Fault</strong> <strong>Zone</strong> is characterized by an average displacement<br />
rate <strong>of</strong> 0.041–0.047 mm a<br />
1 during <strong>the</strong> <strong>Late</strong> Pleistocene. Individual faults show an average displacement rate ranging between<br />
0.010 and 0.034 mm a<br />
1 . The spatial variation in displacement rates along <strong>the</strong> individual faults reveals a system <strong>of</strong><br />
overstepping faults. These normal faults developed by reactivation <strong>of</strong> Paleozoic strike-slip faults.As fault displacements at <strong>the</strong><br />
bases <strong>of</strong> <strong>the</strong> younger terrace deposits are apparently similar to <strong>the</strong> tops <strong>of</strong> <strong>the</strong> adjacent older terrace, <strong>the</strong> age <strong>of</strong> <strong>the</strong>se horizons is<br />
<strong>the</strong> same within thousands <strong>of</strong> years. This implies that <strong>the</strong> model <strong>of</strong> terrace development by rapid fluvial incision followed by<br />
slow aggradation does apply for this area.<br />
D 2002 Elsevier Science B.V. All rights reserved.<br />
Keywords: <strong>Roer</strong> Valley Rift System; <strong>Feldbiss</strong> <strong>Fault</strong> <strong>Zone</strong>; <strong>Fault</strong> displacement rates; Fluvial terraces; Meuse River; <strong>Quaternary</strong><br />
1. Introduction<br />
In <strong>the</strong> sou<strong>the</strong>rn part <strong>of</strong> <strong>the</strong> Ne<strong>the</strong>rlands, <strong>the</strong> Meuse<br />
River crosses <strong>the</strong> <strong>Feldbiss</strong> <strong>Fault</strong> <strong>Zone</strong>. This fault zone<br />
forms <strong>the</strong> boundary between a strongly subsiding <strong>Roer</strong><br />
Valley Graben, to <strong>the</strong> north and <strong>the</strong> uplifting Ardennes<br />
* Corresponding author. Faculty <strong>of</strong> Earth Sciences, Vrije<br />
Universiteit Amsterdam, De Boelelaan 1085, 1081 HV, Amsterdam,<br />
The Ne<strong>the</strong>rlands. Tel.: +31-20-44-47392; fax: +31-20-64-62457.<br />
E-mail address: hour@geo.<strong>vu</strong>.nl (R.F. Houtgast).<br />
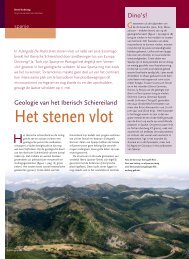
and South Limburg Block in <strong>the</strong> south (Fig. 1). Uplift <strong>of</strong><br />
<strong>the</strong> area south <strong>of</strong> <strong>the</strong> <strong>Feldbiss</strong> <strong>Fault</strong> <strong>Zone</strong> caused <strong>the</strong><br />
Meuse river to incise during <strong>the</strong> Pliocene and <strong>the</strong><br />
<strong>Quaternary</strong> and thus forming a flight <strong>of</strong> terraces (e.g.,<br />
Pissart, 1974; Zonneveld, 1974; Felder et al., 1989; Van<br />
den Berg, 1989; Juvigné and Renard, 1992; Renson et<br />
al., 1999; Pissart et al., 1997; Van Balen et al., 2000).<br />
Numerous studies have been carried out to detect<br />
and quantify large-scale tectonic uplift using terrace<br />
stratigraphy (e.g., Antoine et al., 2000; Krzyszkowski<br />
et al., 2000; Chen and Liu, 2000). Such a study has<br />
0040-1951/02/$ - see front matter D 2002 Elsevier Science B.V. All rights reserved.<br />
PII: S0040-1951(02)00219-6
296<br />
R.F. Houtgast et al. / Tectonophysics 352 (2002) 295–315<br />
Fig. 1. Tectonic features <strong>of</strong> <strong>the</strong> <strong>Roer</strong> Valley Rift System, <strong>the</strong> Ne<strong>the</strong>rlands.<br />
also been carried out for <strong>the</strong> Meuse terraces (Van den<br />
Berg, 1996; Van Balen et al., 2000). Alluvial surfaces<br />
have also been used to date movements on individual<br />
faults (e.g., Hou et al., 1998; Li et al., 1999). In this<br />
study, fluvial terraces are used to detect <strong>activity</strong> along<br />
<strong>the</strong> <strong>Feldbiss</strong> <strong>Fault</strong> <strong>Zone</strong>.<br />
In <strong>the</strong> area where <strong>the</strong> Meuse River crosses <strong>the</strong><br />
<strong>Feldbiss</strong> <strong>Fault</strong> <strong>Zone</strong>, several fault scarps dissect <strong>the</strong><br />
terrace morphology. These scarps <strong>of</strong>fer <strong>the</strong> opportunity<br />
to identify faults that were active during <strong>the</strong> <strong>Late</strong><br />
<strong>Quaternary</strong>. The terrace stratigraphy is used to quantify<br />
<strong>activity</strong> along <strong>the</strong> individual faults. An extensive<br />
geomorphological study combined with an analysis <strong>of</strong><br />
borehole data <strong>of</strong> <strong>the</strong> Dutch Geological Survey (TNO-<br />
NITG) and geo-electric soundings was carried out.<br />
The objective <strong>of</strong> this paper is to establish a <strong>Late</strong><br />
<strong>Quaternary</strong> tectonic model for <strong>the</strong> <strong>Feldbiss</strong> <strong>Fault</strong> <strong>Zone</strong><br />
in <strong>the</strong> Sittard area, using <strong>the</strong> terrace chronostratigraphy<br />
as time control.<br />
2. Tectonic setting<br />
The <strong>Feldbiss</strong> <strong>Fault</strong> <strong>Zone</strong> is <strong>the</strong> sou<strong>the</strong>rn border<br />
fault <strong>of</strong> <strong>the</strong> central Graben <strong>of</strong> <strong>the</strong> <strong>Roer</strong> Valley Rift<br />
System (RVRS). The RVRS is an active rift system,<br />
located in <strong>the</strong> sou<strong>the</strong>rn part <strong>of</strong> <strong>the</strong> Ne<strong>the</strong>rlands, <strong>the</strong><br />
nor<strong>the</strong>astern part <strong>of</strong> Belgium and adjacent parts <strong>of</strong><br />
Germany (Fig. 1). The RVRS extends from <strong>the</strong> Dutch<br />
North Sea coast sou<strong>the</strong>astwards into <strong>the</strong> Lower Rhine<br />
Embayment, which is an integral part <strong>of</strong> a Cenozoic<br />
mega-rift system crossing western and central Europe<br />
(Ziegler, 1992). The RVRS has a complex Mesozoic<br />
and Cenozoic tectonic history, comprising several
R.F. Houtgast et al. / Tectonophysics 352 (2002) 295–315 297<br />
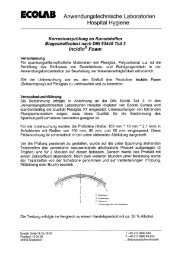
Fig. 2. Map <strong>of</strong> South Limburg (The Ne<strong>the</strong>rlands). Distribution <strong>of</strong> terraces (after Van den Berg, 1989) and location <strong>of</strong> study area.<br />
extensional and inversion phases (Zijerveld et al.,<br />
1992). The current extension phase started during<br />
<strong>the</strong> <strong>Late</strong> Oligocene (Geluk et al., 1994).<br />
The <strong>Roer</strong> Valley Rift System (RVRS) comprises <strong>the</strong><br />
Campine and South Limburg Blocks in <strong>the</strong> south, <strong>the</strong><br />
<strong>Roer</strong> Valley Graben in <strong>the</strong> center, and <strong>the</strong> Peel Block<br />
and <strong>the</strong> Venlo Block in <strong>the</strong> nor<strong>the</strong>ast (Fig. 1). The <strong>Roer</strong><br />
Valley Graben is separated from <strong>the</strong> adjoining blocks by<br />
<strong>the</strong> <strong>Feldbiss</strong> <strong>Fault</strong> <strong>Zone</strong> in <strong>the</strong> southwest and <strong>the</strong> Peel<br />
Boundary <strong>Fault</strong> <strong>Zone</strong> in <strong>the</strong> nor<strong>the</strong>ast, both <strong>of</strong> which<br />
were active during <strong>the</strong> <strong>Quaternary</strong> (e.g., Ahorner, 1962;<br />
Paulissen et al., 1985; Houtgast and Van Balen, 2000).<br />
These fault zones are characterized by a spasmodic<br />
displacement behavior during <strong>the</strong> <strong>Quaternary</strong>. In addition,<br />
<strong>activity</strong> along <strong>the</strong>se fault zones is laterally variable<br />
(Houtgast and Van Balen, 2000).<br />
In <strong>the</strong> Sittard area (Fig. 2), <strong>the</strong> <strong>Feldbiss</strong> <strong>Fault</strong> <strong>Zone</strong><br />
crosses <strong>the</strong> Meuse terraces almost perpendicularly. The
298<br />
R.F. Houtgast et al. / Tectonophysics 352 (2002) 295–315<br />
Fig. 3. Interpreted seismic sections east and west <strong>of</strong> Sittard, after<br />
TNO-NITG (1999). Location <strong>of</strong> section given in Fig. 2.<br />
<strong>Feldbiss</strong> <strong>Fault</strong> <strong>Zone</strong> consists <strong>of</strong> several individual<br />
faults (Fig. 2; TNO-NITG, 1999). In this study, we<br />
focus on <strong>the</strong> <strong>Feldbiss</strong> <strong>Fault</strong> <strong>Zone</strong> east and west <strong>of</strong><br />
Sittard, which consists <strong>of</strong> <strong>the</strong> <strong>Feldbiss</strong>, Geleen and<br />
Heerlerheide <strong>Fault</strong>s. The two interpreted seismic sections,<br />
east and west <strong>of</strong> Sittard illustrate that <strong>the</strong>se faults<br />
were repeatedly reactivated since <strong>the</strong> Jurassic (Fig. 3).<br />
3. Meuse terraces<br />
3.1. Introduction<br />
Due to northwest directed tilting and continuous<br />
uplift <strong>of</strong> <strong>the</strong> South Limburg Block, terrace remnants<br />
are preserved mainly on <strong>the</strong> east bank <strong>of</strong> <strong>the</strong> Meuse<br />
river valley. The Meuse terraces in South Limburg<br />
have been <strong>the</strong> subject <strong>of</strong> many studies and have been<br />
extensively described (e.g., Van Rummelen, 1942;<br />
Brueren, 1945; Zonneveld, 1974; Felder et al., 1989;<br />
Van den Berg, 1989, 1996). Traditionally <strong>the</strong> Meuse<br />
terraces are subdivided into four groups: <strong>the</strong> East<br />
Meuse Terraces, Main (Higher) Terraces, Middle<br />
Terraces and Lower Terrace (Table 1; Zonneveld,<br />
1974). The different age models <strong>of</strong> <strong>the</strong>se terraces do<br />
not agree (especially for <strong>the</strong> Middle and Higher<br />
Terraces) and different names were proposed (especially<br />
for <strong>the</strong> Lower Terraces). In this paper, we use<br />
<strong>the</strong> terminology <strong>of</strong> Van den Berg (1996). The differences<br />
in <strong>the</strong> age models will be addressed below.<br />
During <strong>the</strong> Pliocene and Early Pleistocene, <strong>the</strong><br />
Meuse flowed east <strong>of</strong> <strong>the</strong> Waubach Island (Van den<br />
Berg, 1996; Fig. 2). The terraces formed in this period<br />
are grouped into <strong>the</strong> East Meuse terraces. During <strong>the</strong><br />
Early Pleistocene <strong>the</strong> Meuse River changed its course<br />
and flowed west <strong>of</strong> <strong>the</strong> Waubach Island. The Higher<br />
Terraces, comprising <strong>the</strong> Geertruid and Pietersberg<br />
Terraces, were formed during <strong>the</strong> Early Pleistocene to<br />
<strong>the</strong> Early (Van den Berg, 1996) or Middle Cromerian<br />
times (Felder et al., 1989; Van Balen et al., 2000). The<br />
Middle Terraces, comprising <strong>the</strong> ’s Gravenvoeren,<br />
Ro<strong>the</strong>m and Caberg Terraces, are <strong>of</strong> Cromerian to<br />
Middle Saalian Age. The Lower Terraces, comprising<br />
<strong>the</strong> Eisden-Lanklaar, Mechelen a/d Meuse and Geistingen<br />
are <strong>of</strong> <strong>Late</strong> Saalian to <strong>Late</strong> Glacial age (Felder et<br />
al., 1989; Van den Berg, 1996; Van Balen et al., 2000).<br />
3.2. Terraces in <strong>the</strong> Sittard area<br />
The Meuse terrace fragments in this area belong to<br />
<strong>the</strong> Middle and <strong>the</strong> Lower Terraces (Fig. 2). The<br />
Caberg Terraces <strong>of</strong> <strong>the</strong> Middle Terrace sequence are<br />
aggradational terraces formed by a braided river during<br />
cold periods (Paulissen, 1973). The Eisden-Lanklaar<br />
and Geistingen Terraces <strong>of</strong> <strong>the</strong> Lower Terrace<br />
system were also formed by a braided river system<br />
during a cold period (Paulissen, 1973). An important<br />
stratigraphic characteristic <strong>of</strong> <strong>the</strong> Geistingen Terrace is<br />
<strong>the</strong> complete absence <strong>of</strong> coversands. Consequently,<br />
this terrace was formed during or after <strong>the</strong> latest<br />
period <strong>of</strong> coversand deposition, i.e. during or after<br />
<strong>the</strong> Younger Dryas period (Paulissen, 1973).<br />
All terraces in this study area have been deposited<br />
by braided river systems and are characterized by<br />
comparable lithological compositions. Generally,<br />
<strong>the</strong>se terraces consist <strong>of</strong> a lower part which is formed<br />
by stacked channel deposits, mainly composed <strong>of</strong><br />
gravel and coarse sand (unit 1) and an upper part
R.F. Houtgast et al. / Tectonophysics 352 (2002) 295–315 299<br />
Table 1<br />
which is build up <strong>of</strong> overbank and floodplain deposits<br />
composed <strong>of</strong> coarse to fine sands and loam (unit 2).<br />
These finer sediments could be <strong>the</strong> overbank and<br />
floodplain deposits <strong>of</strong> <strong>the</strong> same fluvial system that<br />
formed <strong>the</strong> underlying coarse grained deposits (unit<br />
1), leading to comparable ages <strong>of</strong> <strong>the</strong> units. Alternatively,<br />
<strong>the</strong> fine deposits (unit 2) could represent a<br />
different fluvial system active during <strong>the</strong> subsequent<br />
interglacial period, like observed at <strong>the</strong> Caberg 3<br />
Terrace near Maastricht (Vandenberghe, 1993). Therefore,<br />
<strong>the</strong> age <strong>of</strong> unit 2 is ambiguous.<br />
The terrace deposits are <strong>of</strong>ten covered by aeolian<br />
deposits, mainly sandy loess (Mun cher, 1986). The<br />
terrace deposits are underlain by Tertiary Breda or<br />
Kiezelöoliet Formations, which consist <strong>of</strong> fine to<br />
coarse sands (Felder et al., 1989). The base <strong>of</strong> <strong>the</strong><br />
terrace deposits has a spatial height variation <strong>of</strong> up to<br />
several meters, whereas <strong>the</strong> top <strong>of</strong> <strong>the</strong> terrace deposits<br />
generally varies only 1 m (Van den Berg, 1996).<br />
3.3. Existing terrace maps<br />
Two detailed geomorphological/terrace maps have<br />
been published: Felder et al. (1989) and Van den Berg<br />
(1989). Felder and Bosch used <strong>the</strong> base <strong>of</strong> <strong>the</strong> terrace<br />
deposits to distinguish and map <strong>the</strong> different terraces.<br />
Van den Berg used <strong>the</strong> top <strong>of</strong> <strong>the</strong> terrace deposits, i.e.<br />
<strong>the</strong>ir geomorphology and topographic height. As <strong>the</strong><br />
height variability at <strong>the</strong> top <strong>of</strong> <strong>the</strong> terrace deposits is<br />
smaller than <strong>the</strong> height variability at <strong>the</strong>ir base (Van den
300<br />
R.F. Houtgast et al. / Tectonophysics 352 (2002) 295–315<br />
Berg, 1996), mapping <strong>the</strong> top <strong>of</strong> <strong>the</strong> terrace deposits<br />
provides a more accurate picture <strong>of</strong> <strong>the</strong> terrace morphology.<br />
The Van den Berg terrace division differentiates<br />
more terraces in our study area. Therefore, we<br />
prefer <strong>the</strong> Van den Berg (1989) map to <strong>the</strong> Felder et al.<br />
(1989) map as a starting point. However, <strong>the</strong> accuracy<br />
<strong>of</strong> <strong>the</strong> terrace borders in <strong>the</strong> vicinity <strong>of</strong> <strong>the</strong> <strong>Feldbiss</strong><br />
<strong>Fault</strong> <strong>Zone</strong> may be questioned as bending <strong>of</strong> <strong>the</strong> terrace<br />
edges may be explained by downfaulting and not so<br />
much by river <strong>activity</strong> (Fig. 4).<br />
3.4. Age <strong>of</strong> <strong>the</strong> terraces<br />
In order to calculate fault displacement rates an age<br />
model for <strong>the</strong> terraces is required. The age <strong>of</strong> <strong>the</strong><br />
Caberg 3 Terrace (250 ka) has been established by<br />
<strong>the</strong>rmoluminescence and paleontological remains<br />
(Huxtable and Aitken, 1985; Van Kolfschoten et al.,<br />
1993) and is not disputed. For <strong>the</strong> older terraces, <strong>the</strong><br />
age control is less sure. Three different age models for<br />
<strong>the</strong> terraces have been published (Table 1; Felder et al.,<br />
1989; Van den Berg, 1996; Van Balen et al., 2000).<br />
Felder et al. (1989) based <strong>the</strong>ir age model on pollen<br />
data and on correlation to a paleo-temperature curve.<br />
Fig. 4. Influence <strong>of</strong> fault <strong>activity</strong> on terrace heights. Correlation <strong>of</strong><br />
terraces based on altitudes can lead to wrong results.<br />
Van den Berg (1996) also used pollen data, correlation<br />
with <strong>the</strong> paleo-temperature curve and additional local<br />
paleomagnetic measurements. Van Balen et al. (2000)<br />
used data from pollen, regional paleomagnetic measurements<br />
and U/Th measurements, as well as a correlation<br />
<strong>of</strong> Meuse and Rhine terraces. The age control <strong>of</strong><br />
<strong>the</strong> latter terraces is better. The different age models<br />
show some discrepancies, particularly for <strong>the</strong> middle<br />
Pleistocene terraces. The differences are caused by<br />
paleomagnetic data and regional correlations.<br />
The Meuse valley is characterized by flat and wide<br />
terraces its upper part, <strong>the</strong> Main Terraces, and narrow<br />
terraces in its lower part, <strong>the</strong> Middle and Lower Terraces.<br />
The transition is sharply marked in <strong>the</strong> morphology.<br />
The same morphology is also present along <strong>the</strong> Rhine.<br />
As both rivers are located in <strong>the</strong> same tectonic and<br />
climatic setting, <strong>the</strong> morphologic break observed along<br />
<strong>the</strong> Meuse and Rhine should have <strong>the</strong> same age. Several<br />
paleomagnetic measurements constrain <strong>the</strong> age <strong>of</strong> <strong>the</strong><br />
youngest Main Terrace <strong>of</strong> <strong>the</strong> Rhine and Meuse, within<br />
and outside <strong>the</strong> South Limburg area. Therefore, <strong>the</strong><br />
basic questions for <strong>the</strong> terrace age model are: What is<br />
<strong>the</strong> paleomagnetic signature <strong>of</strong> <strong>the</strong> youngest Main<br />
Terrace, and which terrace in <strong>the</strong> South Limburg area<br />
corresponds to this terrace level? Based on upstream<br />
terrace altitude correlation with <strong>the</strong> Belgian part <strong>of</strong> <strong>the</strong><br />
Meuse, Van Balen et al. (2000) concluded that <strong>the</strong><br />
Pietersberg 1 level is <strong>the</strong> youngest Main Terrace level.<br />
Although, based on <strong>the</strong> local morphology, both <strong>the</strong><br />
Pietersberg 1 and <strong>the</strong> Pietersberg 2 Terraces appear to<br />
belong to <strong>the</strong> last <strong>of</strong> <strong>the</strong> Main Terraces (Van den Berg<br />
and Van Ho<strong>of</strong>, 2001). Thus, Pietersberg 2 is <strong>the</strong> youngest<br />
Main Terrace. We <strong>the</strong>refore question <strong>the</strong> validity <strong>of</strong><br />
<strong>the</strong> date given by Van den Berg (1996) for <strong>the</strong> age <strong>of</strong> <strong>the</strong><br />
Pietersberg Terrace. Along <strong>the</strong> Rhine and along <strong>the</strong><br />
Meuse upstream <strong>of</strong> Maastricht, paleomagnetic measurements<br />
on <strong>the</strong> youngest Main Terraces show normal<br />
polarization (see Van Balen et al., 2000). In addition, <strong>the</strong><br />
deposits in <strong>the</strong> <strong>Roer</strong> Valley Graben which can be<br />
correlated to <strong>the</strong> Pietersberg 2 Terrace based on tectono-morphological<br />
arguments (Van Balen et al., 2000)<br />
also show normal polarization (van Montfrans, 1971).<br />
The age <strong>of</strong> this terrace is <strong>the</strong>refore constrained by <strong>the</strong><br />
age <strong>of</strong> <strong>the</strong> paleomagnetic Matuyama–Brunhes boundary,<br />
which is 0.78 ka. However, <strong>the</strong> paleomagnetic<br />
data from <strong>the</strong> Pietersberg 2 level from South Limburg<br />
(Van den Berg, 1996; Van den Berg and Van Ho<strong>of</strong>,<br />
2001) is not in accordance with this scheme. We
R.F. Houtgast et al. / Tectonophysics 352 (2002) 295–315 301<br />
Fig. 5. Correlation in sou<strong>the</strong>rn Limburg <strong>of</strong> terraces with <strong>the</strong> ODP 667 d 18 O ocean record (Shackleton et al., 1990). Van den Berg (1996) age<br />
model and <strong>the</strong> age model used in this paper. After Van den Berg (1996).<br />
question <strong>the</strong>ir validity <strong>of</strong> <strong>the</strong>ir date particularly as <strong>the</strong><br />
Pietersberg Terrace correlates with well dated fluvial<br />
deposits in <strong>the</strong> <strong>Roer</strong> Valley Graben (Van Balen et al.,<br />
2000). In addition, assuming for it an age close to <strong>the</strong><br />
Matuyama–Brunhes boundary results in a more uniform<br />
distribution <strong>of</strong> terraces through time, and a<br />
straightforward correlation <strong>of</strong> terraces with <strong>the</strong> ocean<br />
oxygen isotope record (Shackleton et al., 1990), (see<br />
Fig. 5 and Table 1, age model this paper). Still, both age<br />
models will be used to calculate fault displacements.<br />
4. Methodology<br />
During this study, borehole records form <strong>the</strong> Dutch<br />
Geological Survey (TNO-NITG) were combined with<br />
new handcorings and vertical electric soundings. The<br />
advantage <strong>of</strong> handcorings is <strong>the</strong> accurate lithological<br />
description, <strong>the</strong>ir disadvantage is that it is only possible<br />
to determine <strong>the</strong> top <strong>of</strong> <strong>the</strong> coarse terrace<br />
deposits. The advantage <strong>of</strong> TNO-NITG core holes is<br />
that most <strong>of</strong> <strong>the</strong>m reached <strong>the</strong> base <strong>of</strong> <strong>the</strong> coarse<br />
terrace deposits and thus permit to map <strong>the</strong>ir top and<br />
base. Geo-electric surveys have <strong>the</strong> advantage <strong>of</strong> deep<br />
penetration, but <strong>the</strong>ir disadvantage is <strong>the</strong> dependence<br />
on a number <strong>of</strong> factors which influence <strong>the</strong> measurement<br />
and <strong>the</strong>ir interpretation, e.g. groundwater level<br />
and availability <strong>of</strong> nearby corings to calibrate <strong>the</strong> geoelectric<br />
measurement (Vandenberghe, 1982). The<br />
accuracy in determination <strong>of</strong> <strong>the</strong> top and base <strong>of</strong> <strong>the</strong><br />
coarse terrace deposits is less than in corings. Therefore,<br />
<strong>the</strong> geo-electric soundings play a supportive role,<br />
particularly for <strong>the</strong> determination <strong>of</strong> <strong>the</strong> base <strong>of</strong> <strong>the</strong><br />
coarse terrace deposits.<br />
In a first step, <strong>the</strong> faults in <strong>the</strong> study area were<br />
mapped, using topographic and geomorphological
302<br />
R.F. Houtgast et al. / Tectonophysics 352 (2002) 295–315<br />
maps, field observations and a DTM. Secondly, <strong>the</strong><br />
terrace stratigraphy was used to develop an accurate<br />
terrace map for each fault block. Finally, <strong>the</strong> elevation<br />
<strong>of</strong> <strong>the</strong> top and base <strong>of</strong> each terrace on <strong>the</strong> different<br />
fault blocks was determined, thus permitting <strong>the</strong><br />
calculation <strong>of</strong> <strong>the</strong> fault displacements along <strong>the</strong> individual<br />
faults.<br />
4.1. Location <strong>of</strong> <strong>the</strong> faults in <strong>the</strong> Sittard area<br />
Various maps showing <strong>the</strong> location <strong>of</strong> faults in <strong>the</strong><br />
study area have been published (e.g., Felder et al.,<br />
1989; TNO-NITG, 1999; Beerten et al., 1999). In <strong>the</strong><br />
field, tectonic scarps are evident as relatively steep<br />
slopes which extent over several kilometers. Based on<br />
a DTM <strong>of</strong> <strong>the</strong> area combined with field observations a<br />
new map <strong>of</strong> <strong>the</strong> faults was constructed (Fig. 6). The<br />
mapped faults divide <strong>the</strong> study area, southwest <strong>of</strong><br />
Sittard, into four tectonic blocks, namely <strong>the</strong> area<br />
nor<strong>the</strong>ast <strong>of</strong> <strong>the</strong> <strong>Feldbiss</strong> <strong>Fault</strong>, between <strong>the</strong> <strong>Feldbiss</strong><br />
<strong>Fault</strong> and <strong>the</strong> Geleen <strong>Fault</strong>, between <strong>the</strong> Geleen <strong>Fault</strong><br />
and <strong>the</strong> Heerlerheide <strong>Fault</strong> and southwest <strong>of</strong> <strong>the</strong><br />
Heerlerheide <strong>Fault</strong>. We assume that each fault block<br />
behaves as a tectonic entity. Smaller faults ( < 1 m)<br />
within <strong>the</strong> individual fault blocks cannot be distinguished<br />
from natural height variation <strong>of</strong> 1 m at <strong>the</strong> top<br />
<strong>of</strong> <strong>the</strong> terrace deposits (Van den Berg, 1996). South <strong>of</strong><br />
<strong>the</strong> Heerlerheide <strong>Fault</strong>, we were unable to collect<br />
enough data because <strong>the</strong> younger terraces have no<br />
or only small terrace remnants in that area, and<br />
because <strong>of</strong> built areas. The contribution <strong>of</strong> <strong>the</strong> Heerlerheide<br />
<strong>Fault</strong> to <strong>the</strong> total displacement <strong>of</strong> <strong>the</strong> <strong>Feldbiss</strong><br />
<strong>Fault</strong> <strong>Zone</strong> will be addressed in <strong>the</strong> Discussion section.<br />
The fault configuration nor<strong>the</strong>ast <strong>of</strong> Sittard (older<br />
terraces) is different from <strong>the</strong> area west <strong>of</strong> Sittard<br />
(younger terraces, Fig. 6). East Of Sittard, we divide<br />
<strong>the</strong> area into three tectonic blocks, namely north <strong>of</strong> <strong>the</strong><br />
NE-Main <strong>Fault</strong>, between <strong>the</strong> NE-Main fault and <strong>the</strong><br />
<strong>Feldbiss</strong> <strong>Fault</strong> and South <strong>of</strong> <strong>the</strong> <strong>Feldbiss</strong> <strong>Fault</strong>.<br />
4.2. Mapping <strong>the</strong> terraces<br />
The terrace deposits consists <strong>of</strong> a coarse grained<br />
lower part (unit 1) and a finer grained upper part (unit 2).<br />
Fig. 6. Detailed map <strong>of</strong> <strong>the</strong> terraces and differences with <strong>the</strong> Van den Berg (1996) map. Dutch reference system coordinates (Rijks Driehoeks<br />
Meting).
R.F. Houtgast et al. / Tectonophysics 352 (2002) 295–315 303<br />
The boundary between <strong>the</strong> sandy Tertiary deposits and<br />
<strong>the</strong> lower terrace deposits (unit 1) is in most cases easy<br />
to recognize in core holes and geo-electric soundings.<br />
The transition between unit 1 and <strong>the</strong> overlying finergrained<br />
unit 2 is also easily recognized in corings. Due<br />
to <strong>the</strong> gradual transitions, <strong>the</strong> boundary between <strong>the</strong><br />
fine-grained unit 2 and <strong>the</strong> overlying sandy loess cover<br />
is <strong>of</strong>ten difficult to pinpoint in (hand) corings. In this<br />
paper, <strong>the</strong> base <strong>of</strong> <strong>the</strong> terrace deposits refers to <strong>the</strong> base<br />
<strong>of</strong> <strong>the</strong> coarse unit 1, whereas <strong>the</strong> top <strong>of</strong> <strong>the</strong> terrace<br />
deposits refers to top <strong>of</strong> unit 1.<br />
In order to map <strong>the</strong> position <strong>of</strong> <strong>the</strong> terrace borders<br />
on <strong>the</strong> individual fault blocks we constructed geological<br />
sections parallel to <strong>the</strong>ir bounding NW–SEoriented<br />
faults (Figs. 7 and 9), applying <strong>the</strong> following<br />
three criteria: (1) Terrace scarps paralleling <strong>the</strong> river<br />
Meuse have a clear expression, particularly on <strong>the</strong><br />
younger terraces (Geistingen, Eisden-Lanklaar). By<br />
contrast <strong>the</strong> morphological expression <strong>of</strong> <strong>the</strong> older<br />
terraces is less clear due to <strong>the</strong>ir masking loess cover<br />
and erosion <strong>of</strong> <strong>the</strong> scarps (Zonneveld, 1974). (2)<br />
Abrupt depth changes in <strong>the</strong> top <strong>of</strong> unit 1, which<br />
forms a very distinct marker. However, one must<br />
realize that <strong>the</strong> top unit 1 has <strong>of</strong>ten been disrupted<br />
by post depositional gully erosion (Van den Berg,<br />
1996). (3) Abrupt depth changes <strong>of</strong> <strong>the</strong> base <strong>of</strong> unit 1,<br />
which is clearly recognizable in core holes and geoelectric<br />
measurements. However, natural height variations<br />
<strong>of</strong> several meters are evident at <strong>the</strong> base <strong>of</strong> unit<br />
1 (Van den Berg, 1996).<br />
5. Results<br />
It is beyond <strong>the</strong> scope <strong>of</strong> this paper to discuss <strong>the</strong><br />
resulting pr<strong>of</strong>iles in detail. However, some features <strong>of</strong><br />
Fig. 7. Location <strong>of</strong> geological sections parallel to <strong>the</strong> faults (Fig. 8) and <strong>the</strong> location <strong>of</strong> <strong>the</strong> interpreted seismic sections (Fig. 3). For legend, see<br />
Fig. 6.
304<br />
R.F. Houtgast et al. / Tectonophysics 352 (2002) 295–315<br />
Fig. 8. Geological sections parallel to <strong>the</strong> faults. Based on corings and geo-electric soundings.
R.F. Houtgast et al. / Tectonophysics 352 (2002) 295–315 305<br />
Fig. 8 (continued).<br />
<strong>the</strong> pr<strong>of</strong>iles deserve attention. One prominent feature<br />
is <strong>the</strong> stacking <strong>of</strong> terrace deposits in pr<strong>of</strong>iles A, B and<br />
C. Older terrace deposits (probably deposits <strong>of</strong> <strong>the</strong><br />
Caberg 3 Terrace) underlie <strong>the</strong> younger terraces (Holocene<br />
floodplain, Geistingen and Eisden-Lanklaar<br />
Terraces; Beerten et al., 1999). The bases <strong>of</strong> <strong>the</strong> coarse<br />
deposits <strong>of</strong> <strong>the</strong>se terraces are located at about <strong>the</strong> same<br />
elevation. The pr<strong>of</strong>iles are located on different fault
306<br />
R.F. Houtgast et al. / Tectonophysics 352 (2002) 295–315<br />
Fig. 8 (continued).
R.F. Houtgast et al. / Tectonophysics 352 (2002) 295–315 307<br />
Table 2<br />
Average height [m NAP] <strong>of</strong> <strong>the</strong> base and top <strong>of</strong> <strong>the</strong> terrace deposits on each tectonic block<br />
Terrace<br />
North <strong>of</strong> <strong>Feldbiss</strong> <strong>Fault</strong> Between <strong>Feldbiss</strong> Between Geleen and South <strong>of</strong> Heerlerheide<br />
Height r N<br />
and Geleen <strong>Fault</strong>s Heerlerheide <strong>Fault</strong>s <strong>Fault</strong><br />
Height r N Height r N Height r N<br />
Geistingen Top 29.9 0.8 9 31.7 0.6 10 32.4 1.0 7 n.d.<br />
Base 17.6 0.3 2 21.7 0.9 3 26.5 0.4 3 n.d.<br />
Eisden-Lanklaar Top 31.7 0.4 4 34.9 0.7 5 40.0 0.3 5 n.d.<br />
Base 19.2 0.2 2 24.9 1.2 2 34.5 1.2 2 n.d.<br />
Caberg 3 Top 32.9 0.4 5 39.7 0.7 5 46.5 0.6 3 n.d.<br />
Base 17.5 0.5 4 27.0 0.8 4 34.4 1.1 3 n.d.<br />
Caberg 2 Top 34.8 0.5 8 44.2 0.4 4 49.8 0.2 3 n.d.<br />
Base 19.1 1 33.2 0.8 4 38.6 0.6 2 n.d.<br />
Caberg 1 Top 38.6 0.4 5 48.6 0.3 3 53.4 0.1 2 54.7 0.1 3<br />
Base 20.9 0.6 4 38.0 0.6 3 37.3 1 47.3 1<br />
North <strong>of</strong> NE-main <strong>Fault</strong> Between <strong>Feldbiss</strong> South <strong>of</strong> <strong>Feldbiss</strong> <strong>Fault</strong><br />
and NE-main <strong>Fault</strong>s<br />
Pietersberg 1 Top 52.5 1 n.d. 95.0 1<br />
Base 49.0 1 n.d. 86.1 1<br />
Geertruid 3 Top n.d. n.d. 98.2 1<br />
Base 48.4 2.7 2 n.d. 96.4 0.4 2<br />
Geertruid 2 Top n.d. 73.2 1.6 3 104.1 1.6 3<br />
Base 39.9 1 66.6 1.8 2 91.8 1.4 5<br />
r = Standard deviation, N = Number <strong>of</strong> observations, n.d. = no data.<br />
The values given in this table could differ from <strong>the</strong> results given in <strong>the</strong> pr<strong>of</strong>iles <strong>of</strong> Fig. 8. In those pr<strong>of</strong>iles <strong>the</strong> terrace heights represent <strong>the</strong><br />
elevation at <strong>the</strong> location <strong>of</strong> <strong>the</strong> pr<strong>of</strong>ile, whereas <strong>the</strong> values given in this table are calculated with data from <strong>the</strong> whole fault block.<br />
blocks, with different tectonic regimes (Fig. 7). Pr<strong>of</strong>iles<br />
A and B are located in <strong>the</strong> <strong>Roer</strong> Valley Graben,<br />
which is a strong subsiding block. Pr<strong>of</strong>iles C and D<br />
are respectively located on <strong>the</strong> <strong>Feldbiss</strong>/Geleen <strong>Fault</strong><br />
Block and <strong>the</strong> Geleen/Heerlerheide <strong>Fault</strong> Block,<br />
which are moderate to minor (with respect to <strong>the</strong><br />
<strong>Roer</strong> Valley Graben) subsiding blocks. Because <strong>of</strong><br />
<strong>the</strong> strong subsiding nature <strong>of</strong> <strong>the</strong> <strong>Roer</strong> Valley Graben<br />
and <strong>the</strong> moderate subsiding nature <strong>of</strong> <strong>the</strong> <strong>Feldbiss</strong>/<br />
Geleen <strong>Fault</strong> Block, older terrace deposits underlie <strong>the</strong><br />
younger terraces. An additional cause for <strong>the</strong> decrease<br />
in incision <strong>of</strong> <strong>the</strong> younger terraces (Eisden-Lanklaar<br />
and Geistingen Terraces) could be <strong>the</strong> loss <strong>of</strong> <strong>the</strong><br />
Moselle tributary to <strong>the</strong> Meuse River during <strong>the</strong> <strong>Late</strong><br />
Saalian (Pissart et al., 1997; Van Balen et al., 2000).<br />
Decreasing <strong>the</strong> discharge <strong>of</strong> <strong>the</strong> Meuse river after <strong>the</strong><br />
formation <strong>of</strong> <strong>the</strong> Caberg 3 Terrace (Middle Saale) lead<br />
to <strong>the</strong> preservation <strong>of</strong> <strong>the</strong> Caberg 3 Terrace deposits<br />
beneath <strong>the</strong> younger terrace deposits. This stratigraphic<br />
superposition makes it difficult to establish<br />
<strong>the</strong> exact position <strong>of</strong> <strong>the</strong> boundaries between <strong>the</strong><br />
stacked terrace deposits. Section D (Fig. 8) is located<br />
on <strong>the</strong> Geleen/Heerlerheide <strong>Fault</strong> Block. Tertiary<br />
deposits underlie all terraces in this pr<strong>of</strong>ile, stacked<br />
terrace deposits are absent. Section E (Fig. 8) is<br />
located south <strong>of</strong> <strong>the</strong> Heerlerheide <strong>Fault</strong>. In <strong>the</strong> area<br />
<strong>of</strong> this pr<strong>of</strong>ile, <strong>the</strong> younger terraces are hardly preserved.<br />
In section C (Fig. 8), <strong>the</strong> large height difference<br />
between <strong>the</strong> Caberg 1 Terrace and <strong>the</strong> older Terraces<br />
deserves attention. It could possibly be <strong>the</strong> result <strong>of</strong> a<br />
N–S-oriented fault. On <strong>the</strong> geological map <strong>of</strong> <strong>the</strong> top<br />
<strong>of</strong> <strong>the</strong> pre-Permian (TNO-NITG, 1999), a N–S-oriented<br />
fault is situated near this location. However, at<br />
o<strong>the</strong>r locations in between <strong>the</strong> <strong>Feldbiss</strong> and Geleen<br />
<strong>Fault</strong>s we could not any find evidence for a N–Soriented<br />
fault that was active during <strong>the</strong> <strong>Quaternary</strong>.<br />
Additionally, <strong>the</strong> inferred displacement <strong>of</strong> more than<br />
30 m is too large for such a short (1 km) fault<br />
segment, making it <strong>the</strong> fault with <strong>the</strong> largest displacement<br />
in <strong>the</strong> area. An alternative explanation is that<br />
during <strong>the</strong> formation <strong>of</strong> <strong>the</strong> Caberg 1 Terrace <strong>the</strong> river<br />
was able to remove older terrace remnants (Ro<strong>the</strong>m 2,<br />
Ro<strong>the</strong>m 1 and ’s Gravenvoeren) at this location.<br />
The natural height variation <strong>of</strong> <strong>the</strong> base <strong>of</strong> <strong>the</strong><br />
terraces is several meters (Van den Berg, 1996). At
308<br />
R.F. Houtgast et al. / Tectonophysics 352 (2002) 295–315<br />
several locations along <strong>the</strong> pr<strong>of</strong>iles, <strong>the</strong> variation is<br />
even larger (e.g., pr<strong>of</strong>ile B, Caberg 2; pr<strong>of</strong>ile E,<br />
Caberg 2). This shows that <strong>the</strong> variation in <strong>the</strong> base<br />
<strong>of</strong> <strong>the</strong> terraces can be as large as 5–8 m. In general,<br />
<strong>the</strong> terrace heights in <strong>the</strong> pr<strong>of</strong>iles represent <strong>the</strong> elevation<br />
<strong>of</strong> <strong>the</strong> base <strong>of</strong> <strong>the</strong> terraces at <strong>the</strong> location <strong>of</strong> <strong>the</strong><br />
pr<strong>of</strong>ile, whereas <strong>the</strong> values given in Table 2 are<br />
calculated with data from <strong>the</strong> whole fault block. Thus,<br />
<strong>the</strong> values given in Table 2 could differ from <strong>the</strong><br />
results as shown in <strong>the</strong> pr<strong>of</strong>iles <strong>of</strong> Fig. 8.<br />
Additional data (hand corings, TNO-NITG corings<br />
and geo-electric soundings) located outside <strong>the</strong> pr<strong>of</strong>iles<br />
were used to determine <strong>the</strong> location <strong>of</strong> <strong>the</strong> terrace<br />
borders between <strong>the</strong> pr<strong>of</strong>iles. The new terrace map<br />
differs in several details from <strong>the</strong> terrace map <strong>of</strong> Van<br />
den Berg (1989) as indicated in Fig. 6. Most <strong>of</strong> <strong>the</strong>se<br />
differences occur north <strong>of</strong> <strong>the</strong> <strong>Feldbiss</strong> <strong>Fault</strong>. South <strong>of</strong><br />
<strong>the</strong> <strong>Feldbiss</strong> fault, <strong>the</strong>se differences between <strong>the</strong> two<br />
maps are minimal. The largest discrepancy is <strong>the</strong><br />
border between <strong>the</strong> Geistingen Terrace and Holocene<br />
floodplain. Large parts <strong>of</strong> <strong>the</strong> Holocene floodplain are<br />
now interpreted as forming a part <strong>of</strong> <strong>the</strong> Geistingen<br />
Terrace. Three arguments support our interpretation.<br />
(1) Difference in morphology between <strong>the</strong> two terraces.<br />
In our interpretation, <strong>the</strong> Holocene floodplain is<br />
characterized by a clear scroll bar morphology. In <strong>the</strong><br />
interpretation <strong>of</strong> Van den Berg, this distinct morphology<br />
is attributed to <strong>the</strong> Geistingen Terrace south <strong>of</strong> <strong>the</strong><br />
<strong>Feldbiss</strong> <strong>Fault</strong>. (2) The heights differ between <strong>the</strong> two<br />
terraces and a scarp occurs between <strong>the</strong> two terraces.<br />
(3) Analyses <strong>of</strong> <strong>the</strong> pollen record <strong>of</strong> <strong>the</strong> fill <strong>of</strong> a<br />
meander scar a few kilometers north <strong>of</strong> <strong>the</strong> <strong>Feldbiss</strong><br />
<strong>Fault</strong> revealed a Younger Dryas age (Van Nieuwpoort<br />
and Schokker, 1998), placing <strong>the</strong> abandonment <strong>of</strong> this<br />
system before or during <strong>the</strong> Younger Dryas.<br />
5.1. Height <strong>of</strong> terrace deposits on <strong>the</strong> different fault<br />
blocks<br />
<strong>Fault</strong>s divide <strong>the</strong> area west <strong>of</strong> Sittard into several<br />
tectonic blocks while <strong>the</strong> terrace borders subdivide<br />
<strong>the</strong>se blocks into individual terrace sections. The next<br />
step in our analysis was to calculate <strong>the</strong> average height<br />
<strong>of</strong> <strong>the</strong> top and base <strong>of</strong> <strong>the</strong> terrace deposits on each<br />
block. Theoretically, all <strong>the</strong> measurements on a terrace<br />
within one block should approximately yield <strong>the</strong> same<br />
elevation. However, some natural variations may be<br />
attributed to a depositional height variability <strong>of</strong> about<br />
1 m at <strong>the</strong> top <strong>of</strong> <strong>the</strong> coarse terrace deposits (Van den<br />
Berg, 1996), and to longitudinal gradients <strong>of</strong> <strong>the</strong><br />
terrace surface. Additional factors are gully erosion<br />
and inaccuracy in <strong>the</strong> height measurements in corings<br />
and in <strong>the</strong> determination <strong>of</strong> <strong>the</strong> top and base <strong>of</strong> unit 1<br />
in <strong>the</strong> corings. We made corrections for <strong>the</strong> latter (see<br />
below).<br />
Because <strong>of</strong> <strong>the</strong> height variability we expect some<br />
<strong>of</strong> <strong>the</strong> height measurements to deviate downwards. We<br />
assume that <strong>the</strong> highest points give <strong>the</strong> most accurate<br />
representation <strong>of</strong> <strong>the</strong> depositional height. Measurements<br />
which deviate too much ( > 1 m) from <strong>the</strong><br />
average height <strong>of</strong> each section were rejected. A<br />
distinction should be made between <strong>the</strong> older terraces<br />
(Pietersberg 1, 2, 3 and Geertruid 1, 2, 3) and <strong>the</strong><br />
younger terraces (Caberg 1, 2, 3, Eisden-Lanklaar, and<br />
Geistingen). The older terraces were subjected to<br />
erosion for a much longer time and <strong>the</strong>refore large<br />
parts <strong>of</strong> <strong>the</strong> terrace deposits are missing (Felder et al.,<br />
1989). Therefore, on a number <strong>of</strong> sections we were<br />
not able to determine <strong>the</strong> height <strong>of</strong> <strong>the</strong> top and/or base<br />
<strong>of</strong> <strong>the</strong> coarse terrace deposits. On <strong>the</strong> younger terraces,<br />
a complete stratigraphy is present at most places<br />
and <strong>the</strong> values are much more reliable. As mentioned<br />
above, <strong>the</strong> youngest terraces (Eisden-Lanklaar and<br />
Geistingen) are underlain by older terrace deposits<br />
(probably Caberg 3 Terrace deposits, see Fig. 8).<br />
Therefore, values for <strong>the</strong> base <strong>of</strong> <strong>the</strong> unit 1 terrace<br />
deposits on <strong>the</strong>se younger terraces should be regarded<br />
with caution. Table 2 gives <strong>the</strong> height <strong>of</strong> <strong>the</strong> base and<br />
<strong>the</strong> top <strong>of</strong> <strong>the</strong> terrace deposits on each tectonic block<br />
toge<strong>the</strong>r with <strong>the</strong> number <strong>of</strong> reliable observations and<br />
<strong>the</strong> standard deviation. A distinction was made<br />
between <strong>the</strong> area west and east <strong>of</strong> Sittard because <strong>of</strong><br />
difference in fault configuration between <strong>the</strong> two<br />
areas, see Fig. 2.<br />
Beerten et al. (1999) also investigated <strong>the</strong> height <strong>of</strong><br />
<strong>the</strong> base <strong>of</strong> several terraces on <strong>the</strong> Belgian and Dutch<br />
side <strong>of</strong> <strong>the</strong> Meuse River, but did not investigate <strong>the</strong><br />
height <strong>of</strong> <strong>the</strong> top <strong>of</strong> <strong>the</strong> terrace deposits. The result <strong>of</strong><br />
<strong>the</strong>ir investigation is given in Table 3 along with <strong>the</strong><br />
results <strong>of</strong> our study. In most cases <strong>the</strong> results <strong>of</strong> both<br />
investigations coincide within a margin <strong>of</strong> 2 m.<br />
However, <strong>the</strong>y differ significantly on <strong>the</strong> Geistingen<br />
Terrace in between <strong>the</strong> Geleen and <strong>Feldbiss</strong> <strong>Fault</strong>s.<br />
Beerten et al. (1999) used <strong>the</strong> terrace map <strong>of</strong> Van den<br />
Berg (1989) in <strong>the</strong> area <strong>of</strong> <strong>the</strong> Geistingen Terrace near<br />
<strong>the</strong> <strong>Feldbiss</strong> <strong>Fault</strong> <strong>Zone</strong>. This is exactly <strong>the</strong> area where
R.F. Houtgast et al. / Tectonophysics 352 (2002) 295–315 309<br />
Table 3<br />
Comparison between <strong>the</strong> heights <strong>of</strong> <strong>the</strong> base <strong>of</strong> <strong>the</strong> terrace deposits on <strong>the</strong> Dutch side <strong>of</strong> <strong>the</strong> Maas River found by Beerten et al. (1999) and this<br />
investigation<br />
Terrace<br />
Average heights (m NAP) <strong>of</strong> <strong>the</strong> base <strong>of</strong> <strong>the</strong> terrace deposits<br />
South <strong>of</strong> <strong>the</strong> Geleen <strong>Fault</strong> Between <strong>the</strong> Geleen and <strong>Feldbiss</strong> <strong>Fault</strong>s North <strong>of</strong> <strong>the</strong> <strong>Feldbiss</strong> <strong>Fault</strong><br />
This research Beerten et al. This research Beerten et al. This research Beerten et al.<br />
Holocene Floodplain n.d. F 27 n.d. F 16 17.0 F 16<br />
Geistingen 26.5 F 27 21.7 F 27 17.6 < 20<br />
Eisden-Lanklaar 34.5 F 35 24.9 F 27 19.2 < 20<br />
Caberg 3 34.4 F 35 27.0 F 27 17.5 < 20<br />
Caberg 2 38.6 F 40 33.2 F 33 19.1 < 20<br />
n.d. = no data.<br />
<strong>the</strong> largest adjustments to <strong>the</strong> Van den Berg terrace<br />
map were made (see Fig. 6). Moreover, Beerten et al.<br />
(1999) regards <strong>the</strong> area north <strong>of</strong> <strong>the</strong> Geleen <strong>Fault</strong> on<br />
this terrace as one fault block, not intersected by <strong>the</strong><br />
<strong>Feldbiss</strong> <strong>Fault</strong>. This could lead to different results.<br />
Therefore, we give preference to <strong>the</strong> results <strong>of</strong> our<br />
investigation at <strong>the</strong>se specific points.<br />
5.2. <strong>Fault</strong> displacements<br />
The height difference <strong>of</strong> <strong>the</strong> base and top <strong>of</strong> <strong>the</strong> unit<br />
1 terrace deposits across a fault is interpreted as<br />
resulting from a displacement along that fault. However,<br />
in order to calculate fault displacements accurately<br />
we have to take into account <strong>the</strong> longitudinal<br />
river gradient <strong>of</strong> <strong>the</strong> original terrace surface (Fig. 9).<br />
According to Van den Berg (1996), terrace surfaces<br />
have a gradient <strong>of</strong> about 0.75 m/km south <strong>of</strong> <strong>the</strong><br />
<strong>Feldbiss</strong> <strong>Fault</strong> <strong>Zone</strong>. The heights <strong>of</strong> <strong>the</strong> terrace deposits<br />
in <strong>the</strong> middle <strong>of</strong> adjacent blocks on <strong>the</strong> same terrace<br />
are approximately 1.2–1.6 km separated from each<br />
o<strong>the</strong>r. Therefore, we corrected each height difference<br />
across <strong>the</strong> faults with 1.0 m for <strong>the</strong> longitudinal<br />
gradient. In Fig. 10, <strong>the</strong> displacements <strong>of</strong> <strong>the</strong> base<br />
(Fig. 10a) and top (Fig. 10b) <strong>of</strong> <strong>the</strong> unit 1 terrace<br />
deposits along <strong>the</strong> individual faults are presented.<br />
We used two age models to date <strong>the</strong> fault displacements,<br />
<strong>the</strong> Van den Berg (1996) age model and an<br />
improved Van Balen et al. (2000) age model (Table 1).<br />
To date <strong>the</strong> displacement <strong>of</strong> <strong>the</strong> top <strong>of</strong> <strong>the</strong> coarse terrace<br />
deposits we used <strong>the</strong> age <strong>of</strong> <strong>the</strong> terrace as given by <strong>the</strong><br />
age models. For dating <strong>the</strong> displacement <strong>of</strong> <strong>the</strong> base <strong>of</strong><br />
<strong>the</strong> coarse terrace deposits, we use <strong>the</strong> age <strong>of</strong> <strong>the</strong><br />
adjacent older terrace as a maximum age (Fig. 11).<br />
This approach assumes that <strong>the</strong>re is a short time interval<br />
between <strong>the</strong> formation <strong>of</strong> two subsequent terraces,<br />
Fig. 9. Relation between height <strong>of</strong> <strong>the</strong> tectonic block, fault displacement and fluvial gradient.
310<br />
R.F. Houtgast et al. / Tectonophysics 352 (2002) 295–315<br />
Fig. 10. Displacement <strong>of</strong> <strong>the</strong> base (a) and top (b) <strong>of</strong> <strong>the</strong> terrace<br />
deposits along <strong>the</strong> individual faults <strong>of</strong> <strong>the</strong> <strong>Feldbiss</strong> <strong>Fault</strong> <strong>Zone</strong>. For<br />
legend, see Fig. 6.<br />
which corresponds to fast river incision followed by<br />
slow aggradation as proposed in models <strong>of</strong> fluvial<br />
terrace development (e.g., Vandenberghe, 1993).<br />
In Fig. 12 (left), <strong>the</strong> results <strong>of</strong> our study are<br />
presented as displacements both at <strong>the</strong> top and <strong>the</strong><br />
base <strong>of</strong> <strong>the</strong> terrace deposits as a function <strong>of</strong> location<br />
along <strong>the</strong> fault, showing <strong>the</strong> lateral variability in fault<br />
<strong>activity</strong> along <strong>the</strong> individual faults (Geleen and <strong>Feldbiss</strong><br />
<strong>Fault</strong>s). The average fault displacement rate since<br />
<strong>the</strong> formation <strong>of</strong> <strong>the</strong> terrace is given for <strong>the</strong> locations<br />
indicated in Fig. 10a and b. It varies between 0.009 and<br />
0.034 mm a<br />
1 along <strong>the</strong> Geleen <strong>Fault</strong> and between<br />
0.017 and 0.031 mm a<br />
1 along <strong>the</strong> <strong>Feldbiss</strong> <strong>Fault</strong>. We<br />
reject <strong>the</strong> value <strong>of</strong> 0.073 mm a<br />
1 , based on <strong>the</strong><br />
displacement <strong>of</strong> <strong>the</strong> base <strong>of</strong> <strong>the</strong> Geistingen Terrace,<br />
as <strong>the</strong> inaccuracy (several meters, see above) in determination<br />
<strong>of</strong> <strong>the</strong> base <strong>of</strong> <strong>the</strong> Geistingen Terrace is too<br />
large in comparison with <strong>the</strong> displacement (0.8 m).<br />
Fig. 13 shows <strong>the</strong> displacement as a function <strong>of</strong><br />
time for <strong>the</strong> <strong>Feldbiss</strong> <strong>Fault</strong> <strong>Zone</strong> as a whole (Heerlerheide,<br />
Geleen and <strong>Feldbiss</strong> <strong>Fault</strong>s), using <strong>the</strong> two age<br />
models. It gives an indication <strong>of</strong> fault <strong>activity</strong> for <strong>the</strong><br />
<strong>Feldbiss</strong> <strong>Fault</strong> <strong>Zone</strong> from <strong>the</strong> Middle Pleistocene up to<br />
<strong>the</strong> present. In Fig. 13, we used <strong>the</strong> most reliable<br />
measurements, e.g. <strong>the</strong> displacement at <strong>the</strong> top <strong>of</strong> <strong>the</strong><br />
terrace deposits for <strong>the</strong> younger terraces (Geistingen<br />
and Eisden-Lanklaar) and <strong>the</strong> displacement in <strong>the</strong> base<br />
<strong>of</strong> <strong>the</strong> terrace deposits for <strong>the</strong> older terraces (Caberg 1,<br />
2 and 3, Pietersberg 1, Geertruid 2 and 3). The<br />
average fault displacement rate since <strong>the</strong> Middle<br />
Pleistocene for <strong>the</strong> <strong>Feldbiss</strong> <strong>Fault</strong> <strong>Zone</strong> is 0.041 mm<br />
a<br />
1 , using <strong>the</strong> Van den Berg (1996) age model and<br />
0.047 mm a<br />
1 , using <strong>the</strong> improvement <strong>of</strong> <strong>the</strong> Van<br />
Balen et al. (2000) age model. These displacement<br />
rates are <strong>of</strong> <strong>the</strong> same order <strong>of</strong> magnitude as displacement<br />
rates found by o<strong>the</strong>r studies on <strong>the</strong> <strong>Roer</strong> Valley<br />
Rift System (Paulissen et al., 1985; Van den Berg,<br />
1996; Camelbeeck and Meghraoui, 1998).<br />
The individual faults show temporal and spatial<br />
variation in fault <strong>activity</strong> (Fig. 12). However, it is<br />
difficult to separate <strong>the</strong> temporal and spatial components,<br />
since <strong>the</strong> Geleen <strong>Fault</strong> is only active in <strong>the</strong><br />
western part <strong>of</strong> <strong>the</strong> study area. This is indicated by <strong>the</strong><br />
increase in displacements at both <strong>the</strong> base and top <strong>of</strong><br />
<strong>the</strong> terrace deposits along this fault towards <strong>the</strong> northwest,<br />
despite <strong>the</strong> fact that <strong>the</strong> terrace deposits become<br />
younger (Fig. 10). This is also clearly evident in <strong>the</strong><br />
morphology, as <strong>the</strong> Geleen <strong>Fault</strong> looses its morphological<br />
expression sou<strong>the</strong>ast <strong>of</strong> <strong>the</strong> Caberg 1 terrace.<br />
The displacements along <strong>the</strong> <strong>Feldbiss</strong> <strong>Fault</strong> at both <strong>the</strong><br />
base and top <strong>of</strong> <strong>the</strong> terrace deposits decrease as<br />
expected whereas <strong>the</strong> terraces become younger. Yet,<br />
at <strong>the</strong> Caberg 2 Terrace where <strong>the</strong> Geleen <strong>Fault</strong><br />
becomes active <strong>the</strong> <strong>activity</strong> <strong>of</strong> <strong>the</strong> <strong>Feldbiss</strong> <strong>Fault</strong><br />
decreases. However, Fig. 13 shows that <strong>the</strong> total<br />
displacement rate on <strong>the</strong> <strong>Feldbiss</strong> <strong>Fault</strong> <strong>Zone</strong> is constant<br />
at a rate <strong>of</strong> 0.041 or 0.047 mm a<br />
1 throughout
R.F. Houtgast et al. / Tectonophysics 352 (2002) 295–315 311<br />
Fig. 11. Using <strong>the</strong> terrace age model to date <strong>the</strong> base and top <strong>of</strong> <strong>the</strong> coarse terrace deposits. The age <strong>of</strong> <strong>the</strong> top <strong>of</strong> <strong>the</strong> coarse terrace deposits<br />
corresponds to <strong>the</strong> age <strong>of</strong> <strong>the</strong> terrace as given by <strong>the</strong> age model. The age <strong>of</strong> <strong>the</strong> base <strong>of</strong> <strong>the</strong> coarse terrace deposits corresponds to <strong>the</strong> age <strong>of</strong> <strong>the</strong><br />
adjacent older terrace as given by <strong>the</strong> age model. Levels <strong>of</strong> approximately <strong>the</strong> same age are indicated.<br />
<strong>the</strong> <strong>Late</strong> Pleistocene. These two observations indicate<br />
that <strong>the</strong> <strong>Feldbiss</strong> <strong>Fault</strong> <strong>Zone</strong> is a system <strong>of</strong> overstepping<br />
faults: in a northwestward direction extensional<br />
strain is transferred from <strong>the</strong> <strong>Feldbiss</strong> <strong>Fault</strong> to<br />
<strong>the</strong> Geleen <strong>Fault</strong>.<br />
5.3. Contribution <strong>of</strong> <strong>the</strong> Heerlerheide <strong>Fault</strong> to <strong>the</strong><br />
<strong>activity</strong> <strong>of</strong> <strong>the</strong> <strong>Feldbiss</strong> <strong>Fault</strong> <strong>Zone</strong><br />
We were not able to calculate <strong>the</strong> displacement <strong>of</strong> <strong>the</strong><br />
younger terraces along <strong>the</strong> Heerlerheide <strong>Fault</strong>. On a<br />
geo-electric pr<strong>of</strong>ile along <strong>the</strong> Meuse River Beerten et al.<br />
(1999) could not find evidence for <strong>activity</strong> <strong>of</strong> <strong>the</strong><br />
Heerlerheide <strong>Fault</strong>. Fur<strong>the</strong>r to <strong>the</strong> sou<strong>the</strong>ast <strong>the</strong> Heerlerheide<br />
<strong>Fault</strong> has displaced <strong>the</strong> deposits <strong>of</strong> <strong>the</strong> Caberg 1<br />
Terrace. It seems that <strong>activity</strong> along <strong>the</strong> Heerlerheide<br />
<strong>Fault</strong> diminishes towards <strong>the</strong> northwest. However, <strong>the</strong><br />
contribution <strong>of</strong> <strong>the</strong> Heerlerheide <strong>Fault</strong> <strong>Zone</strong> to <strong>the</strong><br />
displacement <strong>of</strong> <strong>the</strong> <strong>Feldbiss</strong> <strong>Fault</strong> <strong>Zone</strong> as a whole<br />
can be calculated. Van den Berg (1996) reconstructed<br />
<strong>the</strong> terrace gradients between Maastricht and <strong>the</strong> <strong>Roer</strong><br />
Valley Graben, and arrived at about <strong>the</strong> same value for<br />
all terraces. From his reconstruction, it is clear that<br />
terrace convergence is negligible on <strong>the</strong> South Limburg<br />
Block. The height difference between <strong>the</strong> Geertruid 3<br />
Terrace and <strong>the</strong> Holocene floodplain in <strong>the</strong> Maastricht<br />
area is 80 m. whereas <strong>the</strong> height difference between<br />
<strong>the</strong>se two terraces north <strong>of</strong> <strong>the</strong> <strong>Feldbiss</strong> <strong>Fault</strong> <strong>Zone</strong> is 23<br />
m. Because river pr<strong>of</strong>ile convergence is negligible, <strong>the</strong><br />
difference <strong>of</strong> 57 m is mainly caused by fault movements.<br />
We found a displacement since <strong>the</strong> formation <strong>of</strong><br />
<strong>the</strong> Geertruid Terrace <strong>of</strong> 52 m (see Fig. 13). This leaves
312<br />
R.F. Houtgast et al. / Tectonophysics 352 (2002) 295–315<br />
Fig. 12. Displacements along <strong>the</strong> <strong>Feldbiss</strong> and Geleen <strong>Fault</strong>s.<br />
5 m unaccounted for, for which <strong>the</strong> Heerlerheide <strong>Fault</strong><br />
is partly responsible. There are probably more small<br />
faults on <strong>the</strong> South Limburg Block. Therefore, we<br />
assume that since <strong>the</strong> Middle Pleistocene <strong>the</strong> Heerlerheide<br />
<strong>Fault</strong> contributed less <strong>the</strong>n 10% to <strong>the</strong> total<br />
displacement along <strong>the</strong> <strong>Feldbiss</strong> <strong>Fault</strong> <strong>Zone</strong>.<br />
6. Discussion<br />
6.1. <strong>Quaternary</strong> and present-day stress field and<br />
relation to fault movements<br />
Fig. 13. Displacement as a function <strong>of</strong> time for <strong>the</strong> <strong>Feldbiss</strong> <strong>Fault</strong><br />
<strong>Zone</strong>.<br />
Our results have revealed <strong>the</strong> occurrence <strong>of</strong> an<br />
overstepping fault system that can be explained in<br />
several ways. For example, it could represent a system<br />
<strong>of</strong> overstepping strike-slip faults. Strike-slip motions<br />
were proposed by Camelbeeck and Meghraoui (1998)
R.F. Houtgast et al. / Tectonophysics 352 (2002) 295–315 313<br />
and Van den Berg (1996) for faults <strong>of</strong> <strong>the</strong> <strong>Roer</strong> Valley<br />
Graben, based on <strong>the</strong> fault pattern, <strong>the</strong> occurrence <strong>of</strong><br />
possible pop-up and pull-apart structures, and earthquake<br />
focal mechanisms. However, <strong>the</strong>se authors<br />
disagree however on <strong>the</strong> sense <strong>of</strong> wrenching: Camelbeeck<br />
and Meghraoui (1998) suggest a left lateral<br />
strike-slip component for <strong>the</strong> Belgian part <strong>of</strong> <strong>the</strong><br />
<strong>Feldbiss</strong> <strong>Fault</strong> <strong>Zone</strong>, whereas Van den Berg (1996)<br />
argues that <strong>the</strong> <strong>Feldbiss</strong> and Peel Boundary <strong>Fault</strong><br />
<strong>Zone</strong>s have a right lateral strike-slip component.<br />
However, morphological- and structural geology data<br />
provide no hard evidence for strike-slip motions along<br />
<strong>the</strong> NW–SE-oriented faults (Houtgast, manuscript in<br />
preparation). In addition, <strong>the</strong> <strong>Quaternary</strong> faults in <strong>the</strong><br />
<strong>Roer</strong> Valley Graben represent reactivated Paleozoic<br />
wrench faults <strong>of</strong> late Variscan age or older (Houtgast<br />
and Van Balen, 2000). Therefore, <strong>the</strong> observed <strong>Quaternary</strong><br />
fault pattern is inherited and could not be<br />
directly related to <strong>the</strong> present-day stress field (Houtgast<br />
and Van Balen, 2000). The present-day maximum<br />
horizontal stress direction is NW–SE-oriented (Mun l-<br />
ller et al., 1992), and was established during <strong>the</strong><br />
middle and late Miocene (Bergerat, 1987; Hibsch et<br />
al., 1995; Becker, 1993). Based on earthquake focal<br />
mechanisms, Plenefisch and Bonjer (1997) showed<br />
that <strong>the</strong> vast majority <strong>of</strong> fault <strong>activity</strong> in <strong>the</strong> Lower<br />
Rhine Embayment is characterized by normal faulting.<br />
Thus, <strong>the</strong> maximum principal stress is vertical. In<br />
this stress system, <strong>the</strong> NW–SE striking faults, such as<br />
<strong>the</strong> <strong>Feldbiss</strong> and Peel Boundary <strong>Fault</strong> <strong>Zone</strong>s, are<br />
expected to move in a normal faulting mode. Therefore,<br />
in our view, <strong>the</strong> system <strong>of</strong> overstepping faults in<br />
<strong>the</strong> Sittard area represents a set <strong>of</strong> Paleozoic strike-slip<br />
faults reactivated as normal faults. However, we do<br />
not exclude strike-slip motions along faults with<br />
different orientations. For example, N–S-oriented<br />
fault lineaments have been found on satellite images<br />
by Sesören (1976), and in <strong>the</strong> topography by Van den<br />
Berg (1996) and Houtgast and Van Balen (2000).<br />
6.2. Fluvial development model <strong>of</strong> rapid incision and<br />
slow aggradation<br />
To date <strong>the</strong> fault displacements we assumed a<br />
model <strong>of</strong> rapid river incision followed by slow aggradation<br />
(e.g., Vandenberghe, 1993). This implies that<br />
on a 10-ka time scale <strong>the</strong> base <strong>of</strong> <strong>the</strong> coarse deposits<br />
<strong>of</strong> a terrace are approximately <strong>of</strong> <strong>the</strong> same age as <strong>the</strong><br />
top <strong>of</strong> <strong>the</strong> coarse terrace deposits on <strong>the</strong> adjacent older<br />
terrace (see Fig. 11): Incision takes only thousands <strong>of</strong><br />
years, whereas aggradation lasts for tens <strong>of</strong> thousands<br />
<strong>of</strong> years. On a 1- to 10-ka time scale, an individual<br />
fault moves centimeters to decimeters, whereas on a<br />
10- to 100-ka time scale <strong>the</strong> fault moves several<br />
meters. If one assumes a constant displacement rate<br />
along an individual fault, extending over several<br />
kilometers, <strong>the</strong> displacement <strong>of</strong> <strong>the</strong> base <strong>of</strong> a terrace<br />
should approximately equal <strong>the</strong> displacement at <strong>the</strong><br />
top <strong>of</strong> <strong>the</strong> older adjacent terrace. Fig. 12 (right) shows<br />
that, in fact, in most cases <strong>the</strong> displacement at <strong>the</strong> base<br />
<strong>of</strong> a terrace is slightly larger than that <strong>of</strong> <strong>the</strong> top <strong>of</strong> <strong>the</strong><br />
higher terrace. This suggests that <strong>the</strong> top <strong>of</strong> <strong>the</strong> terrace<br />
deposits were subjected to erosion. The displacement<br />
at <strong>the</strong> base <strong>of</strong> <strong>the</strong> terrace equals <strong>the</strong> displacement at<br />
<strong>the</strong> top <strong>of</strong> <strong>the</strong> older adjacent terrace within a meter.<br />
There are some exceptions: along <strong>the</strong> <strong>Feldbiss</strong> <strong>Fault</strong><br />
<strong>the</strong> displacement at <strong>the</strong> base <strong>of</strong> <strong>the</strong> Caberg 2 Terrace is<br />
significantly larger <strong>the</strong>n <strong>the</strong> displacement at <strong>the</strong> top <strong>of</strong><br />
<strong>the</strong> Caberg 1 Terrace. This may be due to strong<br />
erosion <strong>of</strong> <strong>the</strong> top <strong>of</strong> <strong>the</strong> Caberg 1 Terrace. Along <strong>the</strong><br />
Geleen fault in <strong>the</strong> middle <strong>of</strong> <strong>the</strong> investigated fault<br />
segment, <strong>the</strong> displacement at <strong>the</strong> base <strong>of</strong> <strong>the</strong> terrace is<br />
larger <strong>the</strong>n <strong>the</strong> displacement in <strong>the</strong> top <strong>of</strong> <strong>the</strong> adjacent<br />
older terraces. This can be explained by northwestwards<br />
increasing <strong>activity</strong> along <strong>the</strong> Geleen <strong>Fault</strong> (Fig.<br />
12, left). The base <strong>of</strong> <strong>the</strong> Eisden-Lanklaar Terrace and<br />
<strong>the</strong> top <strong>of</strong> <strong>the</strong> adjacent older Caberg 3 Terrace are 2<br />
km apart. In this case, <strong>the</strong> assumption <strong>of</strong> a constant<br />
fault displacement rate along <strong>the</strong> Geleen <strong>Fault</strong> over<br />
several kilometers is not correct.<br />
As in general <strong>the</strong> apparent displacement at <strong>the</strong> top<br />
<strong>of</strong> <strong>the</strong> terrace deposits is equal to or even less than <strong>the</strong><br />
displacement at <strong>the</strong> base <strong>of</strong> <strong>the</strong> next younger terrace.<br />
The time elapsed between <strong>the</strong> formation <strong>of</strong> <strong>the</strong>se two<br />
surfaces is probably short. Therefore, <strong>the</strong> model <strong>of</strong><br />
rapid fluvial incision followed by slow aggradation<br />
for <strong>the</strong> terrace formation appears to apply in this area.<br />
7. Conclusions<br />
Terrace deposits displaced by faults are very useful<br />
to locate and quantify fault <strong>activity</strong>, provided <strong>the</strong> age <strong>of</strong><br />
<strong>the</strong> terraces is known. However, <strong>the</strong> tops <strong>of</strong> <strong>the</strong> terrace<br />
deposits have been subjected to erosion and this could<br />
lead to an underestimation <strong>of</strong> <strong>the</strong> vertical fault displace-
314<br />
R.F. Houtgast et al. / Tectonophysics 352 (2002) 295–315<br />
ment. Correlation <strong>of</strong> <strong>the</strong> top <strong>of</strong> <strong>the</strong> terrace deposits<br />
across faults can cause problems. A terrace surface on<br />
<strong>the</strong> hanging wall will be lower <strong>the</strong>n on <strong>the</strong> footwall.<br />
However, an older terrace on <strong>the</strong> hanging wall can have<br />
<strong>the</strong> same height as a younger terrace on <strong>the</strong> footwall.<br />
This has to be taken into consideration when terrace<br />
stratigraphy is used to quantify fault <strong>activity</strong>.<br />
As <strong>the</strong> bases <strong>of</strong> <strong>the</strong> younger terrace deposits have<br />
similar fault displacements as <strong>the</strong> tops <strong>of</strong> <strong>the</strong> older<br />
terraces, <strong>the</strong> ages <strong>of</strong> <strong>the</strong>se horizons are apparently<br />
similar within a margin <strong>of</strong> several thousands <strong>of</strong> years.<br />
This implies that <strong>the</strong> duration <strong>of</strong> <strong>the</strong> fluvial incision<br />
phase is relatively short compared to <strong>the</strong> terrace<br />
formation phase.<br />
During <strong>the</strong> Middle and <strong>Late</strong> Pleistocene, <strong>the</strong> <strong>Feldbiss</strong><br />
<strong>Fault</strong> <strong>Zone</strong> had an average fault displacement rate<br />
<strong>of</strong> 0.041 or 0.047 mm a<br />
1 , depending on which age<br />
models is used. During <strong>the</strong> same time period individual<br />
faults <strong>of</strong> this fault zone (Heerlerheide, Geleen and<br />
<strong>Feldbiss</strong> <strong>Fault</strong>s) show fault displacement rates varying<br />
between 0.010 and 0.035 mm a<br />
1 . In <strong>the</strong> area<br />
between Sittard and <strong>the</strong> Meuse River, <strong>the</strong> contribution<br />
<strong>of</strong> <strong>the</strong> <strong>Feldbiss</strong> <strong>Fault</strong> to <strong>the</strong> total displacement <strong>of</strong> <strong>the</strong><br />
<strong>Feldbiss</strong> <strong>Fault</strong> <strong>Zone</strong> decreases towards <strong>the</strong> northwest,<br />
whereas in <strong>the</strong> same direction <strong>the</strong> contribution <strong>of</strong> <strong>the</strong><br />
Geleen <strong>Fault</strong> increases. Therefore, this part <strong>of</strong> <strong>the</strong><br />
<strong>Feldbiss</strong> <strong>Fault</strong> <strong>Zone</strong> is a system <strong>of</strong> overstepping faults.<br />
The overstepping faults are Paleozoic wrench faults,<br />
reactivated as normal faults.<br />
Acknowledgements<br />
The study presented in this paper is a contribution<br />
to <strong>the</strong> NEESDI (Ne<strong>the</strong>rlands Environmental Earth<br />
System Initiative) program, funded by <strong>the</strong> Ne<strong>the</strong>rlands<br />
Organization for Scientific Research (NWO). We<br />
thank Drs. W. Westerh<strong>of</strong>f <strong>of</strong> <strong>the</strong> TNO-NITG for his<br />
cooperation. Pr<strong>of</strong>. Dr. J. Vandenberghe, Dr. C. Kasse,<br />
Dr. F.W. van der Wateren, Drs. P.W. Bogaart and Drs.<br />
V. Bense for <strong>the</strong>ir discussions and constructive<br />
criticism.<br />
References<br />
Ahorner, L., 1962. Untersuchungen zur Quartären Bruchtektonik<br />
der Niederrheinischen Bucht. Eiszeitalter Ggw. 13, 24–105.<br />
Antoine, P., Lautridou, J.P., Laurent, M., 2000. Long-term fluvial<br />
archives in NW France: response <strong>of</strong> <strong>the</strong> Seine and Somme rivers<br />
to tectonic movements, climatic variations and sea-level changes.<br />
Geomorphology 33, 183–207.<br />
Becker, A., 1993. An attemp to define a ‘‘neotectonic period’’ for<br />
central and nor<strong>the</strong>rn Europe. Geol. Rundsch. 82, 67–83.<br />
Beerten, K., Brabers, P., Bosch, P., Gullentops, F., 1999. The passage<br />
<strong>of</strong> <strong>the</strong> <strong>Feldbiss</strong> Bundle through <strong>the</strong> Maas Valley. Aardkd.<br />
Meded. 9, 153–158.<br />
Bergerat, F., 1987. Stress fields in <strong>the</strong> European platform at <strong>the</strong> time<br />
<strong>of</strong> Africa –Eurasia collision. Tectonics 6 (2), 99–132.<br />
Brueren, J.W.R., 1945. Het terrassenlandschap van Zuid-Limburg.<br />
Meded. - Geol. Sticht., Ser. C VI. (1), 93 pp.<br />
Camelbeeck, T., Meghraoui, M., 1998. Geological and geophysical<br />
evidence for large palaeo-earthquakes with surface faulting in<br />
<strong>the</strong> <strong>Roer</strong> Graben (Northwest Europe). Geophys. J. Int. 132,<br />
347–362.<br />
Chen, Y.-G., Liu, T.-K., 2000. Holocene uplift and subsidence along<br />
an active tectonic margin, southwestern Taiwan. Quat. Sci. Rev.<br />
19, 923–930.<br />
Felder, W.M., Bosch, P.W., Bisschops, J.H., 1989. Geologische<br />
kaart van Zuid-Limburg en omgeving, schaal 1:50.000. Afzettingen<br />
van de Maas. Rijks Geologische Dienst, Haarlem.<br />
Geluk, M.C., Duin, E.J.Th., Dusar, M., Rijkers, R.H.B., Van den<br />
Berg, M.W., Van Rooijen, P., 1994. Stratigraphy and tectonics <strong>of</strong><br />
<strong>the</strong> <strong>Roer</strong> Valley Graben. Geol. Mijnbouw 73, 129–141.<br />
Hibsch, C., Jarrige, J.J., Cusginh, E.M., Mercier, J., 1995. Paleostress<br />
analysis, a contribution to <strong>the</strong> understanding <strong>of</strong> basin<br />
tectonics and geodynamic evolution. Example <strong>of</strong> <strong>the</strong> Permian/<br />
Cenozoic tectonics <strong>of</strong> Great Britain and geodynamic implications<br />
in western Europe. Tectonophysics 252, 103–136.<br />
Hou, J.-J., Han, M.-K., Han, H.-J., 1998. Geomorphological observations<br />
<strong>of</strong> active faults in <strong>the</strong> epicentral region <strong>of</strong> <strong>the</strong> Huaxian<br />
large earthquake in 1556 in Shaanxi Province, China. J. Struct.<br />
Geol. 20, 549–577.<br />
Houtgast, R.F., Van Balen, R.T., 2000. Neotectonics <strong>of</strong> <strong>the</strong> <strong>Roer</strong><br />
Valley Rift System, <strong>the</strong> Ne<strong>the</strong>rlands. Global Planet. Change<br />
27, 131–146.<br />
Huxtable, J., Aitken, J., 1985. Thermoluminescence dating results<br />
for <strong>the</strong> Palaeolithic site Maastricht –Belvédère. Meded. - Rijks<br />
Geol. Dienst 39, 41–44.<br />
Juvigné, E., Renard, F., 1992. Les terrasses de la Meuse de Liége à<br />
Maastricht. Ann. Soc. Géol. Belg. 115, 167–186.<br />
Krzyszkowski, D., Przybylski, B., Badura, J., 2000. The role <strong>of</strong><br />
neotectonics and glaciation on terrace formation along <strong>the</strong> Nysa<br />
Klodzka River in <strong>the</strong> Sudeten Mountains (southwestern Poland).<br />
Geomorphology 33, 149–166.<br />
Li, Y., Yang, J., Tan, L., Duan, F., 1999. Impact <strong>of</strong> tectonics on<br />
alluvial landforms in <strong>the</strong> Hexi Corridor, Northwest China. Geomorphology<br />
28, 299–308.<br />
Mun cher, H.J., 1986. Aspects <strong>of</strong> Loess and Loess-Derived Slope<br />
Deposits: an Experimental and Micromorphological Approach.<br />
Fysisch Geografisch en Bodemkundig Laboratorium, Universiteit<br />
van Amsterdam, Amsterdam, p. 267.<br />
Mun ller, B., Zoback, M.L., Fuchs, K., Mastin, L., Gregersen, S.,<br />
Pavoni, N., Stephansson, O., Ljunggren, C., 1992. Regional<br />
patterns <strong>of</strong> tectonic stress in Europe. J. Geophys. 43, 783–803.<br />
Paulissen, E., 1973. De morfologie en de Kwartairstratigrafie van de
R.F. Houtgast et al. / Tectonophysics 352 (2002) 295–315 315<br />
Maas vallei in Belgisch Limburg. Verh. K. Acad. Wet. Lett.<br />
Schone Kunsten Belg., Klasse Wet. 35 (127), 1 – 266.<br />
Paulissen, E., Vandenberghe, J., Gullentops, F., 1985. The <strong>Feldbiss</strong><br />
fault in <strong>the</strong> Maas valley bottom (Limburg, Belgium). Geol.<br />
Mijnbouw 64, 79–87.<br />
Pissart, A., 1974. La Meuse en France et en Belgique. Formation du<br />
basin hydrographique. Les terrasses et leur enseignements. In:<br />
Macar, P. (Ed.), L’Évolution Quaternaire des Basins Fluviaux de<br />
la mer du Nord Mérondiale. Centenaire de la Société Géologique<br />
de Belgique, Liège, pp. 105–131.<br />
Pissart, A., Harmand, D., Krook, L., 1997. L’Évolution de la Meuse<br />
de Toul à Maastricht depuis le Miocène: corrélations chronologiques<br />
et traces des captures de la Meuse Lorraine d’après les<br />
minéraux denses. Geogr. Phys. Quat. 51, 267–284.<br />
Plenefisch, T., Bonjer, K.-P., 1997. The stress field in <strong>the</strong> Rhine<br />
Graben area inferred from earthquake focal mechanisms and<br />
estimation <strong>of</strong> frictional parameters. Tectonophysics 275, 71–97.<br />
Renson, V., Juvigné, E., Cordy, J.-M., 1999. Découverte en faveur<br />
d’une révision de la chronologie du Quaternaire: la grotte de La<br />
Belle-Roche (Belgique); hypothèse nouvelle concernant l’ancienneté<br />
de l’Homme en Europe du Nord-Ouest. C. R. Acad.<br />
Sci. Paris, Sci. Terre Planèteres/Earth and Planetary Sciences<br />
328, 635–640.<br />
Shackleton, N.J., Berger, A., Peltier, W.R., 1990. An alternative<br />
astronomical calibration <strong>of</strong> <strong>the</strong> Lower Pleistocene timescale<br />
based on ODP Site 677. Trans. R. Soc. Edinburgh: Earth Sci.<br />
81, 251–261.<br />
Sesören, A., 1976. Lineament analysis from ERTS (Landsat) images<br />
<strong>of</strong> <strong>the</strong> Ne<strong>the</strong>rlands. Geol. Mijnbouw 55, 61–67.<br />
TNO-NITG, 1999. Toelichting bij kaartblad XV Sittard-Maastricht.<br />
Nederlands instituut voor Toegepaste Geowetenschappen TNO,<br />
Utrecht, 127 pp.<br />
Van Balen, R.T., Houtgast, R.F., Van der Wateren, F.M., Vandenberghe,<br />
J., Bogaart, P.W., 2000. Sediment budget and<br />
tectonic evolution <strong>of</strong> <strong>the</strong> Meuse catchment in <strong>the</strong> Ardennes<br />
and <strong>the</strong> <strong>Roer</strong> Valley Rift System. Global Planet. Change 27,<br />
113–129.<br />
Van den Berg, M.W., 1989. Geomorfologische Kaart van Nederland<br />
1:50.000 Kaartblad 59 Genk, 60 Sittard, 61 Maastricht, 62 Heerlen,<br />
met toelichting en de Kaart Maasterrassen en Hellingklassen.<br />
Staring Centrum, Wageningen en Rijks Geologische Dienst,<br />
Haarlem, 32 pp.<br />
Van den Berg, M.W., 1996. Fluvial sequences <strong>of</strong> <strong>the</strong> Maas, a 10 Ma<br />
record <strong>of</strong> neotectonics and climate change at various timescales.<br />
PhD <strong>the</strong>sis, Universiteit Wageningen, 181 pp.<br />
Van den Berg, M.W., Van Ho<strong>of</strong>, T., 2001. The Maas terrace sequence<br />
at Maastricht, SE Ne<strong>the</strong>rlands: evidence for 200 m <strong>of</strong><br />
late Neogene and <strong>Quaternary</strong> surface uplift. In: Maddy, D.,<br />
Macklin, M.G., Woodward, J.C. (Eds.), River Basin Sediment<br />
Systems: Archives <strong>of</strong> Environmental Change. A.A. Balkema<br />
Publishers, Lisse, pp. 45–86.<br />
Van Kolfschoten, T., Roebroeks, W., Vandenberghe, J., 1993. The<br />
Middle and <strong>Late</strong> Pleistocene sequence at Maastricht–Belvédère:<br />
<strong>the</strong> type locality <strong>of</strong> <strong>the</strong> Belvédère Interglacial. Meded. - Rijks<br />
Geol. Dienst, Niewe Ser. 47, 81–91.<br />
Van Montfrans, H.M., 1971. Paleomagnetic dating in <strong>the</strong> North Sea<br />
Basin. Thesis, Amsterdam, 133 pp.<br />
Van Nieuwpoort, I.L., Schokker, J., 1998. Rivierevolutie op verschillende<br />
tijdschalen. De ontwikkeling van het midden-Limburgse<br />
Maasdal vanaf het Cromeriën tot heden onder invloed<br />
van klimaat, tektoniek en de mens. Internal report, Faculteit der<br />
Aardwetenschappen, Vrije Universiteit Amsterdam, 107 pp.<br />
Van Rummelen, F.H., 1942. De Maasterrassen van S.-Limburg en<br />
hunne wordingsgeschiedenis, Idem, pp. 85–108.<br />
Vandenberghe, J., 1982. Geo-electric investigations <strong>of</strong> a fault system<br />
in <strong>Quaternary</strong> deposits. Geophys. Prospect. 30, 879–897.<br />
Vandenberghe, J., 1993. River terrace development and its relation<br />
to climate: <strong>the</strong> Saalian Caberg terrace <strong>of</strong> <strong>the</strong> Maas river near<br />
Maastricht (The Ne<strong>the</strong>rlands). Meded. - Rijks Geol. Dienst 47,<br />
19–24.<br />
Ziegler, P.A., 1992. European Cenozoic rift system. Tectonophysics<br />
208, 91–111.<br />
Zijerveld, L., Stephenson, R., Cloetingh, S., Duin, E., Van den Berg,<br />
M.W., 1992. Subsidence analysis and modelling <strong>of</strong> <strong>the</strong> <strong>Roer</strong><br />
Valley Graben (SE Ne<strong>the</strong>rlands). Tectonophysics 208, 159–<br />
171.<br />
Zonneveld, J.I.S., 1974. The terraces <strong>of</strong> <strong>the</strong> Maas (and Rhine)<br />
downstream <strong>of</strong> Maastricht. L’Évolution Quartenaire des Bassins<br />
Fluviaux de la Mer du Nord Meridionale. Centenaire de la Société<br />
Géologique de Belgique, Liège, pp. 133–157.