

Connected-Farmers
Connected-Farmers
Connected-Farmers

Create successful ePaper yourself
Turn your PDF publications into a flip-book with our unique Google optimized e-Paper software.
Appendix 2<br />
Data assumptions<br />
and modelling<br />
Data limitations<br />
Given the type and origin of content, data was often limited in<br />
its availability and robustness.<br />
Where possible, data points were sourced from internationally<br />
recognised bodies. In some instances, where data gaps were<br />
identified or specific country data was unavailable, then<br />
informed assumptions were taken to fill these gaps.<br />
Data points used to calculate service adoption rates and<br />
livelihood benefits were developed using benchmarks from<br />
identified case studies or interview data.<br />
Data collection methodology<br />
Key data points were collected from available sources and<br />
assumptions made to address data gaps and project key data<br />
points to 2020.<br />
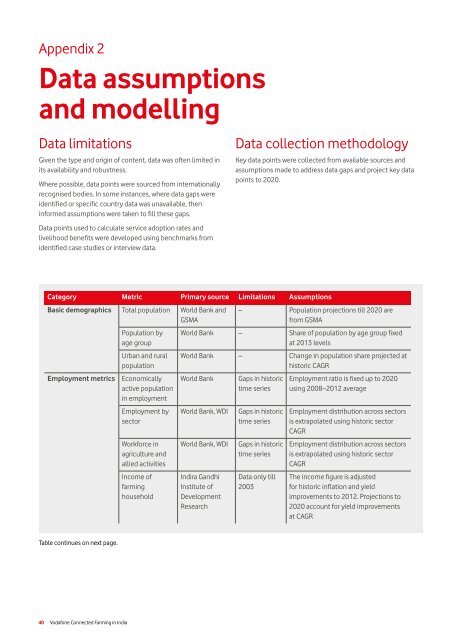
Category Metric Primary source Limitations Assumptions<br />
Basic demographics Total population World Bank and<br />
GSMA<br />
Employment metrics<br />
Population by<br />
age group<br />
Urban and rural<br />
population<br />
Economically<br />
active population<br />
in employment<br />
Employment by<br />
sector<br />
Workforce in<br />
agriculture and<br />
allied activities<br />
Income of<br />
farming<br />
household<br />
– Population projections till 2020 are<br />
from GSMA<br />
World Bank – Share of population by age group fixed<br />
at 2013 levels<br />
World Bank – Change in population share projected at<br />
historic CAGR<br />
World Bank<br />
World Bank, WDI<br />
World Bank, WDI<br />
Indira Gandhi<br />
Institute of<br />
Development<br />
Research<br />
Gaps in historic<br />
time series<br />
Gaps in historic<br />
time series<br />
Gaps in historic<br />
time series<br />
Data only till<br />
2003<br />
Employment ratio is fixed up to 2020<br />
using 2008–2012 average<br />
Employment distribution across sectors<br />
is extrapolated using historic sector<br />
CAGR<br />
Employment distribution across sectors<br />
is extrapolated using historic sector<br />
CAGR<br />
The income figure is adjusted<br />
for historic inflation and yield<br />
improvements to 2012. Projections to<br />
2020 account for yield improvements<br />
at CAGR<br />
Table continues on next page.<br />
40 Vodafone <strong>Connected</strong> Farming in India