The Cluster Initiative Greenbook
The Cluster Initiative Greenbook
The Cluster Initiative Greenbook

You also want an ePaper? Increase the reach of your titles
YUMPU automatically turns print PDFs into web optimized ePapers that Google loves.
28<br />
68<br />
4 44 6<br />
2<br />
14<br />
4<br />
20<br />
1<br />
1<br />
1<br />
13<br />
32<br />
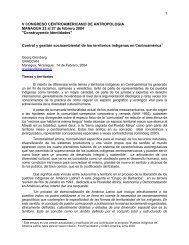
Figure 21<br />
Geographic breakdown of<br />
respondents<br />
Number of respondents per country<br />
or (for Europe and Western Asia) region<br />
as in Figure 20<br />
Source: GCIS 2003<br />
Demography and response rates<br />
Geographically, the respondents are concentrated in Europe, North America, New<br />
Zealand, Australia, and Japan. (See Figures 20 and 21.) This is the result of these regions<br />
receiving the largest number of invitations, which in turn is partly the result of<br />
cluster initiatives most frequently occurring in these regions. However, as noted in the<br />
box below, Asia and South America are clearly under-represented, possibly because of<br />
language issues.<br />
<strong>The</strong> overall response rate was surprisingly high, 47%, but this number varied considerably<br />
across regions. Northern Europe, Australia and New Zealand, and Japan had<br />
an above average response rate, increasing their share of the respondents further, whereas<br />
Western Europe, North America and Central America had below average response<br />
rates.<br />
Number of responding CIs per country<br />
New Zealand ................ 32 Sweden .......................... 11 Canada .............................. 4<br />
United States.................. 28 Germany ....................... 10 Norway ............................. 4<br />
United Kingdom .......... 25 Belgium ............................8 Cyprus ............................... 2<br />
Japan ............................... 20 Denmark ..........................8 Estonia .............................. 2<br />
Australia .......................... 13 France ...............................5 Mongolia........................... 2<br />
Austria............................. 13 Hungary ............................5 Turkey................................ 2<br />
Spain ............................... 13 Netherlands......................5 Other * ............................ 10<br />
Finland ............................ 11 Cross-border ...................5<br />
Table 1<br />
Number of CIs per country<br />
Source: GCIS 2003<br />
* Chile, Iceland, Ireland, Italy, Latvia, Lithuania, Malaysia, Poland, South Africa and<br />
Switzerland each have one respondent.<br />
Ü were sent out by e-mail to individuals on all continents.<br />
<strong>The</strong> other source was our own primary research using the<br />
internet, cluster related reports and other publications.<br />
<strong>The</strong> process resulted in a list of 509 identified cluster initiatives.<br />
This constitutes just a fraction of all CIs in the world,<br />
but it is probably one of the more comprehensive lists of CIs<br />
currently in existence.<br />
Distributing the survey<br />
<strong>The</strong> 509 cluster initiatives were sent an e-mail inviting them to<br />
participate in the survey. <strong>The</strong> invitation was written in English<br />
and contained a link to an on-line survey in English.<br />
Respondents could fill in a part of survey and return later to<br />
fill in the rest. <strong>The</strong>y could also go back and review and update<br />
their responses. Those who filled in the whole survey in a<br />
single session took on average 31 minutes to complete the<br />
survey. <strong>The</strong> replies were supplied from 28 March to 23 April.<br />
Sample bias<br />
<strong>The</strong> sample of respondents contains several clear biases. First,<br />
CIs in Northern Europe are clearly over-represented since the<br />
research was conducted by Swedish staff having better access<br />
to information from this area. Second, CIs in areas with high<br />
Internet penetration are over-represented, because e-mail and<br />
the Internet were used as key search tools. Third, CIs in English<br />
speaking countries are over-represented, since the research<br />
was carried out by persons speaking English as their first<br />
foreign language and all correspondence was in English. This<br />
could explain, for example, why so few CIs in Latin America<br />
were identified.<br />
<strong>The</strong> <strong>Cluster</strong> <strong>Initiative</strong> <strong>Greenbook</strong> • 33