here - Shetland Islands Council
here - Shetland Islands Council
here - Shetland Islands Council

You also want an ePaper? Increase the reach of your titles
YUMPU automatically turns print PDFs into web optimized ePapers that Google loves.
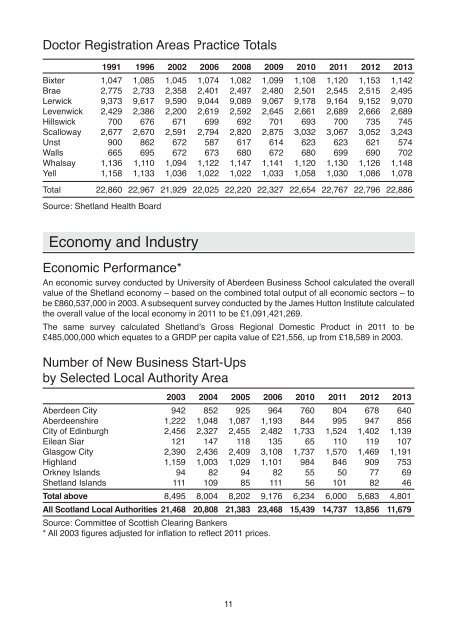
Doctor Registration Areas Practice Totals<br />
1991 1996 2002 2006 2008 2009 2010 2011 2012 2013<br />
Bixter 1,047 1,085 1,045 1,074 1,082 1,099 1,108 1,120 1,153 1,142<br />
Brae 2,775 2,733 2,358 2,401 2,497 2,480 2,501 2,545 2,515 2,495<br />
Lerwick 9,373 9,617 9,590 9,044 9,089 9,067 9,178 9,164 9,152 9,070<br />
Levenwick 2,429 2,386 2,200 2,619 2,592 2,645 2,661 2,689 2,666 2,689<br />
Hillswick 700 676 671 699 692 701 693 700 735 745<br />
Scalloway 2,677 2,670 2,591 2,794 2,820 2,875 3,032 3,067 3,052 3,243<br />
Unst 900 862 672 587 617 614 623 623 621 574<br />
Walls 665 695 672 673 680 672 680 699 690 702<br />
Whalsay 1,136 1,110 1,094 1,122 1,147 1,141 1,120 1,130 1,126 1,148<br />
Yell 1,158 1,133 1,036 1,022 1,022 1,033 1,058 1,030 1,086 1,078<br />
Total 22,860 22,967 21,929 22,025 22,220 22,327 22,654 22,767 22,796 22,886<br />
Source: <strong>Shetland</strong> Health Board<br />
Economy and Industry<br />
Economic Performance*<br />
An economic survey conducted by University of Aberdeen Business School calculated the overall<br />
value of the <strong>Shetland</strong> economy – based on the combined total output of all economic sectors – to<br />
be £860,537,000 in 2003. A subsequent survey conducted by the James Hutton Institute calculated<br />
the overall value of the local economy in 2011 to be £1,091,421,269.<br />
The same survey calculated <strong>Shetland</strong>’s Gross Regional Domestic Product in 2011 to be<br />
£485,000,000 which equates to a GRDP per capita value of £21,556, up from £18,589 in 2003.<br />
Number of New Business Start-Ups<br />
by Selected Local Authority Area<br />
2003 2004 2005 2006 2010 2011 2012 2013<br />
Aberdeen City 942 852 925 964 760 804 678 640<br />
Aberdeenshire 1,222 1,048 1,087 1,193 844 995 947 856<br />
City of Edinburgh 2,456 2,327 2,455 2,482 1,733 1,524 1,402 1,139<br />
Eilean Siar 121 147 118 135 65 110 119 107<br />
Glasgow City 2,390 2,436 2,409 3,108 1,737 1,570 1,469 1,191<br />
Highland 1,159 1,003 1,029 1,101 984 846 909 753<br />
Orkney <strong>Islands</strong> 94 82 94 82 55 50 77 69<br />
<strong>Shetland</strong> <strong>Islands</strong> 111 109 85 111 56 101 82 46<br />
Total above 8,495 8,004 8,202 9,176 6,234 6,000 5,683 4,801<br />
All Scotland Local Authorities 21,468 20,808 21,383 23,468 15,439 14,737 13,856 11,679<br />
Source: Committee of Scottish Clearing Bankers<br />
* All 2003 figures adjusted for inflation to reflect 2011 prices.<br />
11