UK Port Traffic, Bulk Fuel and Crude Oil Handling Ports 2012 Port Traffic ’000 % UK (foreign & domestic) Tonnes Traffic Grimsby & Immingham 60,091 12.3 London 43,742 8.9 Milford Haven 39,832 8.1 Southampton 38,107 7.8 Tees & Hartlepool 33,967 6.9 Liverpool 32,924 6.7 Felixstowe 26,269 5.4 Forth 25,332 5.2 Dover 22,902 4.7 Clyde 15,421 3.2 Belfast 15,186 3.1 Medway 12,649 2.6 Sullom Voe 11,398 2.3 Bristol 10,762 2.2 Rivers Hull and Humber 10,081 2.1 All major ports 489,450 100.0 Source: Maritime Statistics Branch, Department for Transport Sullom Voe Terminal: Oil Throughput – Tonnes 27 Oil & Gas Traffic ’000 % UK (foreign & domestic) Tonnes Traffic Milford Haven 39,054 19.6 Southampton 26,634 13.3 Grimsby & Immingham 21,926 11.0 Forth 20,603 10.3 Tees & Hartlepool 17,576 8.8 London 14,654 7.3 Liverpool 11,983 6.0 Sullom Voe 11,339 5.7 All major UK ports 199,691 100.0 ’000 % UK Crude Oil Tonnes Traffic Southampton 15,094 14.4 Milford Haven 14,069 13.4 Forth 13,816 13.2 Tees & Hartlepool 12,866 12.3 Sullom Voe 11,339 10.8 Liverpool 10,931 10.4 All major UK ports 105,028 100.0 1978 1981 1986 1991 2001 2006 2009 2011 2012 Brent Pipeline System 856,991 23,116,490 38,692,099 20,263,701 13,368,931 6,369,416 3,759,897 4,813,537 4,403,999 Ninian Pipeline System 92,186 15,545,240 16,875,047 15,576,512 5,994,252 4,525,451 2,427,968 2,168,138 1,692,999 Schiehallion – – – – 5,441,468 3,281,822 920,447 729,213 2,118,832 Clair – – – – – 1,244,317 2,708,161 1,615,874 893,416 Total 949,177 38,661,730 55,567,146 35,840,213 24,804,651 15,421,006 9,816,473 9,326,762 9,109,246 Sullom Voe Terminal: Barrels per Day 1978 1981 1986 1991 2001 2006 2009 2011 2012 Brent Pipeline System 177,526 478,094 800,134 419,864 277,732 131,859 77,875 99,474 90,429 Ninian Pipeline System 23,439 317,083 346,513 322,592 124,520 93,695 50,280 44,803 34,582 Schiehallion – – – – 110,966 62,933 17,636 13,962 42,754 Clair – – – – – 24,804 51,282 29,735 17,912 Total 200,965 795,177 1,146,647 742,456 513,218 313,291 197,074 187,974 185,678 Sullom Voe Terminal: Total Barrels 1978 1981 1986 2001 2006 2008 2009 2011 2012 Brent Pipeline System 6,390,951 174,504,301 292,048,824 101,372,220 48,128,671 32,021,815 28,424,425 36,307,877 33,276,230 Ninian Pipeline System 679,725 115,735,451 110,640,234 45,449,979 34,198,831 23,140,625 18,352,361 16,353,127 12,784,497 Schiehallion – – – 40,502,624 22,970,411 16,157,561 6,437,098 5,096,308 14,791,225 Clair – – – – 9,053,626 16,755,227 18,718,064 10,853,157 6,165,406 Total 7,070,676 290,239,752 371,062,957 187,324,823 114,351,539 88,075,228 71,931,948 68,610,469 67,017,358 Sullom Voe: Tankers Using Port 1979 1981 1986 1991 1996 2001 2006 2007 2008 2009 2010 2011 2012 Oil 270 432 654 423 395 295 199 193 183 144 149 131 155 Gas 0 0 112 45 32 12 11 6 3 4 3 0 0
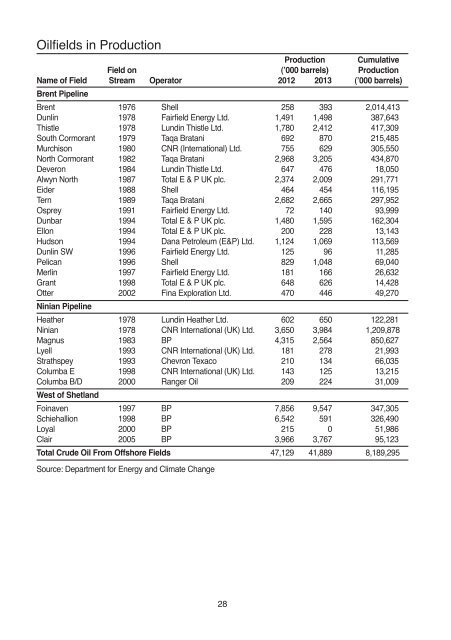
Oilfields in Production Production Cumulative Field on (’000 barrels) Production Name of Field Stream Operator 2012 2013 (’000 barrels) Brent Pipeline Brent 1976 Shell 258 393 2,014,413 Dunlin 1978 Fairfield Energy Ltd. 1,491 1,498 387,643 Thistle 1978 Lundin Thistle Ltd. 1,780 2,412 417,309 South Cormorant 1979 Taqa Bratani 692 870 215,485 Murchison 1980 CNR (International) Ltd. 755 629 305,550 North Cormorant 1982 Taqa Bratani 2,968 3,205 434,870 Deveron 1984 Lundin Thistle Ltd. 647 476 18,050 Alwyn North 1987 Total E & P UK plc. 2,374 2,009 291,771 Eider 1988 Shell 464 454 116,195 Tern 1989 Taqa Bratani 2,682 2,665 297,952 Osprey 1991 Fairfield Energy Ltd. 72 140 93,999 Dunbar 1994 Total E & P UK plc. 1,480 1,595 162,304 Ellon 1994 Total E & P UK plc. 200 228 13,143 Hudson 1994 Dana Petroleum (E&P) Ltd. 1,124 1,069 113,569 Dunlin SW 1996 Fairfield Energy Ltd. 125 96 11,285 Pelican 1996 Shell 829 1,048 69,040 Merlin 1997 Fairfield Energy Ltd. 181 166 26,632 Grant 1998 Total E & P UK plc. 648 626 14,428 Otter 2002 Fina Exploration Ltd. 470 446 49,270 Ninian Pipeline Heather 1978 Lundin Heather Ltd. 602 650 122,281 Ninian 1978 CNR International (UK) Ltd. 3,650 3,984 1,209,878 Magnus 1983 BP 4,315 2,564 850,627 Lyell 1993 CNR International (UK) Ltd. 181 278 21,993 Strathspey 1993 Chevron Texaco 210 134 66,035 Columba E 1998 CNR International (UK) Ltd. 143 125 13,215 Columba B/D 2000 Ranger Oil 209 224 31,009 West of <strong>Shetland</strong> Foinaven 1997 BP 7,856 9,547 347,305 Schiehallion 1998 BP 6,542 591 326,490 Loyal 2000 BP 215 0 51,986 Clair 2005 BP 3,966 3,767 95,123 Total Crude Oil From Offshore Fields 47,129 41,889 8,189,295 Source: Department for Energy and Climate Change 28