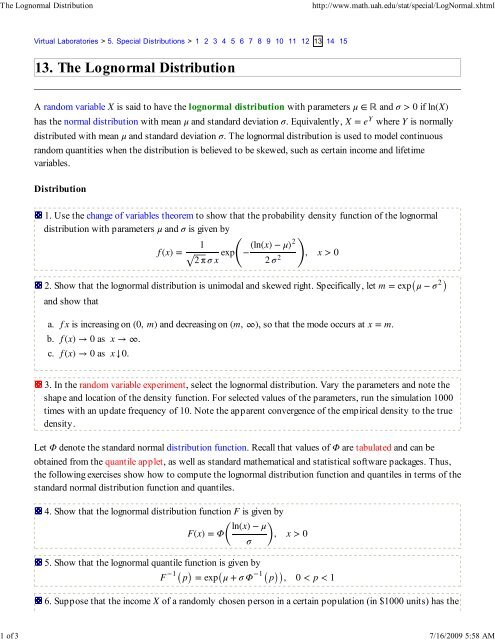
13. The Lognormal Distribution
13. The Lognormal Distribution
13. The Lognormal Distribution

Create successful ePaper yourself
Turn your PDF publications into a flip-book with our unique Google optimized e-Paper software.
<strong>The</strong> <strong>Lognormal</strong> <strong>Distribution</strong><br />
http://www.math.uah.edu/stat/special/LogNormal.xhtml<br />
1 of 3 7/16/2009 5:58 AM<br />
Virtual Laboratories > 5. Special <strong>Distribution</strong>s > 1 2 3 4 5 6 7 8 9 10 11 12 13 14 15<br />
<strong>13.</strong> <strong>The</strong> <strong>Lognormal</strong> <strong>Distribution</strong><br />
A random variable X is said to have the lognormal distribution with parameters μ ∈ R and σ > 0 if ln(X)<br />
has the normal distribution with mean μ and standard deviation σ. Equivalently, X = e Y where Y is normally<br />
distributed with mean μ and standard deviation σ. <strong>The</strong> lognormal distribution is used to model continuous<br />
random quantities when the distribution is believed to be skewed, such as certain income and lifetime<br />
variables.<br />
<strong>Distribution</strong><br />
1. Use the change of variables theorem to show that the probability density function of the lognormal<br />
distribution with parameters μ and σ is given by<br />
f (x) =<br />
1<br />
√ 2 π σ x exp − μ)2<br />
−(ln(x)<br />
( 2 σ 2 ) , x > 0<br />
2. Show that the lognormal distribution is unimodal and skewed right. Specifically, let m = exp(μ − σ 2 )<br />
and show that<br />
a.<br />
b.<br />
c.<br />
f x is increasing on ( 0, m)<br />
and decreasing on ( m, ∞)<br />
, so that the mode occurs at x = m.<br />
f (x) → 0 as x → ∞.<br />
f (x) → 0 as x↓0.<br />
3. In the random variable experiment, select the lognormal distribution. Vary the parameters and note the<br />
shape and location of the density function. For selected values of the parameters, run the simulation 1000<br />
times with an update frequency of 10. Note the apparent convergence of the empirical density to the true<br />
density.<br />
Let Φ denote the standard normal distribution function. Recall that values of Φ are tabulated and can be<br />
obtained from the quantile applet, as well as standard mathematical and statistical software packages. Thus,<br />
the following exercises show how to compute the lognormal distribution function and quantiles in terms of the<br />
standard normal distribution function and quantiles.<br />
4. Show that the lognormal distribution function F is given by<br />
F(x) = Φ (<br />
ln(x) − μ<br />
σ ) , x > 0<br />
5. Show that the lognormal quantile function is given by<br />
F −1 (p) = exp(μ + σ Φ −1 (p)), 0 < p < 1<br />
6. Suppose that the income X of a randomly chosen person in a certain population (in $1000 units) has the
<strong>The</strong> <strong>Lognormal</strong> <strong>Distribution</strong><br />
http://www.math.uah.edu/stat/special/LogNormal.xhtml<br />
2 of 3 7/16/2009 5:58 AM<br />
lognormal distribution with parameters μ = 2 and σ = 1. Find P(X > 20).<br />
7. In the quantile applet, select the lognormal distribution. Vary the parameters and note the shape and<br />
location of the density function and the distribution function. With μ = 0 and σ = 1, find the median and<br />
the first and third quartiles.<br />
Moments<br />
<strong>The</strong> moments of the lognormal distribution can be computed from the moment generating function of the<br />
normal distribution.<br />
8. Suppose that X has the lognormal distribution with parameters μ and σ. Show that<br />
(X n ) = exp (<br />
n μ + 1 2 n2 σ 2 ) , n ∈ N<br />
9. In particular, show that mean and variance of X are<br />
a.<br />
b.<br />
(X) = exp(μ + 1 2 σ 2 )<br />
var(X) = exp(2 (μ + σ 2 )) − exp(2 μ + σ 2 )<br />
Even though the lognormal distribution has finite moments of all orders, the moment generating function is<br />
infinite at any positive number. This property is one of the reasons for the fame of the lognormal distribution.<br />
10. Show that (e t X ) = ∞ for any t > 0.<br />
11. Suppose that the income X of a randomly chosen person in a certain population (in $1000 units) has<br />
the lognormal distribution with parameters μ = 2 and σ = 1. Find each of the following:<br />
a.<br />
b.<br />
(X)<br />
sd(X)<br />
12. In the simulation of the random variable experiment, select the lognormal distribution. Vary the<br />
parameters and note the shape and location of the mean/standard deviation bar. For selected values of the<br />
parameters, run the simulation 1000 times with an update frequency of 10. Note the apparent convergence<br />
of the empirical moments to the true moments.<br />
Transformations<br />
<strong>The</strong> most important transformations are the ones in the definition: if X has a lognormal distribution then ln(X)<br />
has a normal distribution; conversely if Y has a normal distribution then e Y has a lognormal distribution.
<strong>The</strong> <strong>Lognormal</strong> <strong>Distribution</strong><br />
http://www.math.uah.edu/stat/special/LogNormal.xhtml<br />
3 of 3 7/16/2009 5:58 AM<br />
<strong>13.</strong> For fixed σ, show that the lognormal distribution with parameters μ and σ is a scale family with scale<br />
parameter e μ .<br />
14. Show that the lognormal distribution is a 2-parameter exponential family with natural parameters and<br />
natural statistics, respectively, given by<br />
a.<br />
b.<br />
⎛<br />
⎝ − 1<br />
2 σ 2, μ<br />
σ 2 ⎞ ⎠<br />
(ln(X) 2 , ln(X))<br />
Virtual Laboratories > 5. Special <strong>Distribution</strong>s > 1 2 3 4 5 6 7 8 9 10 11 12 13 14 15<br />
Contents | Applets | Data Sets | Biographies | External Resources | Key words | Feedback | ©