6. The F Distribution
6. The F Distribution
6. The F Distribution
- No tags were found...

Create successful ePaper yourself
Turn your PDF publications into a flip-book with our unique Google optimized e-Paper software.
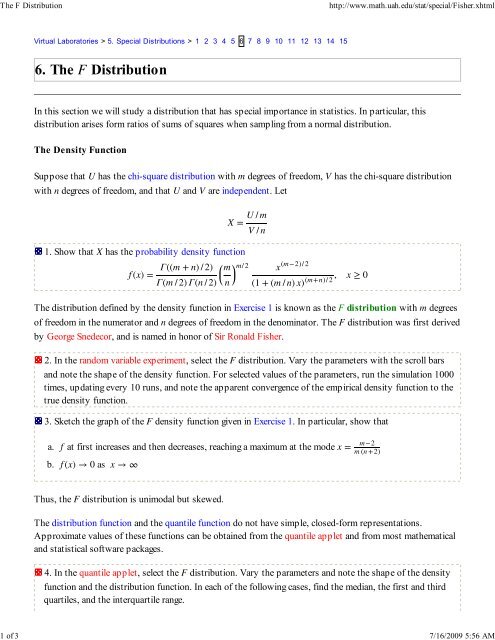
<strong>The</strong> F <strong>Distribution</strong>http://www.math.uah.edu/stat/special/Fisher.xhtml1 of 3 7/16/2009 5:56 AMVirtual Laboratories > 5. Special <strong>Distribution</strong>s > 1 2 3 4 5 6 7 8 9 10 11 12 13 14 15<strong>6.</strong> <strong>The</strong> F <strong>Distribution</strong>In this section we will study a distribution that has special importance in statistics. In particular, thisdistribution arises form ratios of sums of squares when sampling from a normal distribution.<strong>The</strong> Density FunctionSuppose that U has the chi-square distribution with m degrees of freedom, V has the chi-square distributionwith n degrees of freedom, and that U and V are independent. Let1. Show that X has the probability density functionΓ((m + n) / 2) ⎛f (x) =Γ(m / 2) Γ(n / 2) ⎝⎜ m ⎞n ⎠⎟X = U / mV / nm/ 2 x (m−2)/ 2(1 + (m / n) x) (m+n)/ 2 , x ≥ 0<strong>The</strong> distribution defined by the density function in Exercise 1 is known as the F distribution with m degreesof freedom in the numerator and n degrees of freedom in the denominator. <strong>The</strong> F distribution was first derivedby George Snedecor, and is named in honor of Sir Ronald Fisher.2. In the random variable experiment, select the F distribution. Vary the parameters with the scroll barsand note the shape of the density function. For selected values of the parameters, run the simulation 1000times, updating every 10 runs, and note the apparent convergence of the empirical density function to thetrue density function.3. Sketch the graph of the F density function given in Exercise 1. In particular, show thata.b.f at first increases and then decreases, reaching a maximum at the mode x =f (x) → 0 as x → ∞m−2m (n +2)Thus, the F distribution is unimodal but skewed.<strong>The</strong> distribution function and the quantile function do not have simple, closed-form representations.Approximate values of these functions can be obtained from the quantile applet and from most mathematicaland statistical software packages.4. In the quantile applet, select the F distribution. Vary the parameters and note the shape of the densityfunction and the distribution function. In each of the following cases, find the median, the first and thirdquartiles, and the interquartile range.
<strong>The</strong> F <strong>Distribution</strong>http://www.math.uah.edu/stat/special/Fisher.xhtml2 of 3 7/16/2009 5:56 AMa.b.c.d.m = 5, n = 5m = 5, n = 10m = 10, n = 5m = 10, n = 10MomentsSuppose that X has the F distribution with m degrees of freedom in the numerator and n degrees of freedom inthe denominator. <strong>The</strong> random variable representation in Exercise 1 can be used to find the mean, variance, andother moments.5. Show thata.b.(X) = ∞ if n ∈ ( 0,2]n(X) =n −2 if n ∈ ( 2,∞)Thus, the mean depends only on the degrees of freedom in the denominator.<strong>6.</strong> Show thata.b.c.var(X) is undefined if n ∈ ( 0,2]var(X) = ∞ if n ∈ ( 2,4]If n ∈ ( 2, ∞)thenvar(X) = 2 ⎛ ⎝ ⎜n ⎞2 m + n − 2n − 2⎠⎟m (n − 4)7. In the simulation of the random variable experiment, select the F distribution. Vary the parameters withthe scroll bar and note the size and location of the mean/standard deviation bar. For selected values of theparameters, run the simulation 1000 times, updating every 10 runs, and note the apparent convergence ofthe empirical moments to the true moments.8. Show thata.b.(X k ) = ∞ if n ∈ ( 0,2 k]If n ∈ ( 2 k, ∞)then(X k Γ((m + 2 k) / 2) Γ((n − 2 k) / 2) ⎛ n ⎞) =Γ(m / 2) Γ(n / 2) ⎝⎜m⎠⎟kTransformations
<strong>The</strong> F <strong>Distribution</strong>http://www.math.uah.edu/stat/special/Fisher.xhtml3 of 3 7/16/2009 5:56 AM9. Suppose that X has the F distribution with m degrees of freedom in the numerator and n degrees offreedom in the denominator. Show that 1 has the F distribution with n degrees of freedom in the numeratorXand m degrees of freedom in the denominator.10. Suppose that T has the t distribution with n degrees of freedom. Show that X = T 2 has the Fdistribution with 1 degree of freedom in the numerator and n degrees of freedom in the denominator.Virtual Laboratories > 5. Special <strong>Distribution</strong>s > 1 2 3 4 5 6 7 8 9 10 11 12 13 14 15Contents | Applets | Data Sets | Biographies | External Resources | Key words | Feedback | ©