High-Dynamic-Range Laser Amplitude and Phase Noise - Next ...
High-Dynamic-Range Laser Amplitude and Phase Noise - Next ...
High-Dynamic-Range Laser Amplitude and Phase Noise - Next ...

You also want an ePaper? Increase the reach of your titles
YUMPU automatically turns print PDFs into web optimized ePapers that Google loves.
SCOTT et al.: HIGH-DYNAMIC-RANGE LASER AMPLITUDE AND PHASE NOISE MEASUREMENT TECHNIQUES 645<br />
small compared to the carrier, it is valid <strong>and</strong> common practice<br />
to define .<br />
can be directly related to the measured spectrum<br />
as follows [30]: let be modeled as the narrow-b<strong>and</strong> noise<br />
process<br />
. The mean-squared phase deviation<br />
is<br />
. Now, imagine this noise process phase<br />
modulates the carrier. In the small modulation approximation<br />
( ), the SSB noise/carrier power ratio is [from (6)]<br />
. Thus<br />
(24)<br />
So, we merely subtract 3 dB from to arrive at .<br />
Provided that the mean-squared phase deviation is small enough<br />
( 1 rad) so that the linear approximation to the Bessel functions<br />
holds, this is valid <strong>and</strong> it is the spectrum that would be<br />
measured with an ideal narrow-b<strong>and</strong> receiver tuned to one side<br />
of the carrier. Howeverthere are severe dem<strong>and</strong>s on filter performance<br />
<strong>and</strong> dynamic range when directly measuring noise sideb<strong>and</strong>s<br />
adjacent to a carrier; the phase detector method is vastly<br />
superior.<br />
The use of as a representation of phase instability has<br />
gained wide acceptance. In order to avoid erroneous use of the<br />
function when the small modulation index approximation is violated,<br />
the IEEE, in St<strong>and</strong>ard 1139-1988, has simply made the<br />
following definition: [31].<br />
III. DYNAMIC RANGE REQUIREMENTS<br />
Very small amplitude fluctuations in a laser source can only<br />
be detected when they are stronger than the shot noise accompanying<br />
the light (in conventional classical measurement systems).<br />
These amplitude fluctuations scale linearly with the optical<br />
power while the shot noise goes as the square root. Furthermore,<br />
the maximum extraneous noise that can appear on the<br />
laser beam is approximately equal to the average laser power.<br />
Thus, any system created to reliably characterize laser noise<br />
must be capable of h<strong>and</strong>ling a large dynamic range with the low<br />
end of this range set by the shot noise <strong>and</strong> the high end set by the<br />
average photocurrent. To see what kind of dynamic range is ultimately<br />
required (or attainable) in a measurement system, let us<br />
simply calculate the shot-noise limited dynamic range inherent<br />
in a continuous-wave (CW) laser beam, which produces an average<br />
photocurrent , where is the photodetector responsivity<br />
<strong>and</strong> is the incident optical power. The fractional<br />
rms fluctuation produced by the shot noise is<br />
(25)<br />
where is the electron charge <strong>and</strong> is the receiver b<strong>and</strong>width.<br />
The dynamic range or signal/shot-noise power is thus<br />
which in decibels normalized to a 1 Hz b<strong>and</strong>width is<br />
(26)<br />
(27)<br />
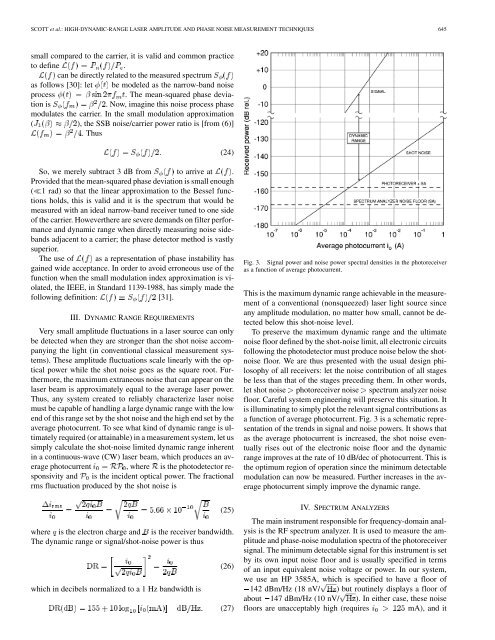
Fig. 3. Signal power <strong>and</strong> noise power spectral densities in the photoreceiver<br />
as a function of average photocurrent.<br />
This is the maximum dynamic range achievable in the measurement<br />
of a conventional (nonsqueezed) laser light source since<br />
any amplitude modulation, no matter how small, cannot be detected<br />
below this shot-noise level.<br />
To preserve the maximum dynamic range <strong>and</strong> the ultimate<br />
noise floor defined by the shot-noise limit, all electronic circuits<br />
following the photodetector must produce noise below the shotnoise<br />
floor. We are thus presented with the usual design philosophy<br />
of all receivers: let the noise contribution of all stages<br />
be less than that of the stages preceding them. In other words,<br />
let shot noise photoreceiver noise spectrum analyzer noise<br />
floor. Careful system engineering will preserve this situation. It<br />
is illuminating to simply plot the relevant signal contributions as<br />
a function of average photocurrent. Fig. 3 is a schematic representation<br />
of the trends in signal <strong>and</strong> noise powers. It shows that<br />
as the average photocurrent is increased, the shot noise eventually<br />
rises out of the electronic noise floor <strong>and</strong> the dynamic<br />
range improves at the rate of 10 dB/dec of photocurrent. This is<br />
the optimum region of operation since the minimum detectable<br />
modulation can now be measured. Further increases in the average<br />
photocurrent simply improve the dynamic range.<br />
IV. SPECTRUM ANALYZERS<br />
The main instrument responsible for frequency-domain analysis<br />
is the RF spectrum analyzer. It is used to measure the amplitude<br />
<strong>and</strong> phase-noise modulation spectra of the photoreceiver<br />
signal. The minimum detectable signal for this instrument is set<br />
by its own input noise floor <strong>and</strong> is usually specified in terms<br />
of an input equivalent noise voltage or power. In our system,<br />
we use an HP 3585A, which is specified to have a floor of<br />
142 dBm/Hz (18 nV/ ) but routinely displays a floor of<br />
about 147 dBm/Hz (10 nV/ ). In either case, these noise<br />
floors are unacceptably high (requires mA), <strong>and</strong> it