Proceedings of the Workshop - Georg-August-Universität Göttingen
Proceedings of the Workshop - Georg-August-Universität Göttingen
Proceedings of the Workshop - Georg-August-Universität Göttingen

You also want an ePaper? Increase the reach of your titles
YUMPU automatically turns print PDFs into web optimized ePapers that Google loves.
The difference in <strong>the</strong> same pool over a particular period <strong>of</strong> time is obtained per hectare,<br />
in which case it is estimated by:<br />
where<br />
,<br />
Annual change <strong>of</strong> carbon storage in ton/year.<br />
Carbon storage in <strong>the</strong> pool during <strong>the</strong> period i<br />
3. Results & Discussion<br />
3.1. Evaluation <strong>of</strong> cartographic precision in <strong>the</strong> detection <strong>of</strong> land-use change<br />
The reliability <strong>of</strong> <strong>the</strong> maps elaborated for detecting modifications in land-use was<br />
estimated by calculating <strong>the</strong> Kappa index. This index calculates <strong>the</strong> error associated to<br />
<strong>the</strong> assignation <strong>of</strong> different categories <strong>of</strong> land-use in <strong>the</strong> photo-interpreted polygons not<br />
visited in <strong>the</strong> field. A Kappa index <strong>of</strong> 0.88 was determined with an overall acceptability<br />
<strong>of</strong> 0.96, which provides an adequate level <strong>of</strong> reliability in <strong>the</strong> allocation <strong>of</strong> <strong>the</strong> different<br />
types <strong>of</strong> land-use.<br />
3.2. Land-use changes<br />
The analysis for each study period shows that <strong>the</strong> category <strong>of</strong> land-use corresponding<br />
to urban and industrial areas is <strong>the</strong> one with <strong>the</strong> largest surface <strong>of</strong> change (20%) from<br />
1993 to 2007. This urban growth is shown in studies such as <strong>the</strong> Araucanía region<br />
development strategy; in which, an intense migration from <strong>the</strong> countryside to <strong>the</strong> city is<br />
suggested, reaching a total <strong>of</strong> 67.7% (INE 2002) and focused primarily in <strong>the</strong> city <strong>of</strong><br />
Temuco.<br />
The Forest land-use is still changing in <strong>the</strong> surface area, increasing by 13%<br />
between 1993 and 2007 (Table 1).<br />
The land-uses that reduce <strong>the</strong>ir share are mainly agricultural land and<br />
unrecognized areas by 12.5 and 10.7% respectively. Agricultural land-use category<br />
decreased mainly due to surface transfer to <strong>the</strong> plantations sub-use category. O<strong>the</strong>r<br />
land-uses that decreased are shrublands/grasslands and wetlands with 9% and 4%<br />
during <strong>the</strong> period 1993-2007.<br />
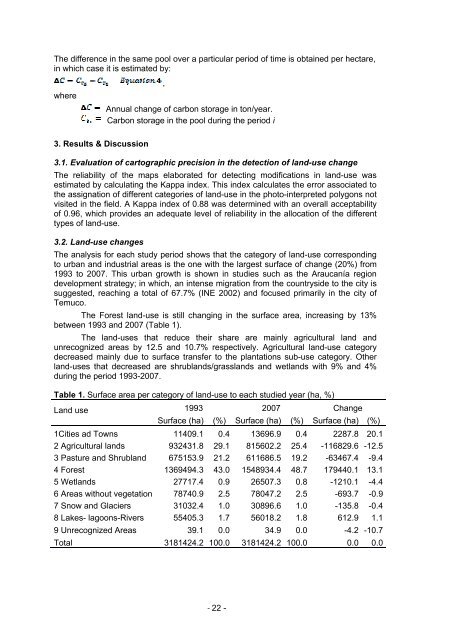
Table 1. Surface area per category <strong>of</strong> land-use to each studied year (ha, %)<br />
Land use<br />
1993 2007 Change<br />
Surface (ha) (%) Surface (ha) (%) Surface (ha) (%)<br />
1Cities ad Towns 11409.1 0.4 13696.9 0.4 2287.8 20.1<br />
2 Agricultural lands 932431.8 29.1 815602.2 25.4 -116829.6 -12.5<br />
3 Pasture and Shrubland 675153.9 21.2 611686.5 19.2 -63467.4 -9.4<br />
4 Forest 1369494.3 43.0 1548934.4 48.7 179440.1 13.1<br />
5 Wetlands 27717.4 0.9 26507.3 0.8 -1210.1 -4.4<br />
6 Areas without vegetation 78740.9 2.5 78047.2 2.5 -693.7 -0.9<br />
7 Snow and Glaciers 31032.4 1.0 30896.6 1.0 -135.8 -0.4<br />
8 Lakes- lagoons-Rivers 55405.3 1.7 56018.2 1.8 612.9 1.1<br />
9 Unrecognized Areas 39.1 0.0 34.9 0.0 -4.2 -10.7<br />
Total 3181424.2 100.0 3181424.2 100.0 0.0 0.0<br />
‐ 22 -