Proceedings of the Workshop - Georg-August-Universität Göttingen
Proceedings of the Workshop - Georg-August-Universität Göttingen
Proceedings of the Workshop - Georg-August-Universität Göttingen

You also want an ePaper? Increase the reach of your titles
YUMPU automatically turns print PDFs into web optimized ePapers that Google loves.
slight alteration level in <strong>the</strong> mature forest area that produces 0.111 Mt C/ha <strong>of</strong> loss in<br />
<strong>the</strong> carbon stock per area unit that possess more above ground biomass (Table 9).<br />
Table 8. Carbon fixation quantity (Mton C) in native forest according to <strong>the</strong> type <strong>of</strong><br />
canopy closure and forest structure<br />
Structure<br />
Year<br />
Very Dense Dense Open<br />
(100%-75%) (75%-50%) (50%-25%)<br />
Mature Forest<br />
1993 26652.94 4572.44 1258.89<br />
2007 25867.28 4424.70 1242.79<br />
Second-growth Forest<br />
1993 23126.32 10557.35 2734.36<br />
2007 21908.32 10088.60 2626.33<br />
Mature / Second-growth Forest<br />
1993 7171.23 1891.27 565.51<br />
2007 6702.64 1812.15 544.47<br />
Table 9. Change in <strong>the</strong> stock (Mton C) for <strong>the</strong> cover <strong>of</strong> native forests.<br />
Type <strong>of</strong> structure Very dense Dense Open Loss (Mton C)/ha<br />
Mature Forest -785.66 -147.74 -16.10 -0.111 %<br />
Second-growth Forest -1218.00 -468.75 -108.03 -0.054 %<br />
Mature/ Second-growth Forest -468.59 -79.13 -21.04 -0.102 %<br />
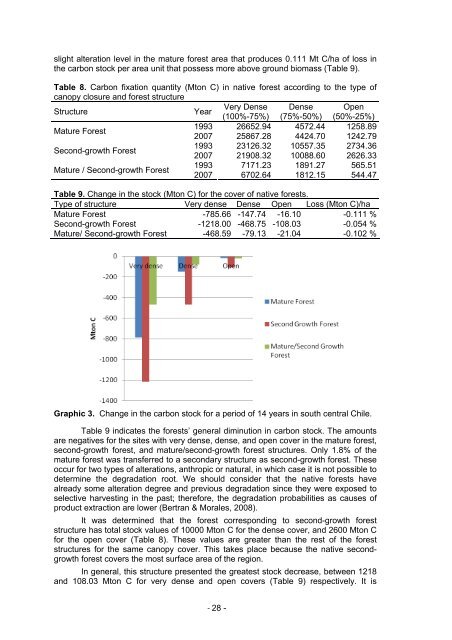
Graphic 3. Change in <strong>the</strong> carbon stock for a period <strong>of</strong> 14 years in south central Chile.<br />
Table 9 indicates <strong>the</strong> forests’ general diminution in carbon stock. The amounts<br />
are negatives for <strong>the</strong> sites with very dense, dense, and open cover in <strong>the</strong> mature forest,<br />
second-growth forest, and mature/second-growth forest structures. Only 1.8% <strong>of</strong> <strong>the</strong><br />
mature forest was transferred to a secondary structure as second-growth forest. These<br />
occur for two types <strong>of</strong> alterations, anthropic or natural, in which case it is not possible to<br />
determine <strong>the</strong> degradation root. We should consider that <strong>the</strong> native forests have<br />
already some alteration degree and previous degradation since <strong>the</strong>y were exposed to<br />
selective harvesting in <strong>the</strong> past; <strong>the</strong>refore, <strong>the</strong> degradation probabilities as causes <strong>of</strong><br />
product extraction are lower (Bertran & Morales, 2008).<br />
It was determined that <strong>the</strong> forest corresponding to second-growth forest<br />
structure has total stock values <strong>of</strong> 10000 Mton C for <strong>the</strong> dense cover, and 2600 Mton C<br />
for <strong>the</strong> open cover (Table 8). These values are greater than <strong>the</strong> rest <strong>of</strong> <strong>the</strong> forest<br />
structures for <strong>the</strong> same canopy cover. This takes place because <strong>the</strong> native secondgrowth<br />
forest covers <strong>the</strong> most surface area <strong>of</strong> <strong>the</strong> region.<br />
In general, this structure presented <strong>the</strong> greatest stock decrease, between 1218<br />
and 108.03 Mton C for very dense and open covers (Table 9) respectively. It is<br />
‐ 28 -