Proceedings of the Workshop - Georg-August-Universität Göttingen
Proceedings of the Workshop - Georg-August-Universität Göttingen
Proceedings of the Workshop - Georg-August-Universität Göttingen

Create successful ePaper yourself
Turn your PDF publications into a flip-book with our unique Google optimized e-Paper software.
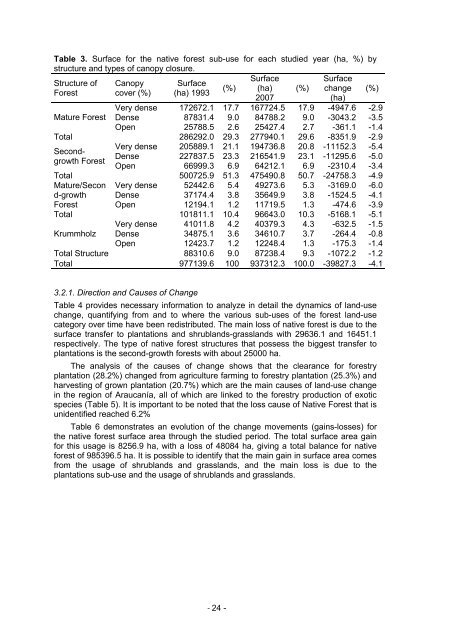
Table 3. Surface for <strong>the</strong> native forest sub-use for each studied year (ha, %) by<br />
structure and types <strong>of</strong> canopy closure.<br />
Surface<br />
Surface<br />
Structure <strong>of</strong> Canopy Surface<br />
(%) (ha) (%) change<br />
Forest cover (%) (ha) 1993<br />
2007<br />
(ha)<br />
(%)<br />
Very dense 172672.1 17.7 167724.5 17.9 -4947.6 -2.9<br />
Mature Forest Dense 87831.4 9.0 84788.2 9.0 -3043.2 -3.5<br />
Open 25788.5 2.6 25427.4 2.7 -361.1 -1.4<br />
Total 286292.0 29.3 277940.1 29.6 -8351.9 -2.9<br />
Very dense 205889.1 21.1 194736.8 20.8 -11152.3 -5.4<br />
Secondgrowth<br />
Forest<br />
Dense 227837.5 23.3 216541.9 23.1 -11295.6 -5.0<br />
Open 66999.3 6.9 64212.1 6.9 -2310.4 -3.4<br />
Total 500725.9 51.3 475490.8 50.7 -24758.3 -4.9<br />
Mature/Secon Very dense 52442.6 5.4 49273.6 5.3 -3169.0 -6.0<br />
d-growth Dense 37174.4 3.8 35649.9 3.8 -1524.5 -4.1<br />
Forest Open 12194.1 1.2 11719.5 1.3 -474.6 -3.9<br />
Total 101811.1 10.4 96643.0 10.3 -5168.1 -5.1<br />
Very dense 41011.8 4.2 40379.3 4.3 -632.5 -1.5<br />
Krummholz Dense 34875.1 3.6 34610.7 3.7 -264.4 -0.8<br />
Open 12423.7 1.2 12248.4 1.3 -175.3 -1.4<br />
Total Structure 88310.6 9.0 87238.4 9.3 -1072.2 -1.2<br />
Total 977139.6 100 937312.3 100.0 -39827.3 -4.1<br />
3.2.1. Direction and Causes <strong>of</strong> Change<br />
Table 4 provides necessary information to analyze in detail <strong>the</strong> dynamics <strong>of</strong> land-use<br />
change, quantifying from and to where <strong>the</strong> various sub-uses <strong>of</strong> <strong>the</strong> forest land-use<br />
category over time have been redistributed. The main loss <strong>of</strong> native forest is due to <strong>the</strong><br />
surface transfer to plantations and shrublands-grasslands with 29636.1 and 16451.1<br />
respectively. The type <strong>of</strong> native forest structures that possess <strong>the</strong> biggest transfer to<br />
plantations is <strong>the</strong> second-growth forests with about 25000 ha.<br />
The analysis <strong>of</strong> <strong>the</strong> causes <strong>of</strong> change shows that <strong>the</strong> clearance for forestry<br />
plantation (28.2%) changed from agriculture farming to forestry plantation (25.3%) and<br />
harvesting <strong>of</strong> grown plantation (20.7%) which are <strong>the</strong> main causes <strong>of</strong> land-use change<br />
in <strong>the</strong> region <strong>of</strong> Araucanía, all <strong>of</strong> which are linked to <strong>the</strong> forestry production <strong>of</strong> exotic<br />
species (Table 5). It is important to be noted that <strong>the</strong> loss cause <strong>of</strong> Native Forest that is<br />
unidentified reached 6.2%<br />
Table 6 demonstrates an evolution <strong>of</strong> <strong>the</strong> change movements (gains-losses) for<br />
<strong>the</strong> native forest surface area through <strong>the</strong> studied period. The total surface area gain<br />
for this usage is 8256.9 ha, with a loss <strong>of</strong> 48084 ha, giving a total balance for native<br />
forest <strong>of</strong> 985396.5 ha. It is possible to identify that <strong>the</strong> main gain in surface area comes<br />
from <strong>the</strong> usage <strong>of</strong> shrublands and grasslands, and <strong>the</strong> main loss is due to <strong>the</strong><br />
plantations sub-use and <strong>the</strong> usage <strong>of</strong> shrublands and grasslands.<br />
‐ 24 -