Basic Optical design - Light Tec
Basic Optical design - Light Tec
Basic Optical design - Light Tec

You also want an ePaper? Increase the reach of your titles
YUMPU automatically turns print PDFs into web optimized ePapers that Google loves.
Application-Specific<br />
<strong>Optical</strong> Design<br />
Introduction<br />
<strong>Optical</strong> <strong>design</strong> software capabilities<br />
have advanced considerably from the<br />
late 1950s and early 1960s when computer<br />
tools first became available. Initially,<br />
the main purpose of the software<br />
was to geometrically trace rays and<br />
perform limited analyses. However, the<br />
introduction of automated optimization,<br />
generally using a damped least<br />
squares algorithm, is what has made<br />
software an indispensable tool for the<br />
optical engineer.<br />
Today, optics are used in a variety of<br />
applications, and unique features and<br />
capabilities are often required to model,<br />
optimize, and analyze systems <strong>design</strong>ed<br />
for a specific application. In this paper,<br />
we will look at several different application<br />
areas and discuss some of the software<br />
modeling, <strong>design</strong>, and analysis<br />
features important for those applications.<br />
The applications include:<br />
• Commercial Imaging Systems<br />
• Visual Systems (i.e., optical systems<br />
that use the human eye as the<br />
detector)<br />
• Off-axis tilted and decentered<br />
Systems<br />
• Telecommunications Systems<br />
• Astronomical applications<br />
• Non-visible Systems (e.g., UV, IR,<br />
etc.)<br />
• Microlithographic (<strong>Optical</strong> Stepper)<br />
Systems<br />
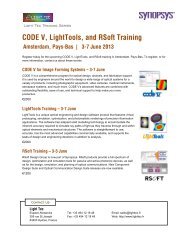
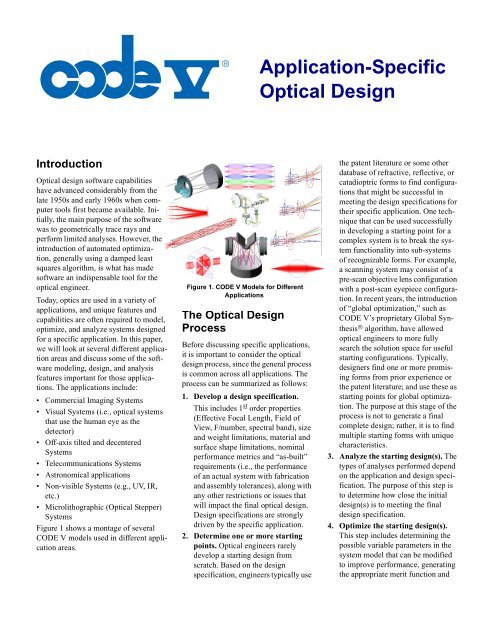
Figure 1 shows a montage of several<br />
CODE V models used in different application<br />
areas.<br />
Figure 1. CODE V Models for Different<br />
Applications<br />
The <strong>Optical</strong> Design<br />
Process<br />
Before discussing specific applications,<br />
it is important to consider the optical<br />
<strong>design</strong> process, since the general process<br />
is common across all applications. The<br />
process can be summarized as follows:<br />
1. Develop a <strong>design</strong> specification.<br />
This includes 1 st order properties<br />
(Effective Focal Length, Field of<br />
View, F/number, spectral band), size<br />
and weight limitations, material and<br />
surface shape limitations, nominal<br />
performance metrics and “as-built”<br />
requirements (i.e., the performance<br />
of an actual system with fabrication<br />
and assembly tolerances), along with<br />
any other restrictions or issues that<br />
will impact the final optical <strong>design</strong>.<br />
Design specifications are strongly<br />
driven by the specific application.<br />
2. Determine one or more starting<br />
points. <strong>Optical</strong> engineers rarely<br />
develop a starting <strong>design</strong> from<br />
scratch. Based on the <strong>design</strong><br />
specification, engineers typically use<br />
the patent literature or some other<br />
database of refractive, reflective, or<br />
catadioptric forms to find configurations<br />
that might be successful in<br />
meeting the <strong>design</strong> specifications for<br />
their specific application. One technique<br />
that can be used successfully<br />
in developing a starting point for a<br />
complex system is to break the system<br />
functionality into sub-systems<br />
of recognizable forms. For example,<br />
a scanning system may consist of a<br />
pre-scan objective lens configuration<br />
with a post-scan eyepiece configuration.<br />
In recent years, the introduction<br />
of “global optimization,” such as<br />
CODE V’s proprietary Global Synthesis<br />
® algorithm, have allowed<br />
optical engineers to more fully<br />
search the solution space for useful<br />
starting configurations. Typically,<br />
<strong>design</strong>ers find one or more promising<br />
forms from prior experience or<br />
the patent literature; and use these as<br />
starting points for global optimization.<br />
The purpose at this stage of the<br />
process is not to generate a final<br />
complete <strong>design</strong>; rather, it is to find<br />
multiple starting forms with unique<br />
characteristics.<br />
3. Analyze the starting <strong>design</strong>(s). The<br />
types of analyses performed depend<br />
on the application and <strong>design</strong> specification.<br />
The purpose of this step is<br />
to determine how close the initial<br />
<strong>design</strong>(s) is to meeting the final<br />
<strong>design</strong> specification.<br />
4. Optimize the starting <strong>design</strong>(s).<br />
This step includes determining the<br />
possible variable parameters in the<br />
system model that can be modified<br />
to improve performance, generating<br />
the appropriate merit function and
constraints based on the <strong>design</strong> specification,<br />
and then optimizing the<br />
<strong>design</strong> forms.<br />
5. Analyzing the optimized <strong>design</strong>(s).<br />
This step is similar to Step 3, but<br />
should include an initial tolerance<br />
analysis to determine if the current<br />
form will be sensitive to manufacturing<br />
and alignment errors. CODE V<br />
includes a tolerance analysis capability<br />
based on very fast and accurate<br />
wavefront differential algorithms.<br />
This feature includes the impact of a<br />
single or multiple compensators<br />
used to recover lost performance,<br />
and will determine tolerances<br />
(within user-defined limits) in order<br />
to minimize total performance loss.<br />
This capability allows for very fast<br />
initial assessments of <strong>design</strong> sensitivity<br />
to fabrication tolerances and<br />
assembly errors. This type of analysis<br />
helps the <strong>design</strong>er determine the<br />
best <strong>design</strong> form(s) for their specific<br />
requirements. Other required analyses<br />
may include determining the performance<br />
loss due to environmental<br />
conditions such as temperature or<br />
pressure. At this point, <strong>design</strong>ers can<br />
begin to choose the best candidates<br />
from among competing <strong>design</strong><br />
forms.<br />
6. Repeat Steps 4 and 5 as necessary.<br />
<strong>Optical</strong> <strong>design</strong> is an iterative process.<br />
It is rare that the initial optimization<br />
of a starting form results in<br />
the final configuration. Typically,<br />
<strong>design</strong>ers need to modify the model<br />
by allowing additional variables<br />
(e.g., adding lenses, using aspheric<br />
surfaces, etc.), or by allowing more<br />
freedom during optimization by<br />
relaxing constraints. If the optical<br />
materials are allowed to vary, the<br />
<strong>design</strong>er will need to substitute<br />
obtainable materials for any theoretical<br />
material definitions and perform<br />
a quick re-optimization before evaluating<br />
the system. Sometimes, if the<br />
resulting <strong>design</strong> does not meet the<br />
<strong>design</strong> specifications, the <strong>design</strong>er<br />
must revisit the specifications to<br />
determine if they can be modified<br />
with regards to size and weight limits,<br />
or performance goals.<br />
7. Perform a global optimization<br />
check on the finished <strong>design</strong>. Since<br />
the constraints, variables, and specifications<br />
have likely evolved during<br />
the optical <strong>design</strong> process, it is often<br />
useful to perform another global<br />
optimization (Global Synthesis) with<br />
the finalized parameters. If global<br />
optimization does not generate a<br />
form better than the current <strong>design</strong>,<br />
this gives <strong>design</strong>ers some confidence<br />
that their final <strong>design</strong> is the best<br />
solution. Occasionally, when starting<br />
from the "final" configuration, global<br />
optimization will find a configuration<br />
that does a better job of<br />
meeting the performance goals. If<br />
the optical materials were allowed to<br />
be variable during Step 4, this should<br />
also be allowed during this step, and<br />
real glass substitution will be<br />
required on the resulting <strong>design</strong>s.<br />
8. Perform a tolerancing check on<br />
the finished <strong>design</strong>. In this step, the<br />
<strong>design</strong>er should determine the final<br />
tolerances and compensators for the<br />
<strong>design</strong>. The <strong>design</strong>er should already<br />
be working with the opto-mechanical<br />
engineer to understand what<br />
adjustments are possible. Once<br />
again, using the wavefront differential<br />
method of tolerancing allows<br />
different compensation schemes to<br />
be tested very quickly. In addition<br />
there are features that allow the software<br />
model to match the optomechanical<br />
implementation (i.e.,<br />
“labeled” and “grouped” tolerances<br />
and compensators). An aspect of this<br />
step that is often overlooked is to<br />
always include an adjustment tolerance<br />
on the compensator. In the real<br />
world, no compensation (such as<br />
refocus) can be achieved perfectly;<br />
there is always some error in the<br />
adjustment (e.g., due to thread tolerances<br />
on a focus barrel).<br />
9. Modify the finished <strong>design</strong> for fabrication<br />
and cost considerations.<br />
Once a final <strong>design</strong> form is determined,<br />
there are additional steps that<br />
will facilitate the fabrication of the<br />
<strong>design</strong> and potentially lower lifecycle<br />
costs. These steps may<br />
include:<br />
• Verify the availability of optical<br />
materials in the finished <strong>design</strong>. In<br />
recent years, glass manufacturers<br />
have been trying to keep costs low<br />
by maintaining only small inventories<br />
of infrequently ordered<br />
glasses. When this happens, a<br />
glass that is offered in the manufacturer’s<br />
catalog is sometimes out<br />
of stock. This can often require a<br />
complete re<strong>design</strong> to use different<br />
optical materials for time-critical<br />
<strong>design</strong>s. The <strong>design</strong>er should verify<br />
material availability as soon as<br />
they have a reasonable idea of<br />
which materials are required.<br />
• If possible, make bi-convex and<br />
bi-concave lenses with similar<br />
radii equi-convex or equi-concave<br />
to prevent them from being assembled<br />
backwards. This happens<br />
more often than fabrication shops<br />
would like to admit.<br />
• If possible, make spherical surfaces<br />
with long radii planar.<br />
• If possible, round lens thickness<br />
values to a limited number of significant<br />
digits (this will make the<br />
fabrication shop happy).<br />
• Adjust the radii in the <strong>design</strong> to<br />
match the test plates available to<br />
the fabrication shop. This step will<br />
save fabrication cost if test plates<br />
are being used to verify the manufactured<br />
radii. CODE V optimization<br />
supports automatic test<br />
plating to an input test plate list.<br />
• After all these changes have been<br />
implemented, perform a final optimization<br />
and performance evaluation(s)<br />
(both nominal and asbuilt).<br />
• Create and check lens and component<br />
drawings for the fabrication<br />
facility.<br />
10. Post-fabrication analyses. After the<br />
<strong>design</strong> has been fabricated, there<br />
may be some additional steps necessary<br />
for precision applications:<br />
• The glass model for the <strong>design</strong><br />
may need to be altered to match<br />
measured index data from samples<br />
of the real material to be used, and<br />
the airspaces adjusted slightly to<br />
2
compensate for performance<br />
changes due to the refractive index<br />
differences. This process is called<br />
“melt fitting,” and CODE V<br />
includes some special features to<br />
aid in the modeling of measured<br />
glass data.<br />
• Apply surface deformation data,<br />
measured with an interferometer<br />
directly to the surfaces in the<br />
model. Most commercial interferometer<br />
manufacturers can export<br />
the measurement data directly into<br />
CODE V’s interferogram file<br />
format.<br />
Starting Form For Global Synthesis<br />
• Apply measured lens thicknesses<br />
to the model.<br />
• After these changes have been<br />
implemented, analyze the system<br />
“as-built” performance based on<br />
the information.<br />
• If needed, you can perform automated<br />
alignment on the <strong>design</strong>.<br />
CODE V contains an “Alignment<br />
Optimization” feature that can be<br />
used to determine the correct<br />
alignment adjustments based on<br />
optical system measurements<br />
using an interferometer.<br />
With the optical <strong>design</strong> process outlined,<br />
we can examine how the specifics of the<br />
process can vary for different applications.<br />
Commercial<br />
Imaging Systems<br />
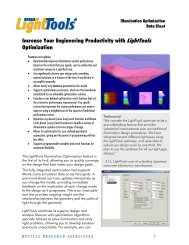
Figure 2. Several distinct solutions for a CRT camera lens, generated by Global Synthesis<br />
Imaging systems for commercial applications<br />
(such as camera objectives and<br />
projector lenses) were one of the earliest<br />
application areas that benefited from<br />
optical <strong>design</strong> and analysis software.<br />
These systems cover a large range of<br />
f-numbers (F/#) and Fields of View<br />
(FOV).<br />
Commercial imaging systems commonly<br />
use centered, rotationally symmetric<br />
refractive systems. A starting<br />
point could be chosen from one of the<br />
2400 patents in CODE V’s built-in<br />
patent database, or by using global optimization.<br />
The applicability of global<br />
optimization for starting point generation<br />
can be seen in Figure 2. The application<br />
is a 200 mm EFL, F/1.25, allspherical,<br />
8-element, camera lens for<br />
photographing a CRT display. The starting<br />
configuration is indicated.<br />
Early imaging system performance metrics<br />
were based on geometrical ray tracing<br />
and included ray aberrations,<br />
geometrical Modulation Transfer Function<br />
(MTF), 3 rd and higher-order aberrations.<br />
Later, as diffraction computations<br />
were added to software, the standard<br />
performance metrics migrated to Diffraction<br />
MTF, Root-mean-square (RMS)<br />
wavefront error, Point Spread Functions<br />
(PSF), and Strehl ratios. Figure 3 shows<br />
a mosaic of performance analysis results<br />
for a Petzval lens system.<br />
Since diffraction-based MTF is a leading<br />
performance metric for commercial<br />
imaging systems, optimization and tolerance<br />
metrics that compute diffractionbased<br />
MTF can be very beneficial.<br />
CODE V’s fast and accurate wavefront<br />
differential algorithm is used for both<br />
MTF optimization (i.e., an optimization<br />
merit function that directly optimizes<br />
diffraction-based MTF at specified frequencies)<br />
and MTF tolerancing.<br />
Figure 3. Several Analyses for a<br />
Petzval Lens<br />
Visual Systems<br />
The effective <strong>design</strong> and analysis of<br />
visual systems can benefit from specialized<br />
handling of the light emerging from<br />
the system. In a visual system, the<br />
human eye is the detector; and it has a<br />
built-in capability to quickly refocus as<br />
it scans a field of view through an opti-<br />
3
cal system. This suggests that optical<br />
software needs to model independent<br />
focus across field. Typically, the focusing<br />
ability of the eye is measured in<br />
units of diopters of accommodation. A<br />
diopter is a reciprocal unit of distance,<br />
corresponding to 1/(distance in meters)<br />
to where an object appears to be. A person<br />
with good vision (i.e., emmetropic<br />
vision if corrective eye glasses are not<br />
required, or possibly myopic or hyperopic<br />
vision if corrective lenses are<br />
needed) can focus very comfortably at<br />
infinity. Focusing on an object that<br />
appears to be at infinity corresponds to<br />
an accommodation of 0.0 diopters<br />
(i.e., 1/∞ meters).<br />
Since the average human has a visual<br />
resolution that corresponds to about one<br />
arc-minute, performance metrics in<br />
terms of angular units are natural for<br />
evaluating visual systems. Some typical<br />
visual system performance metrics and<br />
suggested goals are:<br />
• Field curvature < 1 diopter (always<br />
positive, i.e., the image is formed in<br />
front of the observer since the human<br />
eye has limited ability to focus light<br />
converging towards it)<br />
• Astigmatism < 0.25 diopter<br />
• Lateral color < 5 arc minutes<br />
(assumes modeling of a full photonic<br />
spectral band, ~ 465 to 645 nm)<br />
• 0.25 MTF at 0.5 cycles/arc minute<br />
(corresponds to a “line width” of one<br />
arc minute)<br />
CODE V supports a “true afocal modeling”<br />
feature that allows independent<br />
focus across field, with focus values<br />
defined in diopters of accommodation.<br />
The feature also supports aberration<br />
analysis output in terms of angular units,<br />
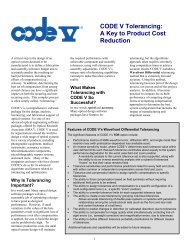
Figure 4. 5x40 Telescope & True Afocal Modeling Controls<br />
in CODE V<br />
or cycles/angular unit in the case of<br />
MTF. Figure 4 shows a 5x40 visual telescope<br />
(i.e., 5x magnification, 40 mm<br />
entrance pupil diameter) and the<br />
CODE V controls for angular performance<br />
units and accommodation across<br />
the field of view (which can be variable<br />
for optimization).<br />
Notice that each field has a separate<br />
accommodation ranging from 0.0 diopters<br />
at the edge of the field (i.e., objects<br />
at the edge of the field in the telescope<br />
appear to be at infinity) to +0.63 diopters<br />
on-axis (axial objects appear to be<br />
1/0.63, or about 1.6 meters in front of<br />
the observer. This range of accommodation<br />
meets the typical field curvature<br />
specification < 1 diopter.<br />
Figure 5. Analysis Curves with units of<br />
Diopters, Arc Minutes, or Cycles/Arc Minute<br />
Figure 5 shows a mosaic of analysis output<br />
with units in arc minutes, or diopters<br />
of accommodation.<br />
Off-axis, Tilted, And<br />
Decentered Systems<br />
Rotational symmetry<br />
has a number of benefits<br />
in an optical <strong>design</strong>,<br />
including symmetry of<br />
the aberration field and<br />
generally easier fabrication<br />
and alignment.<br />
However, many applications<br />
require the symmetry<br />
to be violated,<br />
especially to meet packaging<br />
constraints.<br />
Space-borne reflective<br />
optics and heads up displays<br />
(HUDs) can often be fit into a<br />
much smaller space if the components<br />
are tilted and decentered relative to a<br />
common axis.<br />
For these types of systems, flexibility in<br />
how the tilts and decenters can be<br />
defined is an important software modeling<br />
feature. For example, CODE V supports<br />
six different methods for tilting<br />
and decentering a surface, and defining<br />
the coordinate system that follows the<br />
surface. One of the most useful is the<br />
ability to define all the surfaces relative<br />
to a global coordinate system.<br />
For optimization, control of beam and<br />
component clearances becomes very<br />
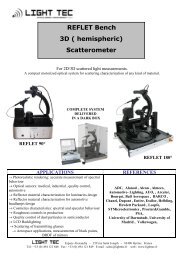
System Layout and Full Field Spot Diagram -<br />
Before Optimization<br />
System Layout and Full Field Spot Diagram -<br />
After Optimization (same scale)<br />
Figure 6. 4-Mirror, Off-axis System,<br />
Before and After Optimization<br />
4
important, since the natural tendency is<br />
for the <strong>design</strong> to become more symmetric<br />
to reduce aberrations, and this often<br />
leads to interference problems between<br />
the ray bundles and components.<br />
Figure 6 illustrates the evolution from a<br />
starting system with multiple beam and<br />
component interference problems to a<br />
final system with improved performance<br />
and no beam and component interference<br />
problems. This <strong>design</strong> evolution<br />
was accomplished in a single optimization<br />
run. The key to the successful optimization<br />
of this system was the ability<br />
to easily define optimization constraints<br />
to automatically prevent interference<br />
problems. In CODE V, these constraints<br />
are typically handled as Lagrange multipliers,<br />
which means they are separate<br />
from the optimization error function (in<br />
this case, the default RMS blur size<br />
error function). This allows the optimization<br />
to converge on the best performance<br />
in the least constrained mode,<br />
while maintaining packaging clearances.<br />
Another important aspect for the <strong>design</strong><br />
of systems utilizing off-axis tilted and<br />
decentered components, is that traditional<br />
diagnostic analyses, such as transverse<br />
ray aberration curves or field<br />
curves, can be deceiving. These traditional<br />
tools were developed for systems<br />
with rotational symmetry, and rely on<br />
this symmetry to be meaningful across<br />
the entire field of view. To address this<br />
limitation, CODE V includes a field<br />
map diagnostic option that can plot various<br />
performance metrics across the full<br />
field of view. The information in these<br />
plots can provide great insight on what<br />
steps to take to improve the system performance<br />
(see Thompson 1996:2 and<br />
Rogers 1999:286). Figure 7 shows two<br />
Figure 7. Full Field Maps of Aberration<br />
Fields<br />
field map outputs for the system above,<br />
one showing astigmatic focal lines and<br />
the other a plot of the magnitude and<br />
orientation of wavefront Zernike coefficients<br />
for 3 rd order coma.<br />
Telecommunication<br />
Systems<br />
Figure 8a. <strong>Optical</strong> Isolator System<br />
Figure 8b. Field Intensity at Output Fiber Figure 8c. Field Intensity at Input Fiber<br />
from Reflection at Output Fiber<br />
In recent years, there has been an<br />
increase in the optical <strong>design</strong> and analysis<br />
of components for telecommunication<br />
systems. These components are<br />
generally very small. The governing<br />
performance metric is how much energy<br />
is gathered from an input fiber, laser, or<br />
waveguide and coupled into an output<br />
fiber. As a percentage this is called the<br />
fiber coupling efficiency, but it is typically<br />
defined in terms of energy loss in<br />
decibels (i.e., insertion loss).<br />
The fibers are very small and typically<br />
can propagate a single mode, or only a<br />
few modes. Gradient index elements are<br />
common and polarization effects are<br />
often important. Figure 8a shows an<br />
optical isolator. The input fiber is on the<br />
left and the output fiber is on the right.<br />
For this system, it is desired that light<br />
reflected from the output fiber face will<br />
not propagate back into the input fiber.<br />
This system has very little insertion loss<br />
in the desired direction (the intensity of<br />
the optical field at the output fiber is<br />
shown in Figure 8b). By using birefringent<br />
crystal materials and a Faraday<br />
rotator element to rotate the electric<br />
field, any light that is reflected back<br />
towards the input fiber is split into two<br />
components, such that very little energy<br />
couples back into the input fiber (Figure<br />
8c).<br />
Typical analysis models for traditional<br />
imaging systems treat all diffraction as<br />
occurring at the optical system exit<br />
pupil. This may be inadequate for<br />
telecommunication systems, since the<br />
beams are typically only a few hundred<br />
wavelengths in diameter and often<br />
propagate several thousand wavelengths<br />
in distance between components. The<br />
physics of this arrangement cause the<br />
beam diameter to grow due to<br />
diffraction spreading, and cannot be<br />
accurately modeled with geometric ray<br />
tracing techniques. In this case, general<br />
beam propagation algorithms must be<br />
used throughout the entire optical<br />
system to adequately account for<br />
diffraction.<br />
CODE V’s general beam propagation<br />
feature can be used to determine the<br />
5
LP01 Mode LP011a Mode LP011b Mode<br />
Figure 9. Supported Modes for Corning SMF-28 Fiber used at 850 nm<br />
beam remains coherent and interference<br />
results. The angular size of the object<br />
under observation can be inferred by<br />
adjusting the separation between the two<br />
apertures until the fringe structure disappears.<br />
Figure 10b shows the PSF in a<br />
well-aligned system. Since the mirrors<br />
are modeled as separate non-sequential<br />
components, they can be tilted with<br />
respect to each other. The effect on the<br />
PSF of a 1/3 arc-second tilt on one of the<br />
mirrors is shown in Figure 10c.<br />
complex field throughout the system,<br />
and, most importantly, at the output<br />
fiber face. CODE V’s fiber coupling<br />
efficiency feature calculates the overlap<br />
integral between the complex field and<br />
the mode profile of the single mode<br />
fiber to determine the insertion loss into<br />
the fiber. Multimode fiber analysis is<br />
also supported, by computing the coupling<br />
efficiency into each supported<br />
mode of the fiber. Figure 9 illustrates the<br />
amplitude profile for three modes supported<br />
by a Corning SMF28 fiber operating<br />
at a wavelength of 850 nm.<br />
Typically, this fiber is used at 1310 nm<br />
or 1550 nm, and only the fundamental<br />
mode (LP01) will propagate. However,<br />
when used at 850 nm, the modes shown<br />
in Figure 9 are supported. The data used<br />
to create these plots is used to define the<br />
mode structure for the multi-mode fiber<br />
coupling efficiency calculation.<br />
CODE V supports both a fiber coupling<br />
efficiency merit function for optimization<br />
and a coupling efficiency tolerancing<br />
performance metric. This allows the<br />
optical <strong>design</strong> process outlined on<br />
page 1 to be directly applied to these<br />
types of systems.<br />
Astronomical<br />
Applications<br />
Astronomical applications generally<br />
require small fields of view, fast (small<br />
F-number) optics, and point image performance<br />
metrics, since the objects of<br />
interest are small and faint. In addition,<br />
many large telescopes and planned<br />
space-borne optics are using segmented<br />
apertures. Traditional optical system<br />
modeling defines systems sequentially<br />
for ray tracing. That is, all rays must go<br />
from an object to surface 1, to surface 2,<br />
to surface 3, and so forth. When segmented<br />
apertures are used, different rays<br />
will intersect different segments, but not<br />
intersect the others. In CODE V, this<br />
type of system is handled by using nonsequential<br />
surfaces (NSS). Figure 10a<br />
shows a stellar interferometer system<br />
used for ultra-high resolution studies.<br />
The path for the light from the two separated<br />
apertures is carefully maintained<br />
to be approximately equal so that the<br />
Figure 10a. Stellar Interferometer Systems<br />
Non-Visible (UV, IR, etc.)<br />
Systems<br />
The optical <strong>design</strong> process outlined on<br />
page 1 works equally well for systems<br />
that operate at visible wavelengths and<br />
for systems that operate outside the visible<br />
spectrum. However, some new<br />
issues arise when operating outside of<br />
the visible spectral band. For example,<br />
systems that operate in the ultraviolet<br />
will require better optics to achieve<br />
“diffraction limited” performance, since<br />
diffraction is a function of wavelength<br />
Figure 10b. PSF for Aligned System Figure 10c. PSF for Misaligned System<br />
6
and shorter wavelengths allow better<br />
resolution.<br />
Thermal infrared systems, <strong>design</strong>ed to<br />
detect heat emissions from thermal bodies,<br />
typically use cooled detectors.<br />
Often, the detector array instantaneously<br />
images only a portion of the desired<br />
field of view. Using scan mirrors or<br />
other devices, the image of the detector<br />
array is scanned across the full field of<br />
view. These systems are subject to some<br />
unique image defects such as narcissus,<br />
which must be considered in the <strong>design</strong><br />
specification.<br />
In general, material considerations have<br />
the most significant impact when working<br />
outside the visible spectral region.<br />
<strong>Optical</strong> glasses eventually become<br />
opaque in the ultraviolet and infrared.<br />
Often other crystalline materials must be<br />
used. Reflective optics have the benefit<br />
of working across a larger spectral band<br />
but sometimes their use is restricted due<br />
to packaging considerations or fabrication<br />
limitations.<br />
Figure 11. Plot of P vs. V for <strong>Optical</strong><br />
Glasses in the Visible Spectral Band<br />
Figure 12. Plot of P vs. V for <strong>Optical</strong><br />
Glasses in the 1550 nm – 1610 nm<br />
Spectral Band<br />
In the near ultraviolet and infrared, optical<br />
glasses will transmit, but their optical<br />
properties will be different than<br />
when they are used in the visible. For<br />
example, in the visible spectral region,<br />
the 2 nd derivative of the index vs. wavelength<br />
curve, represented by the partial<br />
dispersion (P), varies nearly linearly<br />
with Abbe number for most commonly<br />
available optical glasses. This representation<br />
is sometimes called “the normal<br />
dispersion line” and is useful for understanding<br />
glass selection to correct the<br />
aberration of secondary color. Figure 11<br />
is a plot of the partial dispersion (P) versus<br />
Abbe number (V) for the Schott<br />
glass catalog, in the visible region.<br />
Fictitious glasses, i.e., glass models that<br />
can be variable for optimization, are typically<br />
based on this normal dispersion<br />
model. However, outside the visible<br />
spectral region, the concept of a “normal<br />
line” may not exist. Consider the P vs. V<br />
plot for the same glasses operating in a<br />
typical telecommunications wavelength<br />
band of 1550 to 1610 nm. The result is<br />
shown in Figure 12.<br />
A fictitious glass dispersion model<br />
based on the “normal line” in the visible<br />
would not do a very good job of modeling<br />
real glass dispersion behavior in the<br />
infrared. In CODE V, users can redefine<br />
the fictitious glass model wavelengths<br />
and dispersion characteristics to match<br />
those of real glasses used in that wavelength<br />
region. This makes it much easier<br />
to substitute real optical materials for<br />
variable optical materials.<br />
Microlithographic<br />
Systems<br />
One of the most demanding optical<br />
<strong>design</strong> applications is microlithographic<br />
systems. These are systems used to fabricate<br />
integrated circuits. While the optical<br />
<strong>design</strong> process is the same, these<br />
systems require diffraction limited asbuilt<br />
performance with essentially zero<br />
distortion. Successive generations of<br />
these systems use shorter operational<br />
wavelengths and faster optics in order to<br />
achieve the improved theoretical resolution<br />
limit. Subtle image degradation due<br />
to material stress birefringence, intrinsic<br />
material birefringence, thermal effects,<br />
and other sources must be analyzed<br />
(Li, Ota, and Murakami 2003:127-129).<br />
In addition, the characteristics of the<br />
illumination beam must be considered.<br />
For example, CODE V can analyze onedimensional<br />
and two-dimensional image<br />
structure assuming illumination that<br />
ranges from fully coherent to incoherent.<br />
Figure 13 shows an Offner reflective<br />
microlithographic system and<br />
image structure analysis.<br />
The demands of microlithographic<br />
optics require that all possible steps be<br />
taken to maximize performance. The<br />
post-fabrication steps of the <strong>design</strong> process<br />
become critically important. Manufacturers<br />
have successfully used<br />
CODE V’s alignment optimization feature<br />
to reduce cost and improve<br />
performance (Sugisake, et al.,<br />
2000:751-758).<br />
Figure 13. Offner 1:1 Microlithographic Projection system & 2-D Partial<br />
Coherence Analysis<br />
7
Figure 14<br />
Other Considerations<br />
Engineering is an international<br />
endeavor, but different locales often<br />
require specialized tools. An example<br />
within CODE V is support of the PRC<br />
National Standard optical element drawing<br />
format. Figure 14 shows an optical<br />
element drawing for a singlet.<br />
To this point we have not discussed<br />
optics for illumination <strong>design</strong> and analysis.<br />
The optical <strong>design</strong> problem for illumination<br />
systems is very<br />
different from that of imageforming<br />
applications. In some<br />
respects, it is much more difficult<br />
to develop an optical system<br />
that distributes light from a<br />
condensed source evenly across<br />
a large area (or with some specific<br />
distribution). An attempt<br />
to merge the capabilities<br />
required for both image-forming<br />
and illumination applications<br />
into a single software<br />
package, necessitates significant<br />
added complexity to the<br />
software interface, or a significantly<br />
reduced feature set.<br />
ORA has developed another<br />
software product, <strong>Light</strong>Tools ® ,<br />
to address the specific needs of<br />
the illumination engineering<br />
field by providing a full set of<br />
features with an easy-to-use<br />
interface.<br />
Conclusions<br />
The optical <strong>design</strong> process is relatively<br />
consistent across various applications.<br />
However, many applications require<br />
some specialized <strong>design</strong> or analysis<br />
techniques and features. Successful optical<br />
<strong>design</strong> requires that the <strong>design</strong>er<br />
always consider the <strong>design</strong> specification,<br />
which is the first and often the<br />
most important step in the optical <strong>design</strong><br />
process. It is here that all the considerations<br />
and limitations of the <strong>design</strong><br />
should be defined. The specification will<br />
affect the approach used in executing<br />
the optical <strong>design</strong> process, and help to<br />
determine what <strong>design</strong> features and<br />
analysis functions should be applied to<br />
the problem.<br />
The benefits of optical <strong>design</strong> software<br />
encompass all phases and applications<br />
of optical engineering in the 21 st century.<br />
The return on investment for outstanding<br />
software pays for itself many<br />
times over in terms of superior performance,<br />
lower manufacturing costs, and<br />
in its ability to facilitate technological<br />
innovation.<br />
References<br />
Li,Yangqiu, Ota, Kazuya, and<br />
Murakami, Katsuhiko. “Thermal and<br />
structural deformation and its impact on<br />
optical performance of projection optics<br />
for extreme ultraviolet lithography,”<br />
Journal of Vacuum Science and <strong>Tec</strong>hnology<br />
B, Jan/Feb 2003, pp. 127-129.<br />
Rogers, John R. “Design techniques for<br />
systems containing tilted components,”<br />
SPIE, Vol. 3737, 1999, p. 286.<br />
Sugisake, K., et. al., “Assembly and<br />
alignment of three aspherical mirror<br />
optics for extreme ultraviolet projection<br />
lithography,” Proc. SPIE, Vol. 3997,<br />
2000, pp. 751-758.<br />
Thompson, Kevin. “Practical methods<br />
for the optical <strong>design</strong> of systems without<br />
symmetry,” SPIE, Vol. 2774, 1996, p. 2.<br />
3280 East Foothill Boulevard, Pasadena, California 91107<br />
Telephone: (626) 795-9101 FAX: (626) 795-0184<br />
E-mail: service@opticalres.com Web site: http://www.opticalres.com