
Create successful ePaper yourself
Turn your PDF publications into a flip-book with our unique Google optimized e-Paper software.
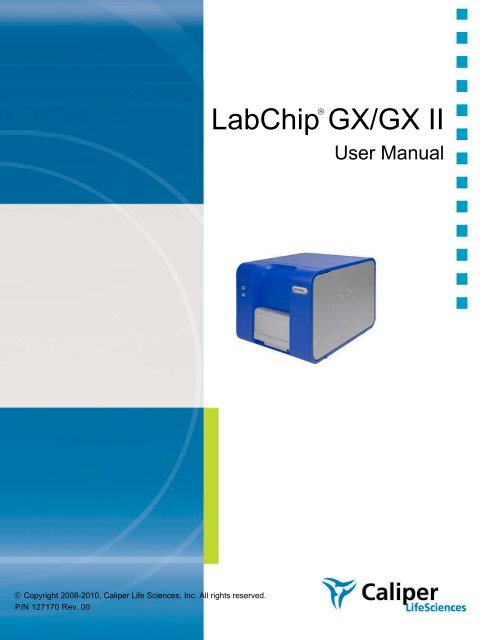
<strong>LabChip</strong><strong>GX</strong>/<strong>GX</strong> II<strong>User</strong> <strong>Manual</strong>Copyright 2008-2010, Caliper Life Sciences, Inc. All rights reserved.P/N 127170 Rev. 00
Preface 2CopyrightTrademarksContentPrefaceProper Equipment OperationThis manual is published by Caliper Life Sciences, Inc., 68 Elm Street, Hopkinton,MA 01748 USA. Copyright 2008 - 2010, Caliper Life Sciences, Inc. All rightsreserved. Reproduction by any means or in any form of this manual or the productsit describes is prohibited.Caliper Life Sciences, Inc., <strong>LabChip</strong>, and the <strong>LabChip</strong> logo are registeredtrademarks of Caliper Life Sciences, Inc. The Caliper logo and DataViewer aretrademarks of Caliper Life Sciences, Inc. Microsoft, Windows, and Windows NT areeither registered trademarks or trademarks of Microsoft Corporation in the UnitedStates and/or other countries. All other trademarks and registered trademarks arethe property of their respective holders.The information in this manual may contain typographical errors or technicalinaccuracies and is subject to change without notice. Modifications may also bemade to the product described in this manual at any time.WARNINGS• To reduce the risk of electric shock, do not remove the cover. No userserviceable parts inside. Refer to qualified service personnel if help isrequired.• Use this product only in the manner described in this manual. If the equipmentis used in a manner not specified by the manufacturer, the protection providedby the equipment may be impaired.AVERTISSEMENTSContact Us• Pour réduire le risque de choc électrique, ne pas retirer le couvercle. Ceproduit ne contient aucune pièce pouvant être réparée par l’utilisateur. Aubesoin, confier l’appareil à un réparateur qualifié.• Ce produit ne doit être utilisé que comme décrit dans ce manuel. Si cetappareil est utilisé d’une manière autre que celle spécifiée par le fabricant, laprotection fournie par l’appareil peut être entravée.If you have a question about a product that is not answered in this manual or onlineHelp, or if you need assistance with this product, contact the Caliper TechnicalSupport Center from 8:00 A.M. to 8:00 P.M., Eastern Time, Monday through Friday:Phone: (508) 435-9761;1-877-<strong>LabChip</strong> for <strong>LabChip</strong> products onlyFax: (508) 435-0950Email: techsupport@caliperLS.comInternet: www.caliperLS.comP/N 127170 Rev. 00 <strong>LabChip</strong> <strong>GX</strong> <strong>User</strong> <strong>Manual</strong> Caliper Life Sciences, Inc.
Preface 3For support in Europe contact Caliper Life Sciences LTD, Runcorn, UK +44-1928-711448 or fax +44-1928-791228. For more information contact your local Caliperrepresentative.Before you call, you should have the following information available for thetechnical representative:• Product serial number• Software version (found by choosing About from the main Help menu)• If applicable, the error number shown on the product’s LCD display, in theproduct software, or in the log file.Product Service and Customer Support PlansTraining For Your ProductCaliper offers a full range of services to ensure your success. From our originalfactory warranty through a comprehensive line of customer support plans, Caliperoffers you Field Service Engineers and in-house Specialists who are dedicated tosupporting your hardware, software and application development needs.Call: (508) 435-9761Fax: (508) 435-0950Email: techsupport@caliperLS.comOur programs can include such useful services as:• Preventive maintenance• Diagnostic servicing performed on-site by Caliper field service engineers orremotely via Technical Support• Validation performed on-site by Caliper field service engineers• Extended use of the Caliper Technical Support Center• Software updates• Parts, labor, and travel expense coverage• Other customized services upon requestFCCCEContact the Caliper Center for Training and Development for information about theavailability of training courses for your product:Call: (508) 497-2634Fax: (508) 435-3439This device complies with part 15 of the FCC (United States FederalCommunications Commission) Rules. Operation is subject to the following twoconditions:• This device may not cause harmful interference, and• This device must accept any interference received, including interference thatmay cause undesired operation.This device complies with all CE rules and requirements.P/N 127170 Rev. 00 <strong>LabChip</strong> <strong>GX</strong> <strong>User</strong> <strong>Manual</strong> Caliper Life Sciences, Inc.
Preface 4NOTEChanges or modifications to this equipment not expressly approved by the partyresponsible for compliance could void the user’s authority to operate theequipment.REMARQUETout changement ou modification apporté à cet instrument non expressémentapprouvé par l’entité responsable de la conformité peut annuler l’autorisationd’opérer l’appareil accordée à l’utilisateur.Table of SymbolsTable 1 contains symbols that identify particularly important information and alertyou to the presence of hazards. These symbols may appear in this manual and/oron the product it describes.Table 1. Important SymbolsSymbolSymboleDescriptionDescriptionDANGER: An imminently hazardous situation, which, if notavoided, will result in death or serious injury.DANGER: Situation présentant un danger imminent qui, s’iln’est pas éliminé, peut entraîner des blessures graves, voire lamort.WARNING: Caution, risk of danger. Refer to the <strong>User</strong>’sdocumentation.AVERTISSEMENT: Attention, danger potentiel. Se reporter à ladocumentation de l’utilisateur.NOTE: A cautionary statement; an operating tip or maintenancesuggestion; may result in instrument damage if not followed.REMARQUE: Énoncé indiquant une précaution à prendre, unconseil de fonctionnement ou une suggestion d’entretien; sonnon-respect peut provoquer des dommages à l’instrument.Hazardous voltage; risk of shock injury.Tension dangereuse; risque de blessure par électrocution.Crush hazard. Risk of body parts, hair, jewelry, or clothinggetting caught in a moving part.Danger d’écrasement. Faire attention que les partiescorporelles, les cheveux, les bijoux ou les vêtements ne soientpas pris dans une pièce mobile.Risk of puncture injury.Risque de blessure par piqûre.Risk of eye injury; wear safety glasses.Risque de lésion oculaire; porter des lunettes de sécurité.P/N 127170 Rev. 00 <strong>LabChip</strong> <strong>GX</strong> <strong>User</strong> <strong>Manual</strong> Caliper Life Sciences, Inc.
Preface 5Table 1. Important Symbols (Continued)SymbolSymboleDescriptionDescriptionRisk of fire.Risque d’incendie.Risk of poison.Risque d’empoisonnement.Risk of explosion.Risque d’explosion.Hazardous fumes.Émanations dangereuses.Laser light; avoid exposure. Risk of eye injury.Rayonnement laser; éviter toute exposition. Risque de lésionoculaire.Lifting hazard. May result in injury.Levage dangereux. Peut entraîner des blessures.Protective ground symbol.Symbole de terre de protection.Ground symbol.Symbole de terre.Fuse.Fusible.Alternating current.Courant alternatif.On (supply).Marche (alimentation).Off (supply).Arrêt (alimentation).CE compliance mark.Marque de conformité CE.Signifies that the unit has passed safety tests for grounding,power line transience, and current leakage.Signifie que l’appareil a réussi les tests de sécurité pour la miseà la terre, le courant transitoire de ligne d’alimentation et laperte de courant.Input.Entrée.P/N 127170 Rev. 00 <strong>LabChip</strong> <strong>GX</strong> <strong>User</strong> <strong>Manual</strong> Caliper Life Sciences, Inc.
Preface 6Table 1. Important Symbols (Continued)SymbolSymboleDescriptionDescriptionOutput.Sortie.Equipmentlabels are colorcoded:Les étiquettesde l’appareilsont codéescouleur:Yellow Caution, risk of dangerRed StopBlue Mandatory actionGreen Safe condition or informationJaune Attention, danger potentielRouge ArrêterBleu Intervention obligatoireVert Condition sûre ou informations de sécuritéHelpful hints, additional informationConseils utiles, informations supplémentairesP/N 127170 Rev. 00 <strong>LabChip</strong> <strong>GX</strong> <strong>User</strong> <strong>Manual</strong> Caliper Life Sciences, Inc.
Instrument Safety 7Required TrainingInstrument SafetyThe following safety information about the <strong>LabChip</strong> <strong>GX</strong> is includedin this documentation. Read and review all safety informationbefore operating the <strong>LabChip</strong> <strong>GX</strong>.• Required Training• “Chemical Safety” on page 8• “Laser Safety” on page 9• “Electrical Safety” on page 10• “Mechanical Safety” on page 11Ensure that all personnel involved with the operation of theinstrument have:• Received instruction in general safety practices for laboratories.• Received instruction in specific safety practices for theinstrument.• Read and understood all related MSDSs.WARNINGUse this product only in the manner described in this manual. If theequipment is used in a manner not specified by the manufacturer,the protection provided by the equipment may be impaired.P/N 127170 Rev. 00 <strong>LabChip</strong> <strong>GX</strong> <strong>User</strong> <strong>Manual</strong> Caliper Life Sciences, Inc.
Instrument Safety 8Chemical SafetyWARNINGSome chemicals used with the <strong>LabChip</strong> <strong>GX</strong> are potentiallyhazardous and can cause illness.• Read and understand the material safety data sheet (MSDS)provided by the chemical manufacturer before you store,handle, or work with any chemical or hazardous material.• Minimize contact with and inhalation of chemicals and chemicalwastes. Wear appropriate personal protective equipment whenhandling chemicals (e.g., safety glasses, gloves, or clothing).For additional safety guidelines consult the MSDS.• Do not leave chemical containers open. Use only with adequateventilation, including a fume hood, if necessary.• Check regularly for chemical leaks or spills. If a leak or spilloccurs, follow the manufacturer’s cleanup procedures asrecommended on the MSDS.• Dispose of waste in accordance with good laboratory practicesand local, state/provincial, or national environmental and healthregulations.• After emptying waste containers, seal them appropriately.• Comply with all local, state/provincial, or national laws andregulations related to chemical storage, handling, and disposal.P/N 127170 Rev. 00 <strong>LabChip</strong> <strong>GX</strong> <strong>User</strong> <strong>Manual</strong> Caliper Life Sciences, Inc.
Instrument Safety 9Laser SafetyWARNINGBRIGHT LIGHT HAZARD. Caliper <strong>LabChip</strong> <strong>GX</strong> Instruments contain Class 3Blaser diodes. The <strong>LabChip</strong> <strong>GX</strong> is classified as a Class 1 device because thelasers are appropriately enclosed (embedded) and indicated with Warninglabels.Complies with 21 CFR 1040.10 except for deviations pursuant to LaserNotice 50, dated June 24, 2007.Complies with IEC 60825-1: 1993, A1: 1997, A2: 2001.Class 1LaserProduct635 nm (visible red) laser source, 10 mW maximum continuous(CW)WARNING• Use of controls or adjustments or performance of proceduresother than those specified herein may result in hazardousradiation exposure.• NEVER remove back, side, or front panels of the instrumentwhile the laser is powered. Panels (which, if removed, couldlead to laser exposure) are marked with the labels shown below:• These panels are intended to be removed for service only byqualified personnel; they are not intended to be removed duringoperation or for maintenance by users. The only removablemaintenance panel is the lower panel at the back of theinstrument, which can be removed to access the back of therobot, if cleaning is necessary.P/N 127170 Rev. 00 <strong>LabChip</strong> <strong>GX</strong> <strong>User</strong> <strong>Manual</strong> Caliper Life Sciences, Inc.
Instrument Safety 10Electrical SafetyThe <strong>LabChip</strong> <strong>GX</strong> is powered by a UL/CSA/VDE approved 100-240VAC, 50/60 Hz input, 5, 15, 24 VDC output power supply.Additionally, the <strong>LabChip</strong> <strong>GX</strong> High Voltage circuitry is currentlimitedto non-hazardous levels. <strong>User</strong>s should observe thefollowing:WARNINGDo not open the instrument enclosure. There are no userserviceable parts inside.The wall outlet or the power cable connector on the back of theinstrument should be accessible after the system's installation, toenable trained service personnel to safely disconnect power fromthe system during servicing.The computer supplied with the <strong>LabChip</strong> <strong>GX</strong> instrument has internallithium batteries. Batteries should not be incinerated.WARNINGPower Cord SelectionDanger of explosion if battery is incorrectly replaced. Replace onlywith the same or equivalent type recommended by themanufacturer's instructions.United States and CanadaThe <strong>LabChip</strong> <strong>GX</strong> instrument is shipped with a NEMA 5-15 / IEC 320power cord. If the power cord needs to be replaced, substitutepower cords must be UL Listed, Type SJT or equivalent, minimumNo. 18 AWG, 3-conductor with ground conductor that for safetyconsiderations should never be disconnected or defeated. Thecord’s plug to the wall must be a three-pin grounding type connectorwith a NEMA 5-15P (15A, 125V) plug configuration. The cord’sconnector at the unit must conform to requirements for an EN 60320/IEC 320 Standard Sheet C13 connector.The equipment is intended to be plugged into a standard NEMA 5-15R receptacle in the wall.P/N 127170 Rev. 00 <strong>LabChip</strong> <strong>GX</strong> <strong>User</strong> <strong>Manual</strong> Caliper Life Sciences, Inc.
Instrument Safety 11InternationalAll power cord sets must be approved by an acceptable, accreditedagency responsible for evaluation in the country where the powercord set and system will be used.The flexible cord must be Type H05VV-F, 3-conductor,minimum 0.75 - 1 mm 2 conductor size (230 volt input). Power cordset fittings that is, the appliance coupler and wall plug, must bearthe certification mark of the agency responsible for evaluation in thecountry where it will be used. The appliance coupler must meet themechanical configuration of an EN 60 320/IEC 320 Standard SheetC13 connector for mating with appliance inlet on the system.FusesMechanical SafetyThe <strong>LabChip</strong> <strong>GX</strong> instruments do not contain any user replaceablefuses. Contact Caliper Technical Support (see “Contact Us” onpage 2) if blown fuses are suspected.The <strong>LabChip</strong> <strong>GX</strong> instruments have a three axis robot that movesquickly and can be a pinch hazard. Keep the front door of theinstrument closed when the robot is moving. Keep hands away fromthe robot when not actually placing microplates in the instrument orchanging the ladder and buffer vials. Robot access areas aremarked with the following warning label:P/N 127170 Rev. 00 <strong>LabChip</strong> <strong>GX</strong> <strong>User</strong> <strong>Manual</strong> Caliper Life Sciences, Inc.
Table of Contents 12Table of ContentsPreface .................................................................................................................... 2Instrument Safety ................................................................................................... 7Required Training................................................................................................ 7Chemical Safety .................................................................................................. 8Laser Safety........................................................................................................ 9Electrical Safety ................................................................................................ 10Power Cord Selection .................................................................................. 10Fuses .......................................................................................................... 11Mechanical Safety ............................................................................................. 11Introduction........................................................................................................... 17Principles of Operation ...................................................................................... 18Operation .............................................................................................................. 21Opening the <strong>LabChip</strong> <strong>GX</strong> Software.................................................................... 21Creating a New Assay ....................................................................................... 22Running an Assay ............................................................................................. 23Select the Auto Export Settings ......................................................................... 26Monitoring the Run ............................................................................................ 27Stopping a Run ................................................................................................. 28Continuing a Stopped Run ................................................................................ 29Saving Data Files .............................................................................................. 30Saving Workspace Files .................................................................................... 31Adding a New Plate........................................................................................... 32Placing the Barcode on the Plate ...................................................................... 34Data Analysis ........................................................................................................ 35How the Software Analyzes DNA Data .............................................................. 36How the Software Analyzes Protein Data .......................................................... 38How the Software Analyzes RNA Data .............................................................. 42How the Software Analyzes Glycan Data........................................................... 47Organizing, Retrieving, and Backing Up Data Files ........................................... 50Opening a New Workspace ............................................................................... 50Opening a Data File .......................................................................................... 51Adding a Collection to a Workspace .................................................................. 52Selecting the Wells in a Collection .................................................................... 53Using Sample Name Files ................................................................................. 54Using Expected Fragments/ Expected Proteins/ Expected Glycans................... 57Entering EFs, EPs, or EGs in the Assay Analysis Window ........................... 57Exporting EFs, EPs, or EGs......................................................................... 58Importing EFs, EPs, or EGs ......................................................................... 58Forcing Expected Peaks .............................................................................. 59Viewing the EFs/EPs/EGs in the Graph View............................................... 59Viewing the EFs/EPs/EGs in the Gel View ................................................... 60Viewing the EFs/EPs/EGs in the Well Table ................................................ 61P/N 127170 Rev. 00 <strong>LabChip</strong> <strong>GX</strong> <strong>User</strong> <strong>Manual</strong> Caliper Life Sciences, Inc.
Table of Contents 13Viewing the EFs/EPs/EGs in the Peak Table ............................................... 61Modifying Analysis Parameters ......................................................................... 62Changing the Peak Find Parameters ........................................................... 63Adding a Peak ............................................................................................. 64Excluding a Peak ......................................................................................... 64Merging Two Peaks ..................................................................................... 65Selecting a Default Ladder........................................................................... 65Using the Default Ladder for Alignment........................................................ 67Exporting the Default Ladder in an Assay .................................................... 67Clearing the Default Ladder in a Plate ......................................................... 67Changing the Time Window for Analysis ...................................................... 68Aligning or Unaligning the Marker Peaks ..................................................... 68Saving and Exporting Assays ............................................................................ 72Changing the View of the Results...................................................................... 72Adjust Pane Widths ..................................................................................... 75Show or Hide Views..................................................................................... 75Zoom In and Zoom Out ................................................................................ 76Viewing Graphs in the Overlay Electropherograms Tab ............................... 77Viewing Graphs in the Electropherograms Tab ............................................ 78Viewing Multiple Properties in the Well Table View ...................................... 79Copying Information .......................................................................................... 80Reanalyzing a Data File .................................................................................... 81Printing Workspace Information......................................................................... 82Exporting Data .................................................................................................. 86Exporting Data <strong>Manual</strong>ly.............................................................................. 89Software Security ................................................................................................. 90Locking and Unlocking the Software.................................................................. 92Managing <strong>User</strong> Accounts .................................................................................. 93Adding New <strong>User</strong>s ....................................................................................... 94Changing <strong>User</strong> Information .......................................................................... 95Printing <strong>User</strong> Information ............................................................................. 96Activating and Deactivating <strong>User</strong> Accounts .................................................. 96Changing Access Rights .............................................................................. 97Printing Access Rights ................................................................................. 98Setting Policies for <strong>User</strong> Accounts ............................................................... 99Printing <strong>User</strong> Policies................................................................................. 100Electronic Signatures ...................................................................................... 101Automatically Exporting Copies of Data Files .................................................. 102Reverting to a Specific Data File Revision ....................................................... 102Audit Trail........................................................................................................ 103Viewing the Audit Trail ............................................................................... 104Exporting the Audit Trail ............................................................................ 105Central Data Repository (CDR) ....................................................................... 106CDR Security Suggestions......................................................................... 106Creating New Data Folders........................................................................ 107Moving Data Files into Folders................................................................... 107Deleting Data Folders ................................................................................ 107P/N 127170 Rev. 00 <strong>LabChip</strong> <strong>GX</strong> <strong>User</strong> <strong>Manual</strong> Caliper Life Sciences, Inc.
Table of Contents 14Hiding Data Files in the CDR Manager Window ......................................... 108Showing Hidden Data Files in the CDR Manager Window.......................... 108Remote CDR Server Backup ........................................................................... 109Setting Up the Remote CDR Server........................................................... 109Backing Up Data Files to the Remote CDR ................................................ 111Running Installation Qualification (IQ) ............................................................. 112Running Operational Qualification (OQ) .......................................................... 112Software Reference ............................................................................................ 113<strong>LabChip</strong> <strong>GX</strong> Main Window............................................................................... 114Menu Bar ................................................................................................... 115Chip Status and Run Status....................................................................... 121Error Message Area................................................................................... 123Plate View or Plate List.............................................................................. 124Collection Pane ......................................................................................... 127Graph View................................................................................................ 128Graph View Properties............................................................................... 134Gel View .................................................................................................... 136Gel View Properties ................................................................................... 139Well Table View ......................................................................................... 140Peak Table View........................................................................................ 141Peak Table Properties ............................................................................... 146Filter View ................................................................................................. 147About <strong>LabChip</strong> <strong>GX</strong> Window ............................................................................. 150Add New Expected Peak Window.................................................................... 151Add Plate Window ........................................................................................... 152Assay Analysis Window................................................................................... 153Assay Information Tab ............................................................................... 154Alignment Tab ........................................................................................... 155Analysis Tab .............................................................................................. 156Peak Find Tab ........................................................................................... 158Expected Fragments/Proteins/Glycans Tab ............................................... 162Excluded Peaks Tab .................................................................................. 164Smear Analysis Tab................................................................................... 166Titer Tab .................................................................................................... 168Advanced Tab ........................................................................................... 171Audit Trail Window .......................................................................................... 173Audit Trail Export Window ............................................................................... 174Audit Trail Manage Columns Window .............................................................. 175CDR Manager Window .................................................................................... 176CDR Server Utility Window.............................................................................. 178CDR Utility Window ......................................................................................... 179Change Password Window.............................................................................. 181Data File Version Window ............................................................................... 182Event Viewer Window ..................................................................................... 183Export Window ................................................................................................ 184Installation Qualification Window ..................................................................... 187Layout Options Window................................................................................... 188P/N 127170 Rev. 00 <strong>LabChip</strong> <strong>GX</strong> <strong>User</strong> <strong>Manual</strong> Caliper Life Sciences, Inc.
Table of Contents 15Login Window.................................................................................................. 189New Collection Window................................................................................... 190Perform Signature Window.............................................................................. 191Plate Information Window................................................................................ 192Print Window ................................................................................................... 193Print Validation Reports Window ..................................................................... 195Rename Collection Window............................................................................. 196Run File Editor Window ................................................................................... 197Run Info Window ............................................................................................. 198Sample Name Editor Window .......................................................................... 199Save Workspace As Window........................................................................... 201Select a Data File Window .............................................................................. 202Start Run Window ........................................................................................... 203Run Tab..................................................................................................... 204Output Tab ................................................................................................ 206Advanced Tab ........................................................................................... 208System Diagnostics Window ........................................................................... 210Unlock Application Window ............................................................................. 212<strong>User</strong> Administration Window............................................................................ 213Create New <strong>User</strong> ....................................................................................... 214Edit <strong>User</strong>s.................................................................................................. 215Show <strong>User</strong> Info .......................................................................................... 216De/Activate <strong>User</strong>........................................................................................ 217Define Access............................................................................................ 218Set Policies................................................................................................ 220<strong>LabChip</strong> <strong>GX</strong> Instrument Description .................................................................. 221Front View....................................................................................................... 221Front Panel ..................................................................................................... 222Rear Connectors ............................................................................................. 223Optics ............................................................................................................. 224Chip Pressure System..................................................................................... 224Barcode Reader .............................................................................................. 224DNA, RNA, and Protein Chips ......................................................................... 225Chip Cartridge ................................................................................................. 226High Voltage Interface ............................................................................... 227Microplate Carrier............................................................................................ 228USB Key for 21 CFR Part 11 Option................................................................ 228Specifications.................................................................................................. 229General ..................................................................................................... 229Environmental ........................................................................................... 229Electrical.................................................................................................... 229Assay Voltage ........................................................................................... 230Chip Pressure............................................................................................ 230Chip Temperature Control ......................................................................... 230Fluorescence Detection ............................................................................. 230Light Source (Red laser diode) .................................................................. 230Barcode Reader ........................................................................................ 230P/N 127170 Rev. 00 <strong>LabChip</strong> <strong>GX</strong> <strong>User</strong> <strong>Manual</strong> Caliper Life Sciences, Inc.
Table of Contents 16Maintenance and Service ................................................................................... 231Cleaning the Chip Cartridge ............................................................................ 232Troubleshooting and Diagnostics...................................................................... 233Searching for Events in the Events Tab........................................................... 233Viewing Current Events in the Events Tab....................................................... 234Viewing Past Events in the Events Tab ........................................................... 234Error Messages............................................................................................... 235Device is Disconnected ............................................................... 235Plate Carrier Motion Blocked ..................................................................... 236Home Timeout ........................................................................................... 236Move Timeout ............................................................................................ 236Pressure Leak Detected ............................................................................ 237Focus Failed .............................................................................................. 237IV Check Failed ......................................................................................... 238Current Leakage Check Failed .................................................................. 238Chip Temperature Warning ........................................................................ 238Diagnostics ..................................................................................................... 239Running the Diagnostics Tests .................................................................. 239Description of Diagnostic Tests.................................................................. 240Troubleshooting Assay Problems .................................................................... 243Software Problems .......................................................................................... 244Cannot Save a File .................................................................................... 244Computer Software Lock-Ups .................................................................... 244Tips and Shortcuts ............................................................................................. 246Glossary of Terms .............................................................................................. 247Caliper Life Sciences, Inc. Product Warranty ................................................... 271Caliper Life Sciences, Inc. Software License Agreement ................................. 273Index.................................................................................................................... 275P/N 127170 Rev. 00 <strong>LabChip</strong> <strong>GX</strong> <strong>User</strong> <strong>Manual</strong> Caliper Life Sciences, Inc.
Introduction 17IntroductionThis manual includes general instructions for using the <strong>LabChip</strong> <strong>GX</strong>hardware and software. It includes general procedures for operatingthe system, analyzing the data, using software security to complywith 21 CFR Part 11 requirements, instrument maintenance, andhardware and software troubleshooting.DNA, RNA, and Protein Chip and Reagent Kits are available to runspecific assays on the <strong>LabChip</strong> <strong>GX</strong>. The Assay Kits include thereagents and consumables required to run the specific assay.Protein and Glycan assays are only supported on <strong>LabChip</strong> <strong>GX</strong> IIinstruments.Assay <strong>User</strong> GuidesAssay <strong>User</strong> Guides provide information about the assay.Instructions for preparing the chip, the plate, the ladder vial, and thebuffer vial are included in the <strong>LabChip</strong> <strong>GX</strong>/<strong>GX</strong>II Assay <strong>User</strong> Guidefor the specific assay that you are running. Detailed informationabout the assays, including Specifications, Safety Warnings,Preparation Procedures, Expected Results, Troubleshooting,<strong>LabChip</strong> Kit Essential Practices, and Reordering Information is alsolocated in the <strong>LabChip</strong> <strong>GX</strong>/<strong>GX</strong>II Assay <strong>User</strong> Guide for the specificassay that you are running.The current version of the Assay <strong>User</strong> Guides can be accessed onthe Caliper web site at:http://www.caliperls.com/support/reference-library/datasheets/labchip_systems_data_sheets.htm.Assay Quick GuidesAssay Quick Guides are included with each Assay Kit and includeinstructions for preparing the chip to run an assay.Copies of the Assay Quick Guides can be accessed on the Caliperweb site at:http://www.caliperls.com/support/reference-library/datasheets/labchip_systems_data_sheets.htm.P/N 127170 Rev. 00 <strong>LabChip</strong> <strong>GX</strong> <strong>User</strong> <strong>Manual</strong> Caliper Life Sciences, Inc.
Introduction 18Principles of OperationThe <strong>LabChip</strong> <strong>GX</strong> assays are based on traditional gelelectrophoresis principles that have been transferred to a chipformat. The chip format dramatically reduces separation time andprovides automated sizing and quantitation information in a digitalformat.The chip contains an interconnected set of microchannels that jointhe separation channel and buffer wells. One of the microchannelsis connected to a short capillary that extends from the bottom of thechip at a 90-degree angle. The capillary sips sample from the wellsof a microplate during the assay.Some of the channels in the chip are larger than others. The largerchannels contain buffer. During the chip preparation, the smallerchannels and some of the wells are filled with sieving gel and buffer.Figure 1. DNA/RNA Chip and Protein Chip SchematicsAfter the channels are filled, the chip functions as an integratedelectrical circuit. The circuit is driven by the 7 electrodes in theelectrode cartridge that contact solutions in the chip's wells whenthe chip holder is closed. Each electrode is connected to anindependent power supply that provides maximum control andflexibility.The polymer filling the smaller channels in the chip is designed tosieve DNA/RNA fragments or proteins by size as they are driventhrough it by means of electrophoresis, similar to using agarose orpolyacrylamide gels. The sample and sieving buffers also contain afluorescent dye that gets brighter upon binding to double-strandedDNA, RNA, or protein/SDS complex. (Protein and Glycan assaysare only supported on <strong>LabChip</strong> <strong>GX</strong> II instruments.)P/N 127170 Rev. 00 <strong>LabChip</strong> <strong>GX</strong> <strong>User</strong> <strong>Manual</strong> Caliper Life Sciences, Inc.
Introduction 19Principles of Operation (Continued)In the chip, each sample is sipped by negative pressure until asufficient quantity is loaded in the chip. The sample is then movedelectrophoretically into the central channel. As the fragments movedown the central channel, they separate by size, finally passing thelaser that excites the fluorescent dye bound to the molecule. Thesoftware plots fluorescence intensity versus time and produceselectropherograms for each sample (see Figure 2).Figure 2. ElectropherogramThe data can also be viewed in a gel-like format on the Gel Tab toachieve the appearance of a slab gel. (The colors of the gel can bechanged.)Figure 3. Gel ViewP/N 127170 Rev. 00 <strong>LabChip</strong> <strong>GX</strong> <strong>User</strong> <strong>Manual</strong> Caliper Life Sciences, Inc.
Introduction 20Principles of Operation (Continued)Quantitating the concentration and accurately sizing each fragmentare achieved by comparing against a sizing ladder and runninginternal standards or “markers” with each sample. Internalstandards of known concentration are mixed with the sample to aidin quantitation.The amount of sample sipped into the chip depends on pH, saltconcentration, and buffer additives. The internal standardsnormalize these factors so that the software can use the ratio of thearea of the curve of the standard to the unknown peak to determineconcentration directly. The internal standards lie slightly outside theassay range so they do not interfere with analysis.P/N 127170 Rev. 00 <strong>LabChip</strong> <strong>GX</strong> <strong>User</strong> <strong>Manual</strong> Caliper Life Sciences, Inc.
Operation 21OperationThis section includes general instructions for using the <strong>LabChip</strong> <strong>GX</strong>hardware and software to run an assay.For assay-specific information, see the <strong>LabChip</strong> <strong>GX</strong>/<strong>GX</strong>II Assay<strong>User</strong> Guide for the specific assay that you are running. The currentversion of the Assay <strong>User</strong> Guides can be accessed on the Caliperweb site at:http://www.caliperls.com/support/reference-library/datasheets/labchip_systems_data_sheets.htm.To run an assay in the <strong>LabChip</strong> <strong>GX</strong>:• Open the <strong>LabChip</strong> <strong>GX</strong> software. (See “Opening the <strong>LabChip</strong> <strong>GX</strong>Software” on page 21.)• If necessary, create a new assay. (See “Creating a New Assay”on page 22)• Clean the electrodes and the O-Rings as directed in the<strong>LabChip</strong> <strong>GX</strong>/<strong>GX</strong>II Assay <strong>User</strong> Guide.• Prepare the chip for the assay as directed in the <strong>LabChip</strong><strong>GX</strong>/<strong>GX</strong>II Assay Quick Guide.• Prepare the plate for the assay as directed in the <strong>LabChip</strong><strong>GX</strong>/<strong>GX</strong>II Assay Quick Guide. (See “Placing the Barcode on thePlate” on page 34 if using barcodes on the sample plates.)• Run the assay. (See “Running an Assay” on page 23)Opening the <strong>LabChip</strong> <strong>GX</strong> SoftwareTo open the <strong>LabChip</strong> <strong>GX</strong> software:1 Double-click on the <strong>LabChip</strong> <strong>GX</strong> icon on the Windows desktop.2 If 21 CFR Part 11 Security is installed, the Login Window opens.3 Type a valid <strong>LabChip</strong> <strong>GX</strong> user name and password into the textboxes and click the OK button. (For instructions on creating<strong>LabChip</strong> <strong>GX</strong> user names, see “Adding New <strong>User</strong>s” on page 94.)4 The <strong>LabChip</strong> <strong>GX</strong> Main Window opens.5 See “Creating a New Assay” on page 22 or “Running an Assay”on page 23.P/N 127170 Rev. 00 <strong>LabChip</strong> <strong>GX</strong> <strong>User</strong> <strong>Manual</strong> Caliper Life Sciences, Inc.
Operation 22Creating a New AssayThe <strong>LabChip</strong> <strong>GX</strong> software enables you to create a new assay byopening and editing an existing assay and then saving the assaywith a new name.To create a new assay:1 On the <strong>LabChip</strong> <strong>GX</strong> Main Window, select Tools Edit Assay.The Select Assay To Edit window opens.2 Select the name of the Assay file that you want to edit and clickthe OK button. The Assay Analysis Window opens and displaysthe settings for the open assay.3 Modify the settings as necessary for the new assay. (SeeModifying Analysis Parameters or Reanalyzing a Data File forinformation on setting or changing analysis parameters.)4 Click the Save Assay button at the bottom of the AssayAnalysis window, specify the desired name for the new assayfile, and click the Save button.P/N 127170 Rev. 00 <strong>LabChip</strong> <strong>GX</strong> <strong>User</strong> <strong>Manual</strong> Caliper Life Sciences, Inc.
Operation 23Running an AssayTo start an assay to read a plate:1 Click the Run button on the <strong>LabChip</strong> <strong>GX</strong> Main Window (seepage 114) to open the Start Run Window.2 Click the Run tab in the Start Run window.3 Select the type of assay you want to run in the Assay Typedrop-down list. (Protein and Glycan assays are only supportedon <strong>LabChip</strong> <strong>GX</strong> II instruments.)4 Type the operator's name in the Operator Name text box.5 Select the name of the plate in the Plate Name drop-down list.To use a plate that is not listed in the Plate Name list, see“Adding a New Plate” on page 32.6 To read the plate barcode, select the Use Barcode check box.(The plate barcode can be used to name the data file ifselected.)7 On the Plate diagram, select the wells to be sampled.• To select all wells on the plate, click the double-arrow buttonin the lower-right corner of the plate.• To select all rows on the plate, click the double-arrow buttonat the top left corner of the plate.• To select all columns on the plate, click the double-downarrowbutton at the top right corner of the plate.• To select a column, click the column number at the top orbottom of the plate.• To select a row, click the row letter on the left or right side ofthe plate.• Clear specific wells by clicking on the selected well again.8 Select the desired order to sample the selected wells, Rowwiseor Column-wise.9 Click the Output Tab in the Start Run window.10 To change the Data Path, either type the desired path or clickthe Browse button and select the desired location for the datafiles. Clicking the Default button restores the default data path.P/N 127170 Rev. 00 <strong>LabChip</strong> <strong>GX</strong> <strong>User</strong> <strong>Manual</strong> Caliper Life Sciences, Inc.
Operation 24Running an Assay (Continued)NOTEData files should be saved to a local folder on the computer's harddrive. Saving data files to a network drive may cause loss of data ifthe network connection is slow or interrupted.11 If desired, select the Create Daily Sub-Directory check box tocreate a new sub-directory for data files each day.12 If the 21 CFR Part 11 option is installed and you want to save acopy of the data files to a folder outside of the CDR or if the 21CFR Part 11 option is not installed and you want to save asecond copy of the data files, see “Automatically ExportingCopies of Data Files” on page 102.13 In the File Prefix text box, type the desired prefix for all datafiles. (The File Name Format text box displays the selectedformat for the data files.)14 To add the Computer Name, Project Name, Barcode, Date,and/or Time to the data file name, select or clear the desiredcheck boxes or type the desired project name.15 To automatically export data tables, graphs, or gels, select theAutomatic Export check box, click the Auto Export Settingsbutton, and then select the desired Auto Export settings (seepage 26).16 Click the Advanced Tab in the Start Run window.17 To perform the assay multiple times on the same plate, selectthe desired number of times to run the assay in the PlateCycles text box.18 To randomly sample a specific percent of the selected wells,select the Random Selection check box and specify thepercent of wells to sample during the run.19 To repeatedly run the selected wells and combine the data intoone data file, select the Sample Saver check box and select thenumber of times to repeatedly run the selected wells in theRepeats text box.P/N 127170 Rev. 00 <strong>LabChip</strong> <strong>GX</strong> <strong>User</strong> <strong>Manual</strong> Caliper Life Sciences, Inc.
Operation 25Running an Assay (Continued)20 To use a file to supply the sample names, click the Browsebutton next to Sample Names File, select the name of the .csvfile that contains the sample names, and click the Open button.The path and name of the file displays in the text box.21 To use a file to supply the Expected Peaks, click the Browsebutton next to Expected Peaks File, select the name of the .csvfile that contains the expected peaks, and click the Open button.The path and name of the file displays in the text box. (See“Using Expected Fragments/ Expected Proteins/ ExpectedGlycans” on page 57 for more information.)22 To use a file to supply the Excluded Peaks, click the Browsebutton next to Excluded Peaks File, select the name of the .csvfile that contains the excluded peaks, and click the Open button.The path and name of the file displays in the text box.23 Click the Start button to start the assay. A new workspaceopens to display the data.See “Monitoring the Run” on page 27 for information about viewingdata during the run.P/N 127170 Rev. 00 <strong>LabChip</strong> <strong>GX</strong> <strong>User</strong> <strong>Manual</strong> Caliper Life Sciences, Inc.
Operation 26Select the Auto Export SettingsThe Auto Export settings specify which views to automaticallyexport at the end of each run and specifies the format for each view.Click the Auto Export Settings button in the Output Tab on theStart Run Window to open the Export Window.To select the desired views to export:1 Select the check boxes next to the views to export. SelectingExport All selects all check boxes.2 For each selected view, to change the location for the files, clickthe Browse (...) button and select the desired location.3 If Raw Data is selected, click the AIA Format check box toexport in Chromatography Data Interchange Format or clear thecheck box to export in .CSV format. If .CSV is selected:• Select Include Size Data to align the data to the well'sladder (for one file per well) or to the first well (for a singledata file) and include the size data in the exported data.• Select Export Single Table to export the data for all wells inthe plate to one .CSV file. If not selected, the data from eachwell is exported to a separate .CSV file.4 If Gel is selected:abcSelect either Single File to include gels for all wells in therun in the same image file, or select Separate Files toexport each gel to a separate image file.To adjust the contrast minimum and maximum values for allgels to a specific lane in the gel, choose the desired well inthe Contrast Lane drop-down list. (Only available after thesample wells have been selected on the Run tab.)If desired, change the height, in pixels, of the exported gelgraphics in the Height text box.5 If either Electropherogram or Gel is selected, choose thedesired format for the image files.6 Click OK to save the Export settings. The specified files will beexported at the end of the run.P/N 127170 Rev. 00 <strong>LabChip</strong> <strong>GX</strong> <strong>User</strong> <strong>Manual</strong> Caliper Life Sciences, Inc.
Operation 27Monitoring the RunThe following occurs after a run is started in the <strong>LabChip</strong> <strong>GX</strong>software:1 The priming and warming steps are performed.• The priming step fills the channels of the chip with reagent.(Only performed if the chip holder has been opened sincethe last run.)• The warming step allows the heater plate located in the chipholder to regulate chip temperature to 30°C.• Data collection begins after the warming and priming stepsare completed.2 After the run begins, the Start button on the <strong>LabChip</strong> <strong>GX</strong> mainwindow changes to Stop.3 The Active Data Tab displays the electropherogram of the wellcurrently being read. Data is saved to a file with the nameshown above the plate diagram after each well is completed.4 To view the results for individual wells as data is acquired orafter the run is finished, click a well in the Plate View or PlateList, a sample name in the Well Table View, or a lane in the GelView. Data from the selected well displays in the OverlayElectropherograms Tab and the Peak Table View.For more information on data analysis, see “Data Analysis” onpage 35.5 To stop the run before it is complete, see Stopping a Run.6 When the assay is complete, Run Successfully Completeddisplays in the Status line.7 If desired, remove the plate and/or remove the chip.To save the analyzed data:1 Select File Save Workspace. The Save Workspace AsWindow opens with the default workspace name as the name ofthe data file.2 If desired, change the location and/or the name of theworkspace file and click the Save button. (Workspace files havea .gxw file extension.)To view or re-analyze the data, see Data Analysis.P/N 127170 Rev. 00 <strong>LabChip</strong> <strong>GX</strong> <strong>User</strong> <strong>Manual</strong> Caliper Life Sciences, Inc.
Operation 28Stopping a RunIf you need to stop the run before it is complete, click the Stopbutton.A message box confirms that you want to stop the run in progress.Click Yes to stop the run. The Status line displays Run Aborted by<strong>User</strong>.Data for any completed wells displays in the <strong>LabChip</strong> <strong>GX</strong> MainWindow.To continue to read wells from an aborted run, see Continuing aStopped Run.P/N 127170 Rev. 00 <strong>LabChip</strong> <strong>GX</strong> <strong>User</strong> <strong>Manual</strong> Caliper Life Sciences, Inc.
Operation 29Continuing a Stopped RunIf a run is stopped before it is complete, you can restart the run tofinish the reading the plate. When you select the wells for the assay,you should select only the wells that were not read so that thereading starts with the well that was not completed.To continue a run:1 Click Start in the upper-left corner of the main window to openthe Start Run Window.2 Select the wells that were not read in the previous run,beginning with the well that was in progress when the run wasstopped.3 Select the same options for this run as were selected for thestopped run.4 Click the Start button to begin.The run starts with the well that was not completed in the previousrun. A separate data file is created for the current run.P/N 127170 Rev. 00 <strong>LabChip</strong> <strong>GX</strong> <strong>User</strong> <strong>Manual</strong> Caliper Life Sciences, Inc.
Operation 30Saving Data FilesWhile running an assay, the raw time series data received from theinstrument is automatically saved to the data file (.gxd), one well ata time as each well is completed. If a run is stopped before it iscomplete, the data for the completed wells is saved in the data file.The name of the data file is specified in the Output Tab on the StartRun Window.The analysis settings for a plate are saved at the end of the data file(.gxd). If analysis settings are changed in the Assay AnalysisWindow and the data file is saved, the new settings are added tothe end of the data file, but the previous settings are notoverwritten. This enables a plate to be restored to previous analysissettings using the Restore Plate button in the Assay Analysiswindow.If the 21 CFR Part 11 option is installed, data files are saved in theCentralized Data Repository (CDR). The CDR is a secure folderthat can only be accessed by the <strong>LabChip</strong> <strong>GX</strong> software. Thelocation of the CDR is specified in the CDR Utility Window.Updated analysis settings are saved when the plate data file issaved. To save the data file, either:• select Workspace Save Plate on the Menu Bar,• right-click on the plate name in the Plate View and select SavePlate, or• select File Save Workspace or File Save Workspace Ason the Menu Bar. (See Saving Workspace Files for moreinformation.)If the 21 CFR Part 11 option is installed and Require Signature onFile Update is selected in the Set Policies tab on the <strong>User</strong>Administration Window, the user must have signature rights to savean updated data file.To save the data file when the 21 CFR Part 11 option is installedand Require Signature on File Update is selected:1 The Perform Signature Window opens when you save a datafile.2 Select the name of the user who is signing the data file in the<strong>User</strong>name drop-down list.3 Type a Comment that meets the requirements of thecompliance policies.4 Type the <strong>User</strong> Password for the signing user.P/N 127170 Rev. 00 <strong>LabChip</strong> <strong>GX</strong> <strong>User</strong> <strong>Manual</strong> Caliper Life Sciences, Inc.
Operation 31Saving Data Files (Continued)5 Click the Sign button. The Signature Performed windowconfirms that the signature has been performed.6 Click the OK button. The signature is recorded in the data file.NOTEChanging the analysis settings and saving the plate data file doesnot change the raw data from the run; Only the display of the data ischanged.If you change the analysis settings without saving the new settings,and then try to close the workspace, exit the software, or acquirenew data, you are prompted to save the changes. Selecting Yesopens the Save Workspace As Window.Saving Workspace FilesWhen viewing plate data in the <strong>LabChip</strong> <strong>GX</strong> main window, you viewthe selected data files in a Workspace. When a new run starts, anew blank workspace opens, which contains the data file for theplate in the run. After the run is complete, saving the workspacesaves the data file with the current analysis settings. (See SavingData Files for more information on the contents of the data files.)The Data Files are not saved in the Workspace file. The workspacefile contains links to the revision of the data file that was last open inthe collection. If a Workspace file is moved to another folder orcomputer, the data files must be moved with the Workspace file.The data files must be in the same location relative to theWorkspace file as they were, otherwise you are prompted to find themissing data files when you open the Workspace file. It is a goodpractice to save the workspace files in the same location as thedata files that are included in the workspace.Saving a Workspace file automatically saves any changes to thedata files that are open in the workspace, and the settings for eachcollection in the workspace.If the 21 CFR Part 11 option is installed, saving Workspace filesdoes not require permission to save data files unless the data filesin the workspace have been modified.P/N 127170 Rev. 00 <strong>LabChip</strong> <strong>GX</strong> <strong>User</strong> <strong>Manual</strong> Caliper Life Sciences, Inc.
Operation 32Adding a New PlateWhen using a plate other than the plates specified in the Start RunWindow, you must create a new plate in the Plate InformationWindow. Use caution adding new plates. Entering wrong values inthe Add Plate Window can result in damaged chips and brokensippers.It is best to use the plate specifications provided by the platemanufacturer. If the specifications are not available, measure theplate with a caliper. Many plates have a large variation in the Z-axislocation of the well bottom.Make sure the Sip Height has enough margin to accommodate thisvariation:• Minimum Sip Height is 2.5mm.• Maximum Sip Height depends on the sample volume.• Sip Height of 4mm is probably safe.To add a new plate:1 Select Tools Plate Editor to open the Plate InformationWindow.2 Click the Custom Plates tab.3 Click the Add Plate button. The Add Plate Window opens.4 Type the settings for the new plate. The diagram on the AddPlate window shows the location for each measurement.Acceptable plate parameters are:• PlateHeight: 0 to 16mm• WellDepth: 0 to 36mm• SipHeight >= 2mm• (WellDepth – SipHeight)
Operation 33Adding a New Plate (Continued)• The instrument will move to five wells in each corner of theplate, punching holes in the ParaFilm.• The Punch test is acceptable if the punched hole is >0.5mmfrom the edge of the well.• Holes will never be perfectly centered.Possible sources of errors:• Sipper splay• Plate tolerances• Robot alignment error• If the holes are too close to the edge (
Operation 34Placing the Barcode on the PlateFigure 4 shows the size limits for the barcode label and the locationon the microplate where the label should be placed. The barcodemust be located on the short (portrait) end of the microplate, closestto well A1. If the barcode is not positioned properly, the barcodereader will not be able to read the barcode.Figure 4. Barcode Label PositionP/N 127170 Rev. 00 <strong>LabChip</strong> <strong>GX</strong> <strong>User</strong> <strong>Manual</strong> Caliper Life Sciences, Inc.
Data Analysis 35Data AnalysisAfter a run is complete, use the <strong>LabChip</strong> <strong>GX</strong> software to view andanalyze the plate data. The <strong>LabChip</strong> <strong>GX</strong> software can open multipledata files in the same workspace to compare the data from differentplates. Analysis settings can be changed for single wells, entireplates, or all plates in the workspace.This section contains the following information:• How the Software Analyzes DNA Data• How the Software Analyzes Protein Data• How the Software Analyzes RNA Data• How the Software Analyzes Glycan Data• Organizing, Retrieving, and Backing Up Data Files• Opening a New Workspace• Opening a Data File• Adding a Collection to a Workspace• Selecting the Wells in a Collection• Using Sample Name Files• Using Expected Fragments/ Expected Proteins/ ExpectedGlycans• Modifying Analysis Parameters• Saving and Exporting Assays• Changing the View of the Results• Copying Information• Reanalyzing a Data File• Printing Workspace Information• Exporting DataP/N 127170 Rev. 00 <strong>LabChip</strong> <strong>GX</strong> <strong>User</strong> <strong>Manual</strong> Caliper Life Sciences, Inc.
Data Analysis 36How the Software Analyzes DNA DataThe <strong>LabChip</strong> <strong>GX</strong> DNA Assay Analysis calculates the size andconcentration of nucleic acid fragments. Results for each well arecalculated after all data for that well has been read.The data analysis process for DNA assays consists of the followingsteps:1 Raw data is read and stored by the system for each individualwell.2 The data is filtered (see “Data Filtering” on page 251) and theresulting electropherograms of all wells are plotted.3 Peaks are identified (see “Peak Identification” on page 260) forall wells and are tabulated by migration time. The settings of thepeak find algorithm can be changed and the data can bereanalyzed after the run has finished. (See “Reanalyzing a DataFile” on page 81.) The peak find settings can be changed for allor only certain wells.4 A sizing ladder (see Figure 5), which is a mixture of DNAfragments of different known sizes, is run first from the laddervial. The concentrations and sizes of the individual base pairsare preset in the assay and cannot be changed.Figure 5. Ladder Graph - DNAP/N 127170 Rev. 00 <strong>LabChip</strong> <strong>GX</strong> <strong>User</strong> <strong>Manual</strong> Caliper Life Sciences, Inc.
Data Analysis 37How the Software Analyzes DNA Data(Continued)5 The ladder is analyzed (see “Ladder Analysis” on page 257) anda standard curve of migration time versus DNA size is plottedfrom the DNA ladder by interpolation between the individualDNA fragment size/migration points. The standard curve derivedfrom the data of the ladder well should resemble Figure 6.Figure 6. Standard Curve Window - DNA6 Two DNA fragments are run with each of the samples,bracketing the DNA sizing range. The Lower Marker and UpperMarker are internal standards used to align the ladder data withdata from the sample wells. Figure 7 shows an example ofassigned marker peaks in a sample well.Figure 7. Markers - DNAP/N 127170 Rev. 00 <strong>LabChip</strong> <strong>GX</strong> <strong>User</strong> <strong>Manual</strong> Caliper Life Sciences, Inc.
Data Analysis 38How the Software Analyzes DNA Data(Continued)NOTEThe software performs alignment by default. Turning alignment offsuspends data evaluation until you turn it on again.7 The standard curve and the markers are used to calculate DNAfragment sizes for each well from the migration times measured.8 To calculate the concentration of the individual DNA fragmentsin all sample wells, the upper marker, in conjunction with acalibration curve plotting assay-specific concentration againstbase-pair size, is applied to the individual sample peaks in allsample wells.NOTEThe software allows you to define upper and lower markers.Changing the markers causes quantitative changes in thecalibration procedure, however, and therefore in the entire dataevaluation.How the Software Analyzes Protein DataProtein assays are only supported on <strong>LabChip</strong> <strong>GX</strong> II instruments.The <strong>LabChip</strong> <strong>GX</strong> Protein Assay Analysis consists of the followingsteps:1 Raw data is read and stored by the system for each individualwell.2 The data is filtered (see “Data Filtering” on page 251), a spikerejectionalgorithm is performed, and the resultingelectropherograms of all wells are plotted.3 Peaks are identified (see “Peak Identification” on page 260) forall wells and are tabulated by migration time. The settings of thepeak find algorithm can be changed and the data can bereanalyzed after the run has finished. (See “Reanalyzing a DataFile” on page 81.) The peak find settings can be changed for allor only certain wells.P/N 127170 Rev. 00 <strong>LabChip</strong> <strong>GX</strong> <strong>User</strong> <strong>Manual</strong> Caliper Life Sciences, Inc.
Data Analysis 39How the Software Analyzes Protein Data(Continued)4 A sizing ladder (see Figure 8), which is a mixture of proteinfragments of different known sizes, is run from the ladder vialbefore and after every 12 samples. The sizes of the individualproteins (in kDa) are preset in the assay and cannot bechanged.Figure 8. Ladder Graph - Protein5 The ladder is analyzed (see “Ladder Analysis” on page 257) anda standard curve of migration time versus mobility is plottedfrom the ladder by interpolation between the individual proteinsize/migration points. The standard curve derived from the dataof the ladder well should resemble the Figure 9.P/N 127170 Rev. 00 <strong>LabChip</strong> <strong>GX</strong> <strong>User</strong> <strong>Manual</strong> Caliper Life Sciences, Inc.
Data Analysis 40How the Software Analyzes Protein Data(Continued)Figure 9. Standard Curve - Protein6 A Lower Marker is the internal standard used to align the ladderdata with data from the sample wells. Figure 10 shows anexample of the assigned Lower Marker peak (marked LM) in asample well.Figure 10. Markers - ProteinP/N 127170 Rev. 00 <strong>LabChip</strong> <strong>GX</strong> <strong>User</strong> <strong>Manual</strong> Caliper Life Sciences, Inc.
Data Analysis 41How the Software Analyzes Protein Data(Continued)NOTEThe software performs alignment by default. Turning alignment offsuspends data evaluation until you turn it on again.7 Before calculating either the protein size or concentration, thesample data is processed relative to the two ladders thatbracket every 12 samples. First, all of the data is aligned to thelower marker and then stretched, relative to the highestmolecular weight protein in the ladder.8 The concentration of the sample proteins is determined relativeto the bracketed ladders. There are seven proteins in the ladder(not including the lower marker). The ladder concentration isspecified in the assay and cannot be changed. View the settingson the Analysis Tab of the Assay Analysis Window (seepage 156).NOTES• The seven proteins are assumed to represent the averagestaining behavior of proteins and are used to determine anaverage peak area per g/mL of protein. This factor is used toconvert sample peak areas into relative concentration. The totalrelative concentration of all proteins is calculated by addition ofthe relative concentration of the individual proteins and isdisplayed in the Well Table View (see page 140).• Since the conversion factor is determined for each ladder, thefactor can be linearly interpolated for each sample and thusaccount for any assay drift.• The software allows you to define the lower marker. Changingthe selection of the marker will lead to quantitative changes inthe calibration procedure, and therefore in the entire dataevaluation.P/N 127170 Rev. 00 <strong>LabChip</strong> <strong>GX</strong> <strong>User</strong> <strong>Manual</strong> Caliper Life Sciences, Inc.
Data Analysis 42How the Software Analyzes RNA DataThe <strong>LabChip</strong> <strong>GX</strong> RNA Assay Analysis determines the quality of theRNA sample by measuring the relative amounts of know RNAfragments relative to the total RNA present in the sample. Resultsfor each well are calculated after all data for the well has been read.The data analysis process for RNA assays consists of the followingsteps:1 Raw data is read and stored by the system for each individualwell.2 The data is filtered (see “Data Filtering” on page 251) and theresulting electropherograms of all wells are plotted. A curvespline fit to the data is performed to generate a baseline abovewhich RNA fragment peaks are detected. This baseline isdisplayed as a blue line on the electropherogram when ShowPeak Baselines is selected in the Graph View Properties (seepage 134). The filtering algorithm settings can be changed andthe data can be reanalyzed after the run is finished. (See“Reanalyzing a Data File” on page 81.)3 Peaks extending above the baseline are identified (see “PeakIdentification” on page 260) for all wells and are tabulated bymigration time. The settings of the peak find algorithm can bechanged and the data can be reanalyzed after the run hasfinished. The peak find settings can be changed for all or onlycertain wells.4 A sizing ladder (see Figure 11), which is a mixture of RNAfragments of different known sizes, is run first from the laddervial. The concentrations and sizes of the individual nucleotidespresent in the ladder are predetermined by the assay andcannot be changed.P/N 127170 Rev. 00 <strong>LabChip</strong> <strong>GX</strong> <strong>User</strong> <strong>Manual</strong> Caliper Life Sciences, Inc.
Data Analysis 43How the Software Analyzes RNA Data(Continued)Figure 11. Ladder Graph - RNA5 The ladder is analyzed (see “Ladder Analysis” on page 257) anda standard curve of migration time versus RNA size is plottedfrom the RNA ladder by interpolation between individual RNAfragment size/migration points. The standard curve derived fromthe data of the ladder well should resemble Figure 12.Figure 12. Standard Curve - RNAP/N 127170 Rev. 00 <strong>LabChip</strong> <strong>GX</strong> <strong>User</strong> <strong>Manual</strong> Caliper Life Sciences, Inc.
Data Analysis 44How the Software Analyzes RNA Data(Continued)6 A dye matching the lowest peak in the ladder is run with each ofthe samples. This lower marker, labeled LM in the RNA sample(see Figure 13) is used to align the ladder data with data fromthe sample wells.NOTEFigure 13. Markers - RNAThe software performs alignment by default. Turning alignment offsuspends data evaluation until you turn it on again.7 The standard curve and the markers are used to calculate RNAfragment sizes for each well from the migration times measured.P/N 127170 Rev. 00 <strong>LabChip</strong> <strong>GX</strong> <strong>User</strong> <strong>Manual</strong> Caliper Life Sciences, Inc.
Data Analysis 45How the Software Analyzes RNA Data(Continued)8 The Total RNA present is computed by finding the area underthe electropherogram trace. The baseline for this integration is astraight line starting at the end of the lower marker and endingat the baseline end time. The height of the baseline endpoints iscomputed from an average of a five second window around thebaseline Start Time and End Time (shown on the Peak FindTab). View the baseline by selecting Show Peak Baselines inthe Graph View Properties. Adjust the Start Time and End Timeby dragging the left (Start) and right (End) vertical dashed linesto areas that more properly reflect the signal baseline. (Rightclickin the graph, select Set Scale, and change the X axisMinimum and Maximum values if the start and end times are notshown in the graph.)Figure 14. Peak Baseline - RNA9 The Total RNA concentration in the sample is computed fromthe ratio of the RNA area in the sample to the RNA area in theladder multiplied by the ladder concentration specified in theassay.P/N 127170 Rev. 00 <strong>LabChip</strong> <strong>GX</strong> <strong>User</strong> <strong>Manual</strong> Caliper Life Sciences, Inc.
Data Analysis 46How the Software Analyzes RNA Data(Continued)10 Assay-defined RNA fragments are identified from the peaks inthe peak table. Fragments are located by finding the largestpeak within a size range associated with the fragment. ForEukaryote RNA assays, 5S, 18S and 28S fragments arelocated. For Prokaryote assays, 5S, 16S and 23S fragments areidentified.11 The following values are calculated for RNA assays:Fragment_Area: Area of each rRNA Fragment.%_of_Total_Area: Each Fragment area as a percent of totalarea.Corrected RNA Area: Total RNA Area corrected with LowerMarker height.RNA Concentration (ng/ul): Estimated Total RNAConcentration in the sample.rRNA Area Ratio [28S / 18S]: 28S area divided by 18S area.rRNA Height Ratio [28S / 18S]: 28S height divided by 18Sheight or 23S height divided by 16S height.rRNA Fast Area Ratio: Region between 5S and 18S or 16S,percent of total area.RNA quality metrics: rRNA Area and Height Ratios (28S/18Sor 23S/16S) and Fast/Total RNA area ratio are computed.Figure 15. rRNA Graph Analysis12 Messenger RNA Assay: The RNA contamination ratio iscomputed. This is the ratio of the area of all the fragments tototal RNA area.P/N 127170 Rev. 00 <strong>LabChip</strong> <strong>GX</strong> <strong>User</strong> <strong>Manual</strong> Caliper Life Sciences, Inc.
Data Analysis 47How the Software Analyzes Glycan DataGlycan assays are only supported on <strong>LabChip</strong> <strong>GX</strong> II instruments.The <strong>LabChip</strong> <strong>GX</strong> Glycan Assay Analysis consists of the followingsteps:1 Raw data is read and stored by the system for each individualwell.2 The data is filtered (see “Data Filtering” on page 251), a spikerejectionalgorithm is performed, and the resultingelectropherograms of all wells are plotted.3 Peaks are identified (see “Peak Identification” on page 260) forall wells and are tabulated by migration time. The settings of thepeak find algorithm can be changed and the data can bereanalyzed after the run has finished. (See “Reanalyzing a DataFile” on page 81.) The peak find settings can be changed for allor only certain wells.4 A sizing ladder (see Figure 16), which consists of multiples of abasic sugar molecule, is run from the ladder vial before and afterevery 12 samples. The simplest molecule is assigned a size unitof 1 CGU (Caliper Glucose Unit). The sequence of ladder peaksis assigned integer size values, providing a migration time tosize ruler for sizing other sugar molecules.Figure 16. Ladder Graph - Glycan5 The ladder is analyzed (see “Ladder Analysis” on page 257) anda standard curve of migration time versus mobility is plottedfrom the ladder by interpolation between the individualglycan/migration points. The standard curve derived from thedata of the ladder well should resemble Figure 17.P/N 127170 Rev. 00 <strong>LabChip</strong> <strong>GX</strong> <strong>User</strong> <strong>Manual</strong> Caliper Life Sciences, Inc.
Data Analysis 48How the Software Analyzes Glycan Data(Continued)Figure 17. Standard Curve - Glycan6 A Lower Marker is the internal standard used to align the ladderdata with data from the sample wells. Figure 18 shows anexample of the assigned Lower Marker peak (marked LM) in asample well.NOTEFigure 18. Markers - GlycanThe software performs alignment by default. Turning alignment offsuspends data evaluation until you turn it on again.P/N 127170 Rev. 00 <strong>LabChip</strong> <strong>GX</strong> <strong>User</strong> <strong>Manual</strong> Caliper Life Sciences, Inc.
Data Analysis 49How the Software Analyzes Glycan Data(Continued)7 The standard curve and the markers are used to calculateglycan sizes in each well from the migration times measured.8 The area under each peak is calculated.9 All the sample peak areas are added together and an area ratiois calculated for the %Area for each peak.NOTES• In Glycan assays, the lower marker does not precede all ladderpeaks but rather appears between the 6th and 7th ladder peak.The concentration of the lower marker has been madesufficiently large to avoid confusion with ladder peaks. Sincepeaks before the lower marker are ignored, the ladder peaksused for the sizing ruler range from 7 to 13 CGU.• The software allows you to define the lower marker. Changingthe selection of the lower marker will lead to quantitativechanges in the calibration, and therefore in the entire dataevaluation.P/N 127170 Rev. 00 <strong>LabChip</strong> <strong>GX</strong> <strong>User</strong> <strong>Manual</strong> Caliper Life Sciences, Inc.
Data Analysis 50Organizing, Retrieving, and Backing Up DataFilesAs you work in the <strong>LabChip</strong> <strong>GX</strong> software, it's a good practice toorganize the <strong>LabChip</strong> <strong>GX</strong> files.• Create a folder in which to save the data files. If desired, eachperson can save data files to their own subfolder to organize thedata files.• Save Workspace files in the same directory as the data files toprevent missing data files in the workspaces.• Review the files periodically, even if only one person uses the<strong>LabChip</strong> <strong>GX</strong> software. If you are not using the 21 CFR Part 11option, archive files you are no longer using but want to save toa backup disk, and discard unneeded files. Verify there isenough free space on the hard drive to save new plate datafiles.• Each user in the laboratory can specify a particular data filename prefix to easily differentiate data files.• A new folder can be created each day to store the data from allruns. To automatically create the folders, select the CreateDaily Sub-Directory check box on the Output Tab in the StartRun Window.Opening a New WorkspaceA workspace displays data from one or more plate data files fromthe same type of assay. Each workspace can contain one or moreCollections to display the data.To open a new workspace:1 On the menu bar, select File New Workspace. If changeshave been made to an open workspace, you are prompted tosave any unsaved changes. A blank workspace opens in the<strong>LabChip</strong> <strong>GX</strong> Main Window.To view data, see:• Opening a Data File• Adding a Collection to a Workspace• Selecting the Wells in a Collection• Modifying Analysis Parameters• Saving and Exporting AssaysP/N 127170 Rev. 00 <strong>LabChip</strong> <strong>GX</strong> <strong>User</strong> <strong>Manual</strong> Caliper Life Sciences, Inc.
Data Analysis 51Opening a Data FileOpen a data file to view the data, to compare the data to other datafiles in the same workspace, or to change analysis setting and viewthe reanalyzed data. Data files generated by the <strong>LabChip</strong> <strong>GX</strong>software have a .gxd file extension. Data files generated by the<strong>LabChip</strong> HT software, which have a .cla file extension, can also beopened in the <strong>LabChip</strong> <strong>GX</strong> software if the 21 CFR Part 11 option isnot installed.To open a data file:1 Open a new workspace (see page 50) or a workspace thatalready contains compatible data files.2 On the menu bar, select File Import Data File. If the 21 CFRPart 11 option is not installed, the Select a Data File Windowopens. If the 21 CFR Part 11 option is installed, the CDRManager Window opens.3 Select the name of the data file to open and click the Openbutton. The selected data file is imported into the openworkspace. Use Ctrl+click or Shift+click to select multiple files.• To select a .cla file, select CLA from the Files of Type dropdownlist in the Select a Data File window. The selected .clafile is converted to a .gxd file, and the new .gxd file isimported into the open workspace. The new .gxd data file issaved in the same folder as the original .cla file. Anychanges are saved to the .gxd file. The .cla file cannot bechanged.NOTEAfter the .cla file is converted to a .gxd file, use the .gxd file in anyworkspaces. Re-importing the same .cla file will over-write theexisting .gxd file and any analysis changes saved in the .gxd file willbe lost.4 If desired, right-click on the data file name in the Plate View orPlate List and select Rename Plate to change the name of theplate in the display. (The name of the data file does not change.)5 Select the desired wells to view in each collection in theworkspace (see page 53).6 See “Modifying Analysis Parameters” on page 62 for informationabout changing analysis parameters.P/N 127170 Rev. 00 <strong>LabChip</strong> <strong>GX</strong> <strong>User</strong> <strong>Manual</strong> Caliper Life Sciences, Inc.
Data Analysis 52Adding a Collection to a WorkspaceCollections are used to specify the wells selected for view in eachplate data file, the layout of the views in the Collection tab, and thedisplay properties for each view in each collection.To add a new collection to an open workspace:1 On the menu bar, select Collection New Collection. TheNew Collection Window opens.2 Select the desired option for creating the new collection:• Template - Opens a new collection with the same settingsas a saved collection template file.• Blank Collection - Opens a new template using the defaultcollection settings.• Current Collection - Opens a new template based on thecurrent settings in the currently open collection.3 If no plates are open in the collection, choose the desired AssayType for the collection: DNA, RNA, Protein, or Glycan. (Proteinand Glycan are only supported on <strong>LabChip</strong> <strong>GX</strong> II instruments.)Only data files from the selected assay type can be importedinto the workspace.4 If desired, type a new name for the collection in the Name textbox.5 Click the OK button to open the new collection.P/N 127170 Rev. 00 <strong>LabChip</strong> <strong>GX</strong> <strong>User</strong> <strong>Manual</strong> Caliper Life Sciences, Inc.
Data Analysis 53Selecting the Wells in a CollectionEach collection can display different wells or the same wells indifferent orders. To select the wells to display in a collection:1 Select the collection where the wells will be displayed.2 Using the plate diagram in the Plate View, select the wells todisplay as described below:Figure 19. Selecting Wells• Select individual wells by clicking on the well.• Select a block of wells by clicking and dragging around thedesired wells.• Select entire rows by clicking the row letter at the left of themicroplate.• Select an entire row and the corresponding ladder byclicking the row letter at the right of the microplate (only ifthe plate sip order is row-wise).• Select entire columns by clicking the column number at thetop of the microplate.• Select an entire column and any corresponding ladder byclicking the column number at the bottom of the microplate(only if the plate sip order is column-wise).• Select all the wells in the microplate by rows by clicking thedouble-arrow button in the top left corner of the microplate.• Select all the wells in the microplate by columns by clickingthe double-arrow button in the top right corner of themicroplate.• Select all ladder wells and microplate wells by clicking thearrow button at the bottom right corner of the microplate.• Select all ladder wells by clicking the “L” icon at the bottomleft corner of the microplate.• Clear individual wells by right-clicking on the well andselecting Remove Well.3 Save the workspace to save the wells selected in the collection.P/N 127170 Rev. 00 <strong>LabChip</strong> <strong>GX</strong> <strong>User</strong> <strong>Manual</strong> Caliper Life Sciences, Inc.
Data Analysis 54Using Sample Name FilesSample name files are used to import sample names into a data file.A sample name file can be selected in the Advanced Tab on theStart Run Window to assign the sample names and expected peaksas the assay is running. The sample name file can also containexpected peaks.After the run is complete, you can use the Sample Name EditorWindow to rename the samples or to import an existing samplename file. Sample name files are saved as .csv files and can beedited with a spreadsheet program such as Microsoft Excel.The Color, Name, and Display Property for an Expected Peakcannot be set in the Sample Name Editor window. When newExpected Peaks are created in the Sample Name Editor window,default values are assigned for these properties.To create a Sample Name file:1 Select Tools Sample Name Editor on the <strong>LabChip</strong> <strong>GX</strong> MainWindow. The Sample Name Editor Window opens.2 Modify the sample names as desired in the Sample Name Editorwindow.3 Enter any desired comments for the samples in the SampleComment column.4 For DNA, Protein, or Glycan assays, if desired, click the EditExpected Peaks check box and enter the desired ExpectedPeaks and Window (%) in the columns. Separate each peaksize or window value with a semi-colon (;). If only one Window% value is entered, the same value applies to all expectedpeaks. If multiple vales are entered, separated by semi-colons,each expected peak will use the corresponding Window value. Ifmore expected peaks are entered than Window values, the lastWindow applies to all remaining expected peaks in the list.5 Click the Export button, navigate to the desired location for thefile, type the desired name for the file, and click the Save button.P/N 127170 Rev. 00 <strong>LabChip</strong> <strong>GX</strong> <strong>User</strong> <strong>Manual</strong> Caliper Life Sciences, Inc.
Data Analysis 55To import the sample names into a data file:1 Open the data file in an open workspace in the <strong>LabChip</strong> <strong>GX</strong>Main Window.2 Select Tools Sample Name Editor on the <strong>LabChip</strong> <strong>GX</strong> MainWindow. The Sample Name Editor Window opens.3 Click the Import button, navigate to the file location, select thename of the .csv file that contains the sample names, and clickthe Open button.4 Click the Apply button in the Sample Name Editor window toapply the sample names to the active plate.Format of Sample Name File (.CSV Format)The Sample Names created in the Sample Name Editor Windowcan be exported to a .CSV file. A .CSV file can also be created inMicrosoft Excel or generated automatically with a LIMS to importthe Sample Names into the data file.Figure 20 shows a Sample Names file open in Microsoft Excel.Figure 20. Sample Name .CSV FileA Sample Name .CSV file must use the following format:Column A: The well label (A1 to P24). The wells labels can beentered in any order and do not need to cover the entire plate.Column B: The desired sample name for each well.Column C: A user comment to be added to the well properties.Column D: A list of Expected Peak sizes for the well. This list isseparated by semi-colons (;).P/N 127170 Rev. 00 <strong>LabChip</strong> <strong>GX</strong> <strong>User</strong> <strong>Manual</strong> Caliper Life Sciences, Inc.
Data Analysis 56Column E: The search window size for each Expected Peak incolumn D as a % (10 = +/-10% of Expected Peak size). If allExpected Peaks use the same window size, enter a single value;otherwise enter unique values as a semicolon separated list. Iffewer windows than EPs are entered, the last window applies to allremaining EPs in the list.Column F… Any higher columns are ignored.Applying Different Window Values to Expected Peaks of theSame Size in Different WellsOnly one Expected Peak of a particular size can exist in the assayanalysis settings. If the same Expected Peak size with a differentExpected Peak window is entered in the Sample Name window,only the first Expected Peak is created. All other Expected Peaks ofthe same size use the same window as the first Expected Peak. Toovercome this restriction, use Expected Peaks of slightly differentsizes; e.g. 200, 200.1, 200.2, etc. to apply different windows to thesame Expected Peak in different wells.Sample Name File Import ErrorsAny row in the .CSV file that does not match the expected formatand cannot be interpreted is ignored. If none of the rows can beinterpreted, usually because the first column does not contain thewell label, the following error message displays: “No rows foundmatching format: label, name, comment, EP, window.”P/N 127170 Rev. 00 <strong>LabChip</strong> <strong>GX</strong> <strong>User</strong> <strong>Manual</strong> Caliper Life Sciences, Inc.
Data Analysis 57Using Expected Fragments/ Expected Proteins/Expected GlycansYou can track expected DNA fragments (EFs), proteins (EPs), orGlycans (EGs) for the samples in a DNA, Protein, or Glycan assay,respectively. (Protein and Glycan assays are only supported on<strong>LabChip</strong> <strong>GX</strong> II instruments.) You enter the EFs, EPs, and EGs in theAssay Analysis Window.Entering EFs, EPs, or EGs in the Assay Analysis Window1 Select Analysis Analysis Settings on the Menu Bar. TheAssay Analysis Window opens.2 Click on the Expected Fragments/Proteins/Glycans Tab.3 Click in the bottom (empty) row in the table.4 In the column labeled Size, enter the size of the expectedfragment/protein/glycan in bp, kDa, or CGU, respectively.5 In the Window (%) column, if desired, change the tolerancevalue to allow for variations in the expectedfragment/protein/glycan size. This value is specified as apercent of the expected size for that fragment/protein/glycan.The default is 10% for DNA and protein, and 2.5% for Glycan.Note: If there are multiple peaks in the tolerance range, thelargest peak is labeled as the expected peak, even if it is not theexact size specified. To change the peak identified as anexpected peak, see “Forcing Expected Peaks” on page 59.6 A default color is automatically assigned. To change the color,click on the color block in the Color column and select thedesired color in the Color window.7 If desired, change the name shown in the Name column.8 If desired, change the Property Displayed in the Well Table.This setting specifies the property that will be displayed in theExpected Peak column for each expected peak listed in the WellTable View.9 For Protein assays only, to align the data to one or more specificpeaks, select the For Aligning check box. The data is realignedso the selected peaks match their aligned size. Note: Incorrectalignment settings can cause analysis errors.P/N 127170 Rev. 00 <strong>LabChip</strong> <strong>GX</strong> <strong>User</strong> <strong>Manual</strong> Caliper Life Sciences, Inc.
Data Analysis 5810 To apply the expected peak only to specific wells, click in theApply to Wells column. The Select Wells window opens. Click(or click and drag) to select the wells that you want to apply theexpected peaks to, and then click the OK button.11 To apply the EFs, EPs, or EGs to the active plate, click theApply button.12 To apply the EFs, EPs, or EGs to all plates in the workspace,click the Apply Global button.Exporting EFs, EPs, or EGs1 After the EFs, EPs, or EGs are entered in the ExpectedFragments/Proteins/Glycans Tab, click the Export button at thebottom of the window. The Export ExpectedFragments/Proteins/Glycans Window opens.2 Navigate to the desired location for the file, type the desiredname for the file in the File Name text box, and then click theSave button. A .GEP file is created to save the expected peaksettings.Importing EFs, EPs, or EGsAfter an Expected Peak file (*.GEP) has been exported, you canimport the settings into another plate or workspace.3 With the plate open in a workspace, in the ExpectedFragments/Proteins/Glycans Tab, click the Import button at thebottom of the window. The Import ExpectedFragments/Proteins/Glycan Table window opens.4 Navigate to the location of the file, select the name of the file toimport, and then click the Open button. The expected peaksettings are imported into the tab.5 To apply the EFs, EPs, or EGs to the active plate, click theApply button.6 To apply the EFs, EPs, or EGs to all plates in the workspace,click the Apply Global button.P/N 127170 Rev. 00 <strong>LabChip</strong> <strong>GX</strong> <strong>User</strong> <strong>Manual</strong> Caliper Life Sciences, Inc.
Data Analysis 59Forcing Expected PeaksIf there are multiple peaks in the tolerance range, the largest peakis labeled as the expected peak, even if it is not the exact sizespecified. If a different nearby peak should have been selected asthe expected peak, you can specify which peak is labeled theexpected peak.1 In the Graph View, right-click on the peak that should be labeledas the expected peak.2 On the shortcut menu, select Force Expected Fragment/Peakand then select the desired fragment or peak from the menu.To clear a forced peak and revert to the default expected peak,right-click on the forced expected peak and select Clear ForcedEP.Viewing the EFs/EPs/EGs in the Graph ViewExpected Fragments, Expected Proteins, and ExpectedGlycans are identified in the electropherogram by open trianglesover the peaks. The triangles are the same color as specified in theExpected Fragments/Proteins/Glycans Tab.To display the expected peak indicators in the Graph view:1 Click the Properties tab on the right side of the Graph view toopen the Graph View Properties.2 To view the size of all expected peaks, select ExpectedFragments, Expected Proteins, or Expected Glycan in one ofthe Annotation list boxes.Figure 21. Expected FragmentsP/N 127170 Rev. 00 <strong>LabChip</strong> <strong>GX</strong> <strong>User</strong> <strong>Manual</strong> Caliper Life Sciences, Inc.
Data Analysis 60Figure 22. Expected PeaksViewing the EFs/EPs/EGs in the Gel ViewExpected Fragments/Proteins/Glycans are indicated in the GelView by colored lines. The color of the line matches the colorspecified in the Expected Fragments/Proteins/Glycans Tab.To display the expected peaks in the Gel View:1 Click the Properties tab on the right side of the Gel View toopen the Gel View Properties.2 Select the Show Expected Peaks check box.To display the legend that identifies the colors and sizes of theexpected peaks:1 Click the Properties tab on the right side of the Gel View toopen the Gel View Properties.2 Select the Show Expected Peaks Legend check box.Figure 23. Expected Peaks LegendP/N 127170 Rev. 00 <strong>LabChip</strong> <strong>GX</strong> <strong>User</strong> <strong>Manual</strong> Caliper Life Sciences, Inc.
Data Analysis 61Viewing the EFs/EPs/EGs in the Well TableA column is added to the Well Table for each Expected Peakentered in the Expected Fragments/Proteins/Glycans Tab. Thecolumn displays the property selected in the Property Displayed inWell Table list in the Assay Analysis Window.Viewing the EFs/EPs/EGs in the Peak TableExpected Fragments, Expected Proteins, and ExpectedGlycans are identified in the Peak Table with the peak namedisplayed in the Type column.Figure 24. DNA Assay Peak TableP/N 127170 Rev. 00 <strong>LabChip</strong> <strong>GX</strong> <strong>User</strong> <strong>Manual</strong> Caliper Life Sciences, Inc.
Data Analysis 62Modifying Analysis ParametersSome analysis parameters can be changed in the software tomodify the data evaluation for sample analysis. The followingprocedures are included in this section:• Changing the Peak Find Parameters• Adding a Peak• Excluding a Peak• Merging Two Peaks• Selecting a Default Ladder• Using the Default Ladder for Alignment• Exporting the Default Ladder in an Assay• Clearing the Default Ladder in a Plate• Changing the Time Window for Analysis• Aligning or Unaligning the Marker PeaksThese settings can be changed after the run is complete or whenreanalyzing a previously saved data file.P/N 127170 Rev. 00 <strong>LabChip</strong> <strong>GX</strong> <strong>User</strong> <strong>Manual</strong> Caliper Life Sciences, Inc.
Data Analysis 63Changing the Peak Find ParametersAfter data filtering, the peak find algorithm locates the peaks andcalculates the local peak baselines. The algorithm begins by findingall the peaks above the noise threshold to determine the baseline,after which any peaks below the noise threshold are rejected. Alocal baseline is calculated for each peak to allow for baseline drift.The following Peak Find parameters can be changed:• Min Peak Height• Min Peak Width• Slope Threshold• Inflection Threshold• Start Time• End Time• Filter Width• Baseline PlateauTo change the Peak Find parameters for all wells:1 Select Analysis Analysis Settings to open the AssayAnalysis Window, and then click the Peak Find Tab.2 Change the parameters as necessary at the top of the window.3 Click the OK button to save the setting, reanalyze the data, andclose the window.Click the Apply button to apply the changes and reanalyze thedata, but keep the Assay Analysis window open.Click the Apply Global button the apply the settings to all platesin the workspace and reanalyze the data, but keep the AssayAnalysis window open.To change peak find settings for individual wells:1 Select Analysis Analysis Settings to open the AssayAnalysis Window, and then click the Peak Find Tab.2 In the Well drop-down list, select the well number that you wantto change the settings for.3 Change the settings at the bottom of the window under WellPeak Find Settings to change the settings for the selected well.4 Click the OK button to save the setting, reanalyze the data, andclose the window.Click the Apply button to apply the changes and reanalyze thedata, but keep the Assay Analysis window open.P/N 127170 Rev. 00 <strong>LabChip</strong> <strong>GX</strong> <strong>User</strong> <strong>Manual</strong> Caliper Life Sciences, Inc.
Data Analysis 64Adding a PeakExcluding a PeakYou can manually add a peak in a region where a peak has notbeen identified.1 In the Graph View, right-click at the top of the area where thepeak is to be added. The area must be outside any previouslyidentified peak and the cursor must be an up arrow.2 Select Add <strong>Manual</strong> Peak from the shortcut menu. A new peakcentered at the selected location is created.3 If necessary, adjust the Peak Baseline.You can exclude any peak or fragment from being used in theanalysis.To exclude a peak:1 In the Peak Table View, right-click on the peak to be excluded.2 Select Exclude Peak from the shortcut menu. The Type for thepeak changes to X (excluded), and the value is not used in theanalysis.3 Right-click on an Excluded Peak in the peak table and selectInclude Peak to include the peak in the data analysis.OR1 In the Graph View, right-click near the top of the peak to beexcluded.2 Select Exclude Peak from the shortcut menu. The Type for thepeak changes to X (excluded), and the value is not used in theanalysis.3 Right-click on an Excluded Peak in the Graph view and selectInclude Peak to include the peak in the data analysis.P/N 127170 Rev. 00 <strong>LabChip</strong> <strong>GX</strong> <strong>User</strong> <strong>Manual</strong> Caliper Life Sciences, Inc.
Data Analysis 65Merging Two PeaksIf the analysis has defined two separate peaks, the two distinctadjacent peaks can now be merged into one peak. This will includethe area of both peaks in the total concentration and %puritycalculations.To merge two adjacent peaks:1 Exclude one of the peaks from the analysis, following theprocedure “Excluding a Peak” on page 64.2 Verify that Show Peak Baselines is selected in the Graph ViewProperties.3 Click and drag the baseline of the remaining peak to include thearea under the excluded peak.Selecting a Default LadderFor DNA and RNA assays, a ladder in an assay can be defined asthe default ladder. The default ladder can be used as the ladder forwells on the plate, can be applied to all of the plates in the opencollection, or can be saved as the default ladder in a new assay.To set a specific ladder on a plate as the default ladder for the plate:1 With the plate data file open, select Analysis AnalysisSettings to open the Assay Analysis Window, and then click thePeak Find Tab.2 Under Well Peak Find Settings, in the Well drop-down list,select the ladder that will be defined as the default ladder.3 Click the Save as Default Ladder button. (The Save as DefaultLadder button only displays when a ladder is selected.)4 Click the Apply button to save the default ladder settings. TheAnalysis Tab displays the ladder data in the Default Ladder tableand the Markers table (see Figure 25 on page 66).P/N 127170 Rev. 00 <strong>LabChip</strong> <strong>GX</strong> <strong>User</strong> <strong>Manual</strong> Caliper Life Sciences, Inc.
Data Analysis 66Selecting a Default Ladder (Continued)Figure 25. Default Ladder Settings5 The Ladder Peak Time and Area settings can be changed in theDefault Ladder table, but default ladder peaks cannot be addedor deleted and the ladder peak sizes cannot be changed.6 The Marker Time, Height and Area can be changed in theMarkers table.7 Click the Apply button at the bottom of the window to save thechanges to the active plate. Click the Apply Global button toapply the default ladder settings to all open data files in thecollection. (This allows you to import the default ladder into aplate that does not include any good ladders on the plate.)8 See “Using the Default Ladder for Alignment” on page 67 toalign wells in the plate using the default ladder.P/N 127170 Rev. 00 <strong>LabChip</strong> <strong>GX</strong> <strong>User</strong> <strong>Manual</strong> Caliper Life Sciences, Inc.
Data Analysis 67Using the Default Ladder for AlignmentFor DNA and RNA assays, after the default ladder is selected for adata file, the default ladder must be assigned to the desired wells inthe plate.1 With the plate data file open, select Analysis AnalysisSettings to open the Assay Analysis Window, and then click theAlignment Tab.2 Select the Align Well Groups to Specified Ladder option.3 For each group of wells under Align Well Group, select DefaultLadder in the To Ladder column.4 Click the Apply button to apply the changes to the active datafile or click the Apply Global button to apply the changes to alldata files in the current collection.Exporting the Default Ladder in an AssayThe default ladder in a data file is included in the analysis settingsfor a new assay when the settings are exported as an assay.Exporting the assay enables you to use the default ladder in futureruns.1 After clicking the Apply or Apply Global button in the AssayAnalysis Window, the Export as Assay button displays.2 Click the Export as Assay button. The Export Assay Settingsfrom Plate to Assay File window opens.3 Select the desired location for the assay file, type the desiredname for the assay file, and click the Save button.4 Select the new assay in the Run Tab on the Start Run Window.The new data file will include the default ladder.Clearing the Default Ladder in a PlateTo delete the default ladder for a plate and return the alignment tothe ladder settings for the assay type:1 With the plate data file open, select Analysis AnalysisSettings to open the Assay Analysis Window, and then click theAnalysis Tab.2 Click the Clear Default Ladder button at the bottom of theDefault Ladder table.P/N 127170 Rev. 00 <strong>LabChip</strong> <strong>GX</strong> <strong>User</strong> <strong>Manual</strong> Caliper Life Sciences, Inc.
Data Analysis 68Changing the Time Window for AnalysisThe Start Time and End Time parameters in the Peak Find tabdefine the time window within which peaks are found.To change the Start Time and End Time parameters for all wells inthe open assay:1 Select Analysis Analysis Settings to open the AssayAnalysis Window, and then click the Peak Find Tab.2 Change the parameters as necessary.3 Click the OK button to save the setting, reanalyze the data, andclose the window.Click the Apply button to apply the changes and reanalyze thedata, but keep the Assay Analysis window open.Aligning or Unaligning the Marker PeaksTo perform data analysis for DNA, Protein, RNA, and Glycanassays, the <strong>LabChip</strong> <strong>GX</strong> software aligns marker peaks included inthe sample wells with markers from the ladder.• To view the raw data without analysis, choose Analysis TurnOff Analysis.• To re-enable analysis, choose Analysis Turn On Analysis.The default setting for this function is enabled. Turning off theanalysis displays the data without aligning the markers in the wellsand the ladders.Figure 26. Data Before and After AlignmentP/N 127170 Rev. 00 <strong>LabChip</strong> <strong>GX</strong> <strong>User</strong> <strong>Manual</strong> Caliper Life Sciences, Inc.
Data Analysis 69Upper and Lower Marker Peaks for DNA AssaysFor each DNA sample, the upper and lower marker peaks areassigned first and then the data is aligned so that the well markersmatch the ladder markers in time, allowing the size andconcentration of the sample peaks to be determined.For DNA assays, the first peak is assigned to be the lower markerand is then offset to match the lower marker in the ladder. Theupper marker is then assigned to the last peak in the sample well orto the peak nearest the ladder’s upper marker. The Upper Markerand Lower Marker are aligned to the ladder markers by resamplingthe well data in a linear stretch or compression using a point-topointfit.If the sample marker peaks are either more than twice as far apartor less than half as far apart as the ladder markers, they areassumed to be the wrong peaks, and analysis of the well stops,producing the error Marker peaks not detected.In DNA assays, the height of marker peaks is assay dependant.Ladder peaks are analyzed to calculate a marker peak thresholdthat is used to locate the marker peaks in the sample wells. If themarker peaks found using this calculated method fail to align withthose of a sample, the <strong>LabChip</strong> <strong>GX</strong> software will use the minimumpeak height threshold setting instead (if this value is lower than thevalue for the marker peak). For example, the calculated thresholdmight be too high to find the sample's markers if they happen to bevery small for some reason. Either no markers will be found or thewrong peaks will be assumed to be markers and these may notalign with the ladder markers. Consequently, the software attemptsto use the minimum peak height threshold that, if it is set lowenough, will catch the real markers, allowing the sample to align.If you get unexpected peaks in the ladder analysis or the markershave been set incorrectly, you can manually exclude peaks or set apeak to be used as a marker.NOTES• Excluding a peak or manually setting a peak to be an upper orlower marker for a DNA assay can cause errors with analysis.• You can move the boundary between the Peak Table and theGraph view up or down to increase or decrease the size of thePeak Table, making it possible to see all of the results at once.P/N 127170 Rev. 00 <strong>LabChip</strong> <strong>GX</strong> <strong>User</strong> <strong>Manual</strong> Caliper Life Sciences, Inc.
Data Analysis 70Right-clicking in the Peak Table View of a well of a DNA assayopens a shortcut menu with the following commands:• Include Peak (only for peak type “?”)• Exclude Peak• Force Lower Marker• Force Upper Marker• Add Expected PeakNOTEYou can also right-click on a peak in the Graph View to view thesame menu.Lower Marker Peaks in Protein or RNA AssaysFor each protein or RNA sample, the first peak in the sample isdesignated as the Lower Marker. After all lower markers areassigned, the data is aligned so that the well markers match theladder markers in time, allowing the size and concentration of thesample peaks to be determined.If there are unexpected peaks in the ladder analysis or if the markerhas been set incorrectly, you can manually exclude peaks or set apeak to be used as a marker.NOTES• Excluding a peak or manually setting a peak to be the lowermarker can cause analysis errors.• You can move the boundary between the Peak Table and theGraph view up or down to increase or decrease the size of thePeak Table, making it possible to see all of the results at once.Right-clicking in the Peak Table View of a well of a Protein or RNAassay opens a shortcut menu with the following commands:• Include Peak (only for peak type “Xsys” or “?”)• Exclude Peak• Force Lower Marker• Force Expected PeakP/N 127170 Rev. 00 <strong>LabChip</strong> <strong>GX</strong> <strong>User</strong> <strong>Manual</strong> Caliper Life Sciences, Inc.
Data Analysis 71Lower Marker Peaks in Glycan AssaysFor each Glycan sample, the lower marker is added to the samplesand ladders. The lower marker is identified because theconcentration is much higher than the sample or ladder. After alllower markers are assigned, the data is aligned so that the wellmarkers match the ladder markers in time, allowing the size andcorrected area of the sample peaks to be determined.If there are unexpected peaks in the ladder analysis or if the markerhas been set incorrectly, you can manually exclude peaks or set apeak to be used as a marker.NOTES• Excluding a peak or manually setting a peak to be the lowermarker can cause analysis errors.• You can move the boundary between the Peak Table and theGraph view up or down to increase or decrease the size of thePeak Table, making it possible to see all of the results at once.Right-clicking in the Peak Table View of a well of a Glycan assayopens a shortcut menu with the following commands:• Include Peak (only for peak type “Xsys” or “?”)• Exclude Peak• Force Lower Marker• Force Expected PeakP/N 127170 Rev. 00 <strong>LabChip</strong> <strong>GX</strong> <strong>User</strong> <strong>Manual</strong> Caliper Life Sciences, Inc.
Data Analysis 72Saving and Exporting AssaysAssays are created by Caliper and are included with the <strong>LabChip</strong><strong>GX</strong> software. The instrument and software settings used to runeach plate and to analyze the plate are contained in an assay (.asy)file, which is selected at the start of the run in the Start RunWindow. After each well is complete, the data is analyzed using theanalysis settings in the assay file. If the default analysis settingsoften need to be modified for more optimal analysis, a new assayfile can be created with the modified settings to be used onsubsequent runs.To save a modified assay:1 Run a plate with the original assay file.2 Modify the analysis settings for the plate as needed.3 Right-click on the plate title in the Plate View or Plate List, selectExport Assay, specify a name and location for the assay file,and click the Save button.-- OR --On the Assay Analysis Window, click the Export as Assaybutton, specify a name and location for the assay file, and clickthe Save button.4 When running the next plate, select the new assay file in theStart Run window.The procedure above can also be used to automatically include aset of expected peaks in the assay.Changing the View of the ResultsThe views in the <strong>LabChip</strong> <strong>GX</strong> Main Window can be customized todisplay data according to the preferences of the user. Theseoptions do not change the raw data but provide different means ofdisplaying the data.To change the view in the main window, see:• “Adjust Pane Widths” on page 75• “Show or Hide Views” on page 75• “Zoom In and Zoom Out” on page 76• “Viewing Graphs in the Overlay Electropherograms Tab” onpage 77• “Viewing Graphs in the Electropherograms Tab” on page 78• “Viewing Multiple Properties in the Well Table View” on page 79P/N 127170 Rev. 00 <strong>LabChip</strong> <strong>GX</strong> <strong>User</strong> <strong>Manual</strong> Caliper Life Sciences, Inc.
Data Analysis 73Viewing GelsTo compare the gels generated by the instrument, view the gels inthe Gel View.Figure 27. Gel ViewThe color, width, and contrast of the gels can be changed using theGel View Properties.To rearrange gels, click on the column header (well name) and dragthe well to the desired location. To hide a well, select the well andthen click the (X) button on the column header, or right-click on thewell in the Plate View or Plate List and select Remove Well.Viewing Zero BaselinesAll electropherograms produced with the instrument show someamount of background fluorescence. By default, the <strong>LabChip</strong> <strong>GX</strong>software enables the zero baseline function. To remove the zeroing,select Analysis Analysis Settings to open the Assay AnalysisWindow, click the Peak Find Tab, and select the None check boxunder Baseline Algorithm.P/N 127170 Rev. 00 <strong>LabChip</strong> <strong>GX</strong> <strong>User</strong> <strong>Manual</strong> Caliper Life Sciences, Inc.
Data Analysis 74Figure 28. Zero Baseline OnFigure 29. Zero Baseline OffP/N 127170 Rev. 00 <strong>LabChip</strong> <strong>GX</strong> <strong>User</strong> <strong>Manual</strong> Caliper Life Sciences, Inc.
Data Analysis 75Adjust Pane WidthsThe <strong>LabChip</strong> <strong>GX</strong> Main Window displays several different views ofthe data files open in the workspace. You can change the heightand width of the views to make the views smaller or larger.To adjust panes:Show or Hide Views1 Place the cursor over the edge of the pane that you want toadjust. The cursor changes to a line with arrows on each end.2 Click and drag up, down, left, or right. The pane is resized afteryou release the mouse button. The layout setting is saved aspart of the collection.3 To save the setting, save the workspace. To create newcollections with the same settings, the collection can be savedas a collection template (see “Collection Menu” on page 117).The views displayed in the <strong>LabChip</strong> <strong>GX</strong> Main Window can behidden to maximize other views in the main window.To hide a view:1 Select Collection Layout on the <strong>LabChip</strong> <strong>GX</strong> Main window.The Layout Options Window opens.2 Click on the location that is selected for the view to clear theselection. The view is hidden.3 If a location (Left, Right, or Bottom) does not contain any views,the pane closes and the remaining panes enlarge to fill thespace.Note: The Gel View is always displayed and cannot be hidden.To display a hidden view:1 Select Collection Layout on the <strong>LabChip</strong> <strong>GX</strong> Main window.The Layout Options Window opens.2 Click on the desired location for the hidden view (Left, Right, orBottom). If multiple views are displayed in the same location,use the tabs at the top of the location to switch between views.P/N 127170 Rev. 00 <strong>LabChip</strong> <strong>GX</strong> <strong>User</strong> <strong>Manual</strong> Caliper Life Sciences, Inc.
Data Analysis 76Zoom In and Zoom OutYou can zoom in and out on data displayed in the Gel View and theGraph View. The Graph View and the Gel view both zoom to thesame levels when either view is zoomed in.To zoom in:• Click and drag to enclose the region of interest. When yourelease the mouse button, the selected area enlarges to fill theview. In the Gel view, all lanes in the collection zoom to thesame level.• You can continue zooming in until you reach the maximummagnification (the graph will not zoom in any closer).To zoom out:• Right-click in the Graph view or Gel view and select Unzoom togo to the previous zoom setting or select Unzoom All to zoomout to the default view.For more information, see Viewing Graphs in the OverlayElectropherograms Tab.P/N 127170 Rev. 00 <strong>LabChip</strong> <strong>GX</strong> <strong>User</strong> <strong>Manual</strong> Caliper Life Sciences, Inc.
Data Analysis 77Viewing Graphs in the Overlay Electropherograms TabIf the Overlay Electropherograms Tab is not open, select Collection Layout on the <strong>LabChip</strong> <strong>GX</strong> Main Window, select the locationwhere you want to display the Overlay Electropherograms tab, andclick the Apply button. The Overlay Electropherograms tab opens.Figure 30. Overlay Electropherograms Tab with MultipleGraphsData from multiple wells can be overlaid in the same graph forvisual comparison. Click on one well, then hold down the CTRL keyand click on the additional wells to view in the graph. Each peakgraph is shown in a different color and line style with a legend at thetop of the window. You can remove wells from the overlay by CRTL+ clicking the corresponding wells (the bounding box disappears).To add samples to the Overlay Electropherograms Tab, Ctrl +click on the sample that you want to add in the Plate View or PlateList, Gel View, Well Table View, or Peak Table View. Selected wellsare identified by: dashed outlines around the selected gel lanes inthe Gel view, light blue wells in the Plate view, and dark gray rows inthe Well Table view and Peak Table view.To remove a specific sample from the graph, Ctrl + click on thesample that you want to remove in the Plate View or Plate List, GelView, Well Table View, or Peak Table View.To display only one sample in the Overlay Electropherograms tab,click on one sample in the Plate View or Plate List, Gel View, WellTable View, or Peak Table View.P/N 127170 Rev. 00 <strong>LabChip</strong> <strong>GX</strong> <strong>User</strong> <strong>Manual</strong> Caliper Life Sciences, Inc.
Data Analysis 78Viewing Graphs in the Electropherograms TabIf the Electropherograms Tab is not open, select Collection Layout on the <strong>LabChip</strong> <strong>GX</strong> Main Window, select the location whereyou want to display the Electropherograms tab, and click the Applybutton. The Electropherograms tab opens.Figure 31. Electropherograms Tab with Multiple GraphsData from multiple wells can be displayed in the same tab for visualcomparison. A separate graph for each well in the collection isdisplayed in the Electropherograms tab. The data file name andwell name display at the top of each graph. Use the scroll bar on theright side of the tab to scroll through the wells in the collection.Zooming in or out on one graph zooms all of the graphs in the tabto the same zoom level.To only display the wells selected in the Gel View or Well TableView, select the Graph Selected Gels Only check box in the GraphView Properties.To move the graphs in the tab, in the Gel View click and drag thewell to the desired position.To change the number of graphs displayed in the tab, select thedesired Maximum Graphs per Page value in the Graph ViewProperties.P/N 127170 Rev. 00 <strong>LabChip</strong> <strong>GX</strong> <strong>User</strong> <strong>Manual</strong> Caliper Life Sciences, Inc.
Data Analysis 79Viewing Multiple Properties in the Well Table ViewProperties for Expected Peaks and Smears display in the WellTable View. When entering the settings in the ExpectedFragments/Proteins/Glycans Tab or the Smear Analysis Tab on theAssay Analysis Window, the property to display in the well table isspecified in the Property Displayed in Well Table column.To display multiple properties for the same Expected Peak orSmear in the Well Table:1 In the Expected Fragments/Proteins/Glycans tab, or the SmearAnalysis tab, enter the properties for the expected peak orsmear, selecting one of the desired properties in the PropertyDisplayed in Well Table column.2 Click in the next row and type the same name as an existing EPor smear in the Name field of the table. The row willautomatically update with the same entries as the original row.The only field that can be changed is the Property Displayed inWell Table column.3 Change the Property to the desired selection.4 Repeat until all desired properties have been added to the table.5 Click the Apply button to display the new columns in the WellTable. Duplicate properties in the table will be removed whenthe settings are applied to the plate.P/N 127170 Rev. 00 <strong>LabChip</strong> <strong>GX</strong> <strong>User</strong> <strong>Manual</strong> Caliper Life Sciences, Inc.
Data Analysis 80Copying InformationThe Edit menu and some of the right-click pop-up menus offer thefollowing choices for copying information from the <strong>LabChip</strong> <strong>GX</strong>software for use with other applications, depending on theselection:• Copy Gel• Copy Lane• Copy Graph• Copy Rows to Clipboard• Copy Column to ClipboardChoosing any of these commands places a copy of the selecteditem on the computer's clipboard. You can then paste the item into aword processing, graphics, or other program.Choosing Copy Gel copies all of the wells displayed in the Gel Viewwith the labels as part of the graphic. To copy a gel, right-click in theGel View and choose Copy Gel.Choosing Copy Lane copies the selected well in the Gel View withthe labels as part of the graphic. To copy a gel, right-click in the GelView and choose Copy Lane.Choosing Copy Graph copies the graph displayed in the GraphView. The size of the image that is placed on the clipboard whencopying a graph is the same size as the graph displayed in thesoftware.Copying rows from the Peak Table View or the Well Table Viewplaces ASCII information from the selected row or rows on theclipboard. To copy a row or multiple rows, select the desired rows inthe table, right-click on one of the selected rows, and select CopyRows to Clipboard.Copying columns from the Well Table View is only available forcertain columns in the table. To copy a column, select a single cellin the column, right-click on the cell, and select Copy Column toClipboard.P/N 127170 Rev. 00 <strong>LabChip</strong> <strong>GX</strong> <strong>User</strong> <strong>Manual</strong> Caliper Life Sciences, Inc.
Data Analysis 81Reanalyzing a Data FileOccasionally you may need to open and view or reanalyze a datafile that was run and saved previously. The raw data values aresaved in the plate data file, along with the original analysis settingsthat were chosen for the run and any changed analysis settings.This enables you to reanalyze the data with new settings or to viewpreviously saved settings.The following analysis parameters can be changed:• Plate peak find settings and Well peak find settings (see“Changing the Peak Find Parameters” on page 63)• Sample names and comments (see “Using Sample Name Files”on page 54)• Add a Peak (see “Adding a Peak” on page 64)• Exclude peaks from analysis (see “Excluding a Peak” onpage 64)• Reassign upper/lower markers (see “Upper and Lower MarkerPeaks for DNA Assays” on page 69 or “Lower Marker Peaks inProtein or RNA Assays” on page 70)• Alignment or no alignment with ladder peaks (see “Aligning orUnaligning the Marker Peaks” on page 68)• Assay - you can save the changed settings under a new assayname, if desired (see “Saving and Exporting Assays” onpage 72)To reanalyze a data file:1 Open the workspace that contains the plate data (see page 50).2 Change the analysis parameters (see list above) as needed.3 When you click the Apply, Apply Global, or OK buttons in theAssay Analysis Window, the data is automatically re-analyzedand the updated information is displayed.4 To view previous analysis settings, click the Restore Platebutton at the bottom of the Assay Analysis window and selectthe version to view.P/N 127170 Rev. 00 <strong>LabChip</strong> <strong>GX</strong> <strong>User</strong> <strong>Manual</strong> Caliper Life Sciences, Inc.
Data Analysis 82Printing Workspace InformationChoosing File Print opens the Print Window to select theinformation to print from the open workspace. If the workspacecontains multiple collections, information from the active (selected)collection is printed.The header of each printout contains the workspace name, thecollection name, and the page number. The Footer of each printoutcontains the <strong>LabChip</strong> <strong>GX</strong> software version, the date that theworkspace was modified, and the print date.The following information can be printed for the open workspace:• Print All• Gel• Electropherogram• Overlay Electropherogram• Well Table• Peak TableSee below for descriptions of each option.Print AllThis option prints the results of the assay in all of the availableformats. The page layout depends on the options selected in PrintSettings.GelChoosing this option prints a gel image with the lanes marked bythe sample name.Figure 32. Printed GelP/N 127170 Rev. 00 <strong>LabChip</strong> <strong>GX</strong> <strong>User</strong> <strong>Manual</strong> Caliper Life Sciences, Inc.
Data Analysis 83ElectropherogramChoosing this option prints an individual electropherogram of eachof the selected wells.Overlay ElectropherogramFigure 33. Printed ElectropherogramChoosing this option prints one graph with the electropherogramsfor all of the selected wells overlaid onto a single graph.Figure 34. Printed Overlay ElectropherogramP/N 127170 Rev. 00 <strong>LabChip</strong> <strong>GX</strong> <strong>User</strong> <strong>Manual</strong> Caliper Life Sciences, Inc.
Data Analysis 84Well TableChoosing this option prints the columns displayed in the Well TableView. To change the columns that are printed or the order of thecolumns, change the columns in the Well Table View.• Selecting the Add Border check box prints the table with aborder around each cell in the table.• Selecting the Add Well Name as Header check box prints thewell name, well label, and sample name at the top of the page.• Selecting both the Well Table and the Peak Table prints eachwell on a separate page with the Well Table row at the top of thepage and the Peak Table for the well below it.Figure 35. Printed Well TableP/N 127170 Rev. 00 <strong>LabChip</strong> <strong>GX</strong> <strong>User</strong> <strong>Manual</strong> Caliper Life Sciences, Inc.
Data Analysis 85Peak TableChoosing this option prints the columns displayed in the Peak TableView. To change the columns that are printed or the order of thecolumns, change the columns in the Peak Table View.• Selecting the Exclude Marker check box removes all markersfrom the printout.• Selecting the Add Border check box prints the table with aborder around each cell in the table.• Selecting the Add Well Name as Header check box prints awell header (plate name, well name, and sample name) beforethe peaks in each well.• Selecting the Per Page or Per Well option for the ColumnHeader specifies whether the Peak Table column headers areprinted only at the top of each page (default), or if the headersare also printed at the beginning of each new well table.• Selecting both the Well Table and the Peak Table prints eachwell on a separate page with the Well Table row at the top of thepage and the Peak Table for the well below it.Figure 36. Printed Peak TableP/N 127170 Rev. 00 <strong>LabChip</strong> <strong>GX</strong> <strong>User</strong> <strong>Manual</strong> Caliper Life Sciences, Inc.
Data Analysis 86Exporting DataData from a Peak Table, Well Table, Gel, or Graph can be exportedautomatically and/or manually. Options selected for automaticexport do not affect manual export options, and vice versa.• To automatically export data during the run, select the desiredsettings in the Start Run Window as described in “Select theAuto Export Settings” on page 26.• To manually export data, see “Exporting Data <strong>Manual</strong>ly” onpage 89.Peak Tables, Well Tables, and Raw Data are exported to .CSV files,which can be imported into a spreadsheet program such asMicrosoft Excel.Gel and Graph data is exported to the selected image format.This section shows export examples for the following:• Peak Table• Raw Data• GelPeak TableASCII text file that contains the data in all columns in the PeakTable. Figure 37 is an example of part of a Peak Table file exportedfrom a DNA assay (data truncated for this example):Figure 37. Exported Peak TablePeaks that are excluded are not exported and are missing in theexported file. For example, if peaks 3, 5, and 7 are excluded, whenthe data is exported into Microsoft Excel, peaks 3, 5, and 7 are notincluded.P/N 127170 Rev. 00 <strong>LabChip</strong> <strong>GX</strong> <strong>User</strong> <strong>Manual</strong> Caliper Life Sciences, Inc.
Data Analysis 87Raw DataASCII text file that contains the signal data from the run as one fileper well or multiple wells in the same file. Note that data that isexported has been smoothed using the polynomial filter.In addition to exporting time and value information, you can chooseto export Size information. This information is determined based onaligned data and is used to correlate the peaks across different runsor from one row to another.When Include Size Data is not checked and only time and valuesare exported, the state of the analysis function (peaks aligned ornot aligned with the ladder data) determines whether or not datathat is exported is or is not aligned. The same is true for the ZeroBaseline function: if enabled, data that is exported is also zeroed tothe baseline.Below is an example of part of a raw data file exported from a DNAassay (header not included and data truncated in this example):DATATime, Size, Value0.000,-158.365,0.800.017,-158.269,0.860.033,-158.173,0.530.050,-158.077,0.630.067,-157.981,0.450.083,-157.885,0.280.100,-157.788,0.240.117,-157.692,-0.050.133,-157.596,-0.380.150,-157.500,-0.660.167,-157.404,-1.060.183,-157.308,-1.450.200,-157.212,-1.70…Raw data can also be exported in a Chromatography DataInterchange Format (formerly AIA format), which is used by somegraphical analysis software tools. The Include Size Data and ExportSingle Table options are not available with Chromatography DataInterchange Format.P/N 127170 Rev. 00 <strong>LabChip</strong> <strong>GX</strong> <strong>User</strong> <strong>Manual</strong> Caliper Life Sciences, Inc.
Data Analysis 88GelExports the selected gel(s) in the selected image format. Optionsare available to export the entire collection or only the selectedgels. Gels can be exported into the same image file or into separatefiles for each gel.Figure 38 shows multiple selected gels exported to the same imagefile.Figure 38. Exported GelP/N 127170 Rev. 00 <strong>LabChip</strong> <strong>GX</strong> <strong>User</strong> <strong>Manual</strong> Caliper Life Sciences, Inc.
Data Analysis 89Exporting Data <strong>Manual</strong>lyIf the workspace contains multiple collections, the data exported isfrom the active/selected collection.1 Open the file that you want to export the data from.2 Select Export from the File menu. The Export Window opens.3 Select the check boxes next to the views to export. SelectingExport All selects all check boxes.4 For each selected view, to change the location for the files, clickthe Browse (...) button and select the desired location.5 If Raw Data is selected, choose the desired export options:• Select the AIA Format check box to export inChromatography Data Interchange Format, which is used bysome graphical analysis software tools. The Include SizeData and Export Single Table options are not available withAIA Format.• Select Include Size Data to align the data to the well'sladder (for one file per well) or to the first well (for a singledata file) and include the size data in the exported data.• Select Export Single Table to export the data for all wells inthe plate to one .CSV file. If not selected, the data from eachwell is exported to a separate .CSV file.6 If Electropherogram is selected, select either EntireCollection to export a separate graph for each well in thecollection or select Selected Wells to export a separate graphfor only the selected wells.7 If Gel is selected, choose the desired export options:• Select either Entire Collection to export all of the wells inthe collection or select Selected Wells to export only thewells that are selected in the Gel view.• Select either Single File to include gels for all wells in thesame image file, or select Separate Files to export each gelto a separate image file.• If desired, change the height of the exported graphic in theHeight text box.8 If either Electropherogram or Gel is selected, choose thedesired format for the image files.9 Click OK to export the data to the specified location.P/N 127170 Rev. 00 <strong>LabChip</strong> <strong>GX</strong> <strong>User</strong> <strong>Manual</strong> Caliper Life Sciences, Inc.
Software Security 90Software SecurityA 21 CFR Part 11 Compliance option is available for the <strong>LabChip</strong><strong>GX</strong> software. This option ensures that assays, output data, analysissettings, event data, and backup data files are not available forediting or tampering. Data is stored in a secure folder on the localcomputer. To create and maintain the Audit Log and <strong>LabChip</strong> <strong>GX</strong>user accounts, Microsoft SQL Server 2005 Express is provided withthe <strong>LabChip</strong> 21 CFR Part 11 option.The following procedures are included in this section:“Locking and Unlocking the Software” on page 92“Managing <strong>User</strong> Accounts” on page 93• “Adding New <strong>User</strong>s” on page 94• “Changing <strong>User</strong> Information” on page 95• “Printing <strong>User</strong> Information” on page 96• “Activating and Deactivating <strong>User</strong> Accounts” on page 96• “Changing Access Rights” on page 97• “Printing Access Rights” on page 98• “Setting Policies for <strong>User</strong> Accounts” on page 99• “Printing <strong>User</strong> Policies” on page 100“Electronic Signatures” on page 101“Automatically Exporting Copies of Data Files” on page 102“Reverting to a Specific Data File Revision” on page 102“Audit Trail” on page 103• “Viewing the Audit Trail” on page 104• “Exporting the Audit Trail” on page 105“Central Data Repository (CDR)” on page 106• “CDR Security Suggestions” on page 106• “Creating New Data Folders” on page 107• “Moving Data Files into Folders” on page 107• “Deleting Data Folders” on page 107• “Hiding Data Files in the CDR Manager Window” on page 108• “Showing Hidden Data Files in the CDR Manager Window” onpage 108“Remote CDR Server Backup” on page 109• “Setting Up the Remote CDR Server” on page 109P/N 127170 Rev. 00 <strong>LabChip</strong> <strong>GX</strong> <strong>User</strong> <strong>Manual</strong> Caliper Life Sciences, Inc.
Software Security 91• “Backing Up Data Files to the Remote CDR” on page 111“Running Installation Qualification (IQ)” on page 112“Running Operational Qualification (OQ)” on page 112P/N 127170 Rev. 00 <strong>LabChip</strong> <strong>GX</strong> <strong>User</strong> <strong>Manual</strong> Caliper Life Sciences, Inc.
Software Security 92Locking and Unlocking the SoftwareThe <strong>LabChip</strong> <strong>GX</strong> software with the CFR option installed allows youto lock the <strong>LabChip</strong> <strong>GX</strong> software. This prevents unauthorized usersfrom accessing the software while you are away from the computer.After the software is locked, only the logged in user or a <strong>LabChip</strong><strong>GX</strong> Administrator can unlock the software.To lock the <strong>LabChip</strong> <strong>GX</strong> software:1 On the <strong>LabChip</strong> <strong>GX</strong> Main Window, click Security LockApplication. The Unlock Application Window opens on top ofthe <strong>LabChip</strong> <strong>GX</strong> Main Window and displays the <strong>User</strong>name of thecurrent user.Figure 39. Unlock Application WindowTo unlock the <strong>LabChip</strong> <strong>GX</strong> software:1 On the Unlock Application Window, type the user password forthe logged in user in the Password text box and click the OKbutton.2 If the password for the current user is not available, type a<strong>LabChip</strong> <strong>GX</strong> Administrator username and password in theUnlock Application Window and click the OK button. TheAdministrator is logged into the <strong>LabChip</strong> <strong>GX</strong> software.3 To change the user to a non-administrator user, close andrestart the <strong>LabChip</strong> <strong>GX</strong> software and then log in as the desireduser.P/N 127170 Rev. 00 <strong>LabChip</strong> <strong>GX</strong> <strong>User</strong> <strong>Manual</strong> Caliper Life Sciences, Inc.
Software Security 93Managing <strong>User</strong> AccountsAccess to the <strong>LabChip</strong> <strong>GX</strong> software is controlled by user nameswhen the 21 CFR Part 11 Security option is installed. Each usermust sign into the <strong>LabChip</strong> <strong>GX</strong> software. The user’s Access Levelcontrols which options are available for each user name.The following procedures are included in this section:• “Adding New <strong>User</strong>s” on page 94• “Changing <strong>User</strong> Information” on page 95• “Printing <strong>User</strong> Information” on page 96• “Activating and Deactivating <strong>User</strong> Accounts” on page 96• “Changing Access Rights” on page 97• “Printing Access Rights” on page 98• “Setting Policies for <strong>User</strong> Accounts” on page 99• “Printing <strong>User</strong> Policies” on page 100P/N 127170 Rev. 00 <strong>LabChip</strong> <strong>GX</strong> <strong>User</strong> <strong>Manual</strong> Caliper Life Sciences, Inc.
Software Security 94Adding New <strong>User</strong>sEach person who uses the <strong>LabChip</strong> <strong>GX</strong> should have a unique<strong>LabChip</strong> <strong>GX</strong> user account.To add a new user:1 On the <strong>LabChip</strong> <strong>GX</strong> Main Window, select Security <strong>User</strong> andSystem Administration. The <strong>User</strong> Administration Windowopens.2 Click the Create <strong>User</strong> button.3 Type the desired <strong>User</strong>name.4 Type the First, Middle, and Last Name for user.5 Type the user’s Position if desired.6 Select the Access Level for the user. The Access Levelcontrols which rights the user has. The following access levelsare available:• Restricted <strong>User</strong>• Operator• Supervisor• Administrator7 Type the desired <strong>User</strong> Password*.8 Type the <strong>User</strong> Password again.9 Select whether the user can perform a signature.10 Click the Save button.* Passwords must be at least 5 characters long and must contain atleast one uppercase letter and at least one number.P/N 127170 Rev. 00 <strong>LabChip</strong> <strong>GX</strong> <strong>User</strong> <strong>Manual</strong> Caliper Life Sciences, Inc.
Software Security 95Changing <strong>User</strong> InformationAfter a user account is created, the user details can be edited.To change the user information:1 On the <strong>LabChip</strong> <strong>GX</strong> Main Window, select Security <strong>User</strong> andSystem Administration. The <strong>User</strong> Administration Windowopens.2 Click the Edit <strong>User</strong>s button.3 Select the user to edit from the <strong>User</strong> drop-down list.4 Change the <strong>User</strong> Information as necessary:• First Name• Middle Name• Last Name• Position• Access Level• <strong>User</strong> Can Perform Signature• <strong>User</strong> Password5 Click the Save button to save the updated user information.P/N 127170 Rev. 00 <strong>LabChip</strong> <strong>GX</strong> <strong>User</strong> <strong>Manual</strong> Caliper Life Sciences, Inc.
Software Security 96Printing <strong>User</strong> InformationAfter editing a user account, the user details can be printed forrecord-keeping purposes.To print the user information:1 On the <strong>LabChip</strong> <strong>GX</strong> Main Window, select Security <strong>User</strong> andSystem Administration. The <strong>User</strong> Administration Windowopens.2 Click the Show <strong>User</strong> Info button.3 To print the information for a single user, select the user name inthe Select <strong>User</strong> to Display list box.4 To print the information for all users, select the Print All <strong>User</strong>scheck box.5 To preview the printout, click the Print Preview button.6 To print the selected information, click the Print button.Activating and Deactivating <strong>User</strong> AccountsIf a user name is not going to be used, the user account can bedeactivated. The user name is not removed from the system, butcannot be used to log into the <strong>LabChip</strong> <strong>GX</strong> software. <strong>User</strong> namescannot be deleted. A deactivated user name can be activated tocontinue to be used.1 On the <strong>LabChip</strong> <strong>GX</strong> Main Window, select Security <strong>User</strong> andSystem Administration. The <strong>User</strong> Administration Windowopens.2 Click the De/Activate <strong>User</strong> button.3 Select the <strong>User</strong>name in the Select <strong>User</strong> drop-down list.4 Click the Deactivate button.To reactivate a user name, select the deactivated user and click theActivate button to return the user to active status. The user namecan now log into the <strong>LabChip</strong> <strong>GX</strong> software.P/N 127170 Rev. 00 <strong>LabChip</strong> <strong>GX</strong> <strong>User</strong> <strong>Manual</strong> Caliper Life Sciences, Inc.
Software Security 97Changing Access RightsThe rights assigned to each Access Level control the actions that auser is allowed to perform in the <strong>LabChip</strong> <strong>GX</strong> software. The rightsapply to any user name assigned to the access level. Rights cannotbe assigned to an individual user name. The Define Access tab isnot available while an assay is running.To change the rights for an Access level:1 On the <strong>LabChip</strong> <strong>GX</strong> Main Window, select Security <strong>User</strong> andSystem Administration. The <strong>User</strong> Administration Windowopens.2 Click the Define Access button.3 Enable or Disable the desired rights for each Access Level:• <strong>User</strong> Administration - Allows users to create, edit, activateand deactivate users, or to change policies.• Run Assay - Allows users to run assays and save the newdata files that are created by the run. <strong>User</strong>s are notpermitted to save changes to existing data files.• Save Existing Data File - Allows users to save changes toexisting data files.• Save Workspace - Allows users to save new and existingworkspaces. If Save Existing Data Files is not selected,users can only save workspaces where the data files havenot changed.• Plate Editor - Allows users to add or edit plate dimensionsin the Plate database.• Hide/Show in CDR - Allows users to hide and show datafiles in the CDR.• Manage CDR Folders - Allows users to create, rename, anddelete folders in the CDR Manager window.This permissionis not required for automatically creating daily subdirectoriesor to move data files in the CDR.• Perform Validation - Allows users to perform IQ(Installation Qualifications) and OQ (OperationQualifications).• Print/Export Analysis Results - Allows users to print orexport analysis results.• Audit Trail Access - Allows users to view the Audit Trail inthe Audit Trail Window.• Assay Editor - Allows users to edit and save assays.4 Click the Save button.P/N 127170 Rev. 00 <strong>LabChip</strong> <strong>GX</strong> <strong>User</strong> <strong>Manual</strong> Caliper Life Sciences, Inc.
Software Security 98Printing Access RightsAfter changing the user rights, the access rights can be printed forrecord-keeping purposes.To print the access rights:1 On the <strong>LabChip</strong> <strong>GX</strong> Main Window, select Security <strong>User</strong> andSystem Administration. The <strong>User</strong> Administration Windowopens.2 Click the Define Access button.3 To preview the printout, click the Print Preview button.4 To print the selected information, click the Print button.P/N 127170 Rev. 00 <strong>LabChip</strong> <strong>GX</strong> <strong>User</strong> <strong>Manual</strong> Caliper Life Sciences, Inc.
Software Security 99Setting Policies for <strong>User</strong> Accounts<strong>User</strong> Account Policies specify properties such as password optionsand whether to require a signature when updating data files.1 On the <strong>LabChip</strong> <strong>GX</strong> Main Window, select Security <strong>User</strong> andSystem Administration. The <strong>User</strong> Administration Windowopens.2 Click the Set Policies button.3 Set the options as desired:• Password Expires After - The number of days until eachpassword expires. Range is 1 to 1000 days.• Number of Retired Passwords to Remember - <strong>User</strong>cannot reuse the specified number of old passwords. Rangeis from 0 to 5.• Minimum Password Length - The minimum length of eachpassword. Range is from 5 to 30 characters.• Maximum Login Attempts - The maximum number of timesthe user can attempt to log in before being locked out of the<strong>LabChip</strong> <strong>GX</strong> software. Range is from 3 to 20. This option canbe disabled to allow unlimited retries without locking the userout.• Minutes to Automatic Lock - The number of minutes thatthe software is inactive until the <strong>LabChip</strong> <strong>GX</strong> software locksautomatically. Range is from 5 to 4320 minutes (3 days). Todisable this option, clear the check box. To unlock thesoftware, see “Locking and Unlocking the Software” onpage 92.• Require Signature on File Update - If selected, anelectronic signature is required to save modified data files.Signatures can be performed by any user who has thePerform Signature option selected in the <strong>User</strong> AdministrationWindow.4 Click the Save button.P/N 127170 Rev. 00 <strong>LabChip</strong> <strong>GX</strong> <strong>User</strong> <strong>Manual</strong> Caliper Life Sciences, Inc.
Software Security 100Printing <strong>User</strong> PoliciesAfter changing the user policies, the user policies can be printed forrecord-keeping purposes.To print the user policies:1 On the <strong>LabChip</strong> <strong>GX</strong> Main Window, select Security <strong>User</strong> andSystem Administration. The <strong>User</strong> Administration Windowopens.2 Click the Set Policies button.3 To preview the printout, click the Print Preview button.4 To print the selected information, click the Print button.P/N 127170 Rev. 00 <strong>LabChip</strong> <strong>GX</strong> <strong>User</strong> <strong>Manual</strong> Caliper Life Sciences, Inc.
Software Security 101Electronic SignaturesBased on a company’s procedural requirements, creating andsaving data files may require a superior’s signature. If so, a userwith signature permissions must enter a valid username, password,and comment to explain the purpose of the signature. A signaturecan be added to the data file any time, except while the assay isrunning.NOTETo change user signature permissions, see “Changing <strong>User</strong>Information” on page 95.To electronically sign a data file:1 On the <strong>LabChip</strong> <strong>GX</strong> Main Window, click Security PerformSignature. The Perform Signature Window opens on top of the<strong>LabChip</strong> <strong>GX</strong> Main Window.2 Select the username of the user that is signing the data file inthe <strong>User</strong>name drop-down list.3 Type a comment describing the reason for the signature in theEnter Comment text box.4 Type the <strong>User</strong> Password for the signing user in the <strong>User</strong>Password text box.5 Click the Sign button. The Signature Performed window opensto confirm the signature was performed.6 Click the OK button in the Signature Performed window. ThePerform Signature window closes. Signature information isembedded in the data file and the signature is logged in theAudit Trail.P/N 127170 Rev. 00 <strong>LabChip</strong> <strong>GX</strong> <strong>User</strong> <strong>Manual</strong> Caliper Life Sciences, Inc.
Software Security 102Automatically Exporting Copies of Data FilesThe <strong>LabChip</strong> <strong>GX</strong> software provides the option of automaticallyexporting a copy of the data file (.gxd) to a folder outside the CDR.The data file is copied to the specified folder after the run iscomplete.To automatically export a copy of each data file:1 On the Output Tab on the Start Run Window, select the Copy Tocheck box.2 Click the Browse (...) button. The Browse for Folder Windowopens.3 Navigate to the folder where you want to save the exportedcopies of the data files.4 Click the OK button to choose the selected folder. The pathdisplays in the Copy To text box on the Output Tab.5 To continue setting the assay options in the Start Run Window,see “Running an Assay” on page 23.Reverting to a Specific Data File RevisionEach time a data file is changed, a new version of the data file iscreated and saved. The <strong>LabChip</strong> <strong>GX</strong> software enables you to revertto a previous version of a data file.To revert to a previous data file version:1 On the <strong>LabChip</strong> <strong>GX</strong> Main Window, select Analysis AnalysisSettings on the main menu. The Assay Analysis Windowopens.2 Click the Restore Plate button at the bottom of the window. TheRestore Plate Settings to Version window opens.3 Select the data file version that you want to restore to.4 Click the OK button. The Assay Analysis Window displays thesettings for the selected data file version.5 Click the OK button to display the data file with the selectedsettings.P/N 127170 Rev. 00 <strong>LabChip</strong> <strong>GX</strong> <strong>User</strong> <strong>Manual</strong> Caliper Life Sciences, Inc.
Software Security 103Audit Trail<strong>LabChip</strong> <strong>GX</strong> software uses secured, computer-generated, timestampedaudit trails to independently record the date and time ofoperator entries and actions that create, modify, or delete electronicrecords. The audit trails can be printed out for documentationpurpose. The audit trail documents can be made available foragency review and copying.The audit trail is a log of all of the following events that haveoccurred in the <strong>LabChip</strong> <strong>GX</strong> software:• Administration and user management (create/ edit / deactivateuser, policy settings, access level modifications, login and lockevents)• Data file run events (prime, run started, run finished, runstopped, run aborted, wash started, wash finished)• Data file signing events• Data file hide/show events• Instrument error events• Data file version changes• IQ events• Application errors related to main database failuresThis section includes the following Audit Trail procedures:• Viewing the Audit Trail• Exporting the Audit TrailP/N 127170 Rev. 00 <strong>LabChip</strong> <strong>GX</strong> <strong>User</strong> <strong>Manual</strong> Caliper Life Sciences, Inc.
Software Security 104Viewing the Audit TrailTo view events in the Audit Trail Log:1 On the <strong>LabChip</strong> <strong>GX</strong> Main Window, select Security AuditTrail Log. The Audit Trail Window opens.2 Select the desired data range:• Select whether to view most recent entries, entries betweenspecific dates, or the entire database.• Select the number of entries or dates to search if EntireDatabase is not selected.3 If desired, select a user name to view only events performed bya specific user.4 To view events for a specific data file, select the name of thedata file.5 To search only specific types of events select the desired EventCategory in the Event Category drop-down list. Default showsall events.6 To change the columns that are displayed, click the green arrowbutton next to Event Category and select or hide the desiredcolumns.7 Click the Search button to search the database.P/N 127170 Rev. 00 <strong>LabChip</strong> <strong>GX</strong> <strong>User</strong> <strong>Manual</strong> Caliper Life Sciences, Inc.
Software Security 105Exporting the Audit TrailThe events displayed in the Audit Trail Window can be exported to afile. The following formats are available:• Text• XML• ExcelTo export the events:1 On the <strong>LabChip</strong> <strong>GX</strong> Main Window, select Security AuditTrail Log. The Audit Trail Window opens.2 Click the Export button in the Audit Trail Window. The AuditTrail Export Window opens.3 Select the desired export file format.4 Click the Export button. The Save As window opens.5 Choose the desired location for the file, type the desired filename, and click the Save button.By default, the file name is ATexport__, where and are the current date and time.P/N 127170 Rev. 00 <strong>LabChip</strong> <strong>GX</strong> <strong>User</strong> <strong>Manual</strong> Caliper Life Sciences, Inc.
Software Security 106Central Data Repository (CDR)The Central Data Repository (CDR) is a protected folder located onthe local computer. All data files (.gxd) are saved in the default CDRfolder on the local computer. The CDR folder is protected fromchanges by unauthorized users. The CDR is only used when the 21CFR Part 11 option is installed.The CDR Manager Window enables you to organize data files intovirtual folders. The folders are not actually created in the CDRfolder on the local computer, but are displayed in the CDR ManagerWindow to organize the data files. The CDR Manager Windowenables you to create new folders, rename existing folder, anddelete empty folders.The following procedures are included in this section:• “CDR Security Suggestions” on page 106• “Creating New Data Folders” on page 107• “Moving Data Files into Folders” on page 107• “Deleting Data Folders” on page 107• “Hiding Data Files in the CDR Manager Window” on page 108• “Showing Hidden Data Files in the CDR Manager Window” onpage 108CDR Security SuggestionsTo ensure proper security of data files, the <strong>LabChip</strong> <strong>GX</strong>Administrator should:1 Change the <strong>LabChip</strong> <strong>GX</strong> Administrator password. Make sure tokeep a copy of the password in a safe place. This passwordcannot be reset if forgotten. To change the administratorpassword:• Log into the <strong>LabChip</strong> <strong>GX</strong> software as the administrator.• Select Security Change Password.• Type the current password.• Type the new password in both the New Password andConfirm Password text boxes.• Click the OK button.2 To enable remote CDR, install and set up the Remote CDRServer (see page 109), then start the CDR Utility and enableremote CDR Backup (see page 111).P/N 127170 Rev. 00 <strong>LabChip</strong> <strong>GX</strong> <strong>User</strong> <strong>Manual</strong> Caliper Life Sciences, Inc.
Software Security 107Creating New Data FoldersTo create a new CDR data folder:1 Select File Import Data File. The CDR Manager Windowopens.2 Click on the upper-level CDR folder.3 Click the New Folder button on the left side of the window. Anew folder named New Folder is created and the name isselected for update.4 Type the desired name for the folder and then press the Enterkey.5 Close the CDR Manager Window.Moving Data Files into FoldersDeleting Data FoldersTo move a data file into a CDR data folder:1 Select File Import Data File. The CDR Manager Windowopens.2 Click on the name of the data file.3 Drag and drop the file into the desired folder.4 Close the CDR Manager Window.To delete a CDR data folder:1 Select File Import Data File. The CDR Manager Windowopens.2 Verify the folder is empty.3 Click on the folder name.4 Click the Delete button on the left side of the window or at thetop of the window.5 Close the CDR Manager Window.P/N 127170 Rev. 00 <strong>LabChip</strong> <strong>GX</strong> <strong>User</strong> <strong>Manual</strong> Caliper Life Sciences, Inc.
Software Security 108Hiding Data Files in the CDR Manager WindowThe CDR Manager window enables users to hide or show specificdata files or folders in the CDR Manager window. This functionalitycan be used to reduce the number of data files displayed in theCDR Manager window when certain files or folders are not used.The user must have Hide/Show in CDR rights in the Define Accesstab in the <strong>User</strong> Administration Window.Hiding data files or folders does not change the data file or folder,they are just not displayed in the CDR Manager Window.To hide data files or folders:1 Select File Import Data File. The CDR Manager Windowopens.2 Select the name of the data file or folder that you want to hide. Ifyou select a folder name, all data files and folders in theselected folder will also be hidden.3 Click the Hide button on the left side of the CDR ManagerWindow.4 Close the CDR Manager Window.Showing Hidden Data Files in the CDR Manager WindowTo set hidden data files back to unhidden (show):1 Click the Show Hidden Files button at the top right of the CDRManager Window. All hidden files and folders show in the CDRManager window. The file or folder icon indicates if the file orfolder is hidden.2 Click the name of the file or folder that you want to show andclick the Show button on the right side of the CDR ManagerWindow.NOTEFiles and folders in a hidden folder do not show in the CDRManager Window, even if the files are not set to hidden. To showfiles, the folder cannot be set to hidden.3 Click the Hide Hidden Files button at the top right of the CDRManager Window.4 Close the CDR Manager Window.P/N 127170 Rev. 00 <strong>LabChip</strong> <strong>GX</strong> <strong>User</strong> <strong>Manual</strong> Caliper Life Sciences, Inc.
Software Security 109Remote CDR Server BackupThe <strong>LabChip</strong> <strong>GX</strong> software with the 21 CFR Part 11 option installedsupports backing up data files to a remote server using Subversion(SVN). Subversion is a third-party database application used tocopy data files to a remote server within the intranet. To use remotebackup, Subversion must be installed on the remote server usingthe CDRServerUtilitySetup.exe included on the <strong>LabChip</strong> <strong>GX</strong>Installation CD.The <strong>LabChip</strong> <strong>GX</strong> software can be set up to automatically back up allnew and modified data files to the Remote CDR Server. Automaticbackup ensures that secure versions of all data files are availableand synchronized, even in the event of failure of the instrumentcomputer.The following procedures are included in this section:• “Setting Up the Remote CDR Server” on page 109• “Backing Up Data Files to the Remote CDR” on page 111To back up the Remote CDR Server, either back up the entire C:\drive on the remote server, or back up the C:\RemoteCDR folder.The <strong>LabChip</strong> <strong>GX</strong> software also contains an option to copy the datafiles to an unsecured location on the local hard drive. These datafiles do not meet 21 CFR Part 11 security requirements after theyare copied out of the CDR. To copy data files to a non-securelocation, use the Copy button on the CDR Manager Window.Setting Up the Remote CDR ServerTo back up copies of <strong>LabChip</strong> <strong>GX</strong> data files on 21 CFR Part 11compliant systems, and keep the copies of the data files secure,back up the files to a Remote CDR Server. The Remote CDRServer must be running Windows XP or Vista. To set up the RemoteCDR Server:1 If the CDR Server Utility is not already installed on the remoteserver, see the Readme.htm file on the <strong>LabChip</strong> <strong>GX</strong> InstallationCD for instructions on running CDRServerUtilitySetup.exe.2 On the Remote computer, double-click on the CDR Server Utilityicon on the Windows desktop. The CDR Server Utility Windowopens.P/N 127170 Rev. 00 <strong>LabChip</strong> <strong>GX</strong> <strong>User</strong> <strong>Manual</strong> Caliper Life Sciences, Inc.
Software Security 110Setting Up the Remote CDR Server (Continued)3 If the Server has not been created on the computer yet, click theCreate Server button to create the server. The default foldername and location (C:\RemoteCDR) cannot be changed. Waitfor the Create Server button to be disabled and the text boxes tobe active.NOTEServer name, folder name, username, and password are casesensitive.4 A folder must be created on the server to store the database. Tocreate a new folder on the remote server:• Type the desired folder name in the Folder Name text box.• Type a <strong>User</strong>name for the folder in the <strong>User</strong>name text box.(This is a separate username from the user names createdin the <strong>LabChip</strong> <strong>GX</strong> software. This username is only used toaccess the data folder on the Remote CDR Server.)• Type the desired password in the Password and ConfirmPassword text boxes.• If Get Folder Details is checked, a text file specifying thefolder details is created and saved in C:\Program Files\Caliper Life Sciences\ <strong>LabChip</strong> <strong>GX</strong>\ CDRServer\ServerDetails\.• Click the Apply button to create the folder.5 Close the CDR Server Utility Window after the desired foldershave been created.P/N 127170 Rev. 00 <strong>LabChip</strong> <strong>GX</strong> <strong>User</strong> <strong>Manual</strong> Caliper Life Sciences, Inc.
Software Security 111Backing Up Data Files to the Remote CDRRemote CDR Backup copies each data file to the Remote CDRserver and stores a copy of the data file in a database. Each time adata file is created or modified, the changes are copied into theremote database.Remote CDR Backup can only be enabled by the <strong>LabChip</strong> <strong>GX</strong>default Administrator.To set up Remote CDR Backup:1 Verify that the Remote CDR Server is set up on an accessiblenetwork server.2 Log into the <strong>LabChip</strong> <strong>GX</strong> software using the defaultadministrator user name and password.3 Select Tools CDR Utility. The CDR Utility Window opens.4 Select the Enable Remote CDR Backup check box.NOTEServer name, folder name, username, and password are casesensitive.5 Type the computer name of the Remote CDR server in theRemote Computer Name/IP Address text box. If the remotecomputer and the local computer are not in the same Windowsworkgroup, type the IP address of the remote computer.6 In the Folder text box, type the name of the folder to use in theremote CDR server to store the <strong>LabChip</strong> <strong>GX</strong> data. (The foldermust have already been created using the CDR Server Utility onthe remote computer.)7 Type the folder username in the <strong>User</strong> Name text box. Thisusername is the same username that was used to create theCDR Server folder.8 Type the folder password in the Password text box. This is thesame password that was used to create the CDR Server folder.9 Click the Apply button.10 Click the Close button to close the CDR Utility Window.P/N 127170 Rev. 00 <strong>LabChip</strong> <strong>GX</strong> <strong>User</strong> <strong>Manual</strong> Caliper Life Sciences, Inc.
Software Security 112Running Installation Qualification (IQ)The Installation Qualification (IQ) verifies proper installation of the<strong>LabChip</strong> <strong>GX</strong> software and verifies no unauthorized changes havebeen made to the software. The IQ can be run whenever requiredby your laboratory procedures.The Installation Qualification can be used to check softwareinstallation qualification after routine computer maintenance, suchas disk cleanup, after installing antivirus software, or after installingMicrosoft service packs. The Installation Qualification checks<strong>LabChip</strong> <strong>GX</strong> software registry settings, the directory structure, andthe integrity of each file specified for the software application.To run the IQ:1 On the <strong>LabChip</strong> <strong>GX</strong> Main Window, select Validation Software IQ. The Installation Qualification Window opens.2 To view the results of the previous IQ before running a new IQ,click the Previous Result button. The View InstallationQualification Results Window displays the results of the last IQthat was run.3 To start the IQ, click the Start IQ button. The InstallationQualification window displays the tests that are run for the IQ,the progress of each test, and the Pass/Fail status of each testas it is completed.4 To save the results of the IQ, click the Save As button, specifythe desired location and name of the file, and click the Savebutton. IQ results are saved as .xml files.Running Operational Qualification (OQ)The System Diagnostics window performs an automatedOperational Qualification whenever required by your laboratoryprocedures.The System Diagnostics Window displays the tests that areperformed on the left side of the window. The test results aredisplayed on the right side of the window. After all tests arecomplete, the test report is generated and saved to a file for review,printing, and documentation purposes.See “Diagnostics” on page 239 for details on running theDiagnostics.P/N 127170 Rev. 00 <strong>LabChip</strong> <strong>GX</strong> <strong>User</strong> <strong>Manual</strong> Caliper Life Sciences, Inc.
Software Reference 113Software ReferenceThis section describes each of the windows in the <strong>LabChip</strong> <strong>GX</strong>software. Each window description describes the options andbuttons on the window, and how to open the window. This sectiondescribes the following windows:• “<strong>LabChip</strong> <strong>GX</strong> Main Window” on page 114• “About <strong>LabChip</strong> <strong>GX</strong> Window” on page 150• “Add New Expected Peak Window” on page 151• “Add Plate Window” on page 152• “Assay Analysis Window” on page 153• “Audit Trail Window” on page 173• “Audit Trail Export Window” on page 174• “Audit Trail Manage Columns Window” on page 175• “CDR Manager Window” on page 176• “CDR Server Utility Window” on page 178• “CDR Utility Window” on page 179• “Change Password Window” on page 181• “Data File Version Window” on page 182• “Event Viewer Window” on page 183• “Export Window” on page 184• “Installation Qualification Window” on page 187• “Layout Options Window” on page 188• “Login Window” on page 189• “New Collection Window” on page 190• “Perform Signature Window” on page 191• “Plate Information Window” on page 192• “Print Window” on page 193• “Print Validation Reports Window” on page 195• “Rename Collection Window” on page 196• “Run File Editor Window” on page 197• “Run Info Window” on page 198• “Sample Name Editor Window” on page 199• “Save Workspace As Window” on page 201• “Select a Data File Window” on page 202• “Start Run Window” on page 203• “System Diagnostics Window” on page 210• “Unlock Application Window” on page 212• “<strong>User</strong> Administration Window” on page 213P/N 127170 Rev. 00 <strong>LabChip</strong> <strong>GX</strong> <strong>User</strong> <strong>Manual</strong> Caliper Life Sciences, Inc.
Software Reference 114<strong>LabChip</strong> <strong>GX</strong> Main WindowFigure 40. <strong>LabChip</strong> <strong>GX</strong> Main WindowThe main window of the <strong>LabChip</strong> <strong>GX</strong> software includes:• “Menu Bar” on page 115• “Chip Status and Run Status” on page 121• “Plate View or Plate List” on page 124• “Collection Pane” on page 127• “Graph View” on page 128• “Graph View Properties” on page 134• “Gel View” on page 136• “Gel View Properties” on page 139• “Well Table View” on page 140• “Peak Table View” on page 141• “Peak Table Properties” on page 146• “Filter View” on page 147Clicking and dragging the borders between the views changes thesize of the views in the collection. To change the location of theviews, see “Changing the View of the Results” on page 72.P/N 127170 Rev. 00 <strong>LabChip</strong> <strong>GX</strong> <strong>User</strong> <strong>Manual</strong> Caliper Life Sciences, Inc.
Software Reference 115Menu BarThe menu bar is directly below the title bar on the <strong>LabChip</strong> <strong>GX</strong> MainWindow. Clicking a menu name displays a list of commands toaccess software functions.The <strong>LabChip</strong> <strong>GX</strong> software contains the following menus:• “File Menu” on page 116• “Workspace Menu” on page 116• “Collection Menu” on page 117• “Analysis Menu” on page 117• “Instrument Menu” on page 118• “Tools Menu” on page 118• “Security Menu” on page 119 (Only displays if the 21 CFR Part11 option is installed)• “View Menu” on page 119• “Validation Menu” on page 119• “Window Menu” on page 120• “Help Menu” on page 120P/N 127170 Rev. 00 <strong>LabChip</strong> <strong>GX</strong> <strong>User</strong> <strong>Manual</strong> Caliper Life Sciences, Inc.
Software Reference 116File MenuThe File menu contains the following commands:New Workspace - Creates a new, blank workspace.Open Workspace - Opens a saved workspace.NOTEYou can open multiple data files, but you cannot mix DNA, Protein,RNA, or Glycan data files in the same workspace.Import Data File - Opens a saved DNA, Protein, RNA, or Glycandata file for a specific microplate. If the 21 CFR Part 11 option isinstalled, opens the CDR Manager Window. A graphicalrepresentation of the microplate displays. (Protein and Glycanassays are only supported on <strong>LabChip</strong> <strong>GX</strong> II instruments.) Datafiles can be .<strong>GX</strong>D (<strong>LabChip</strong> <strong>GX</strong>) or .CLA (<strong>LabChip</strong> HT software).Export - Opens the Export Window to choose the type of data toexport. Exports a Peak Table, Well Table, Gel, Single Graph, or allopen graphs in the current Collection to a file, depending on theoptions selected.Print - Opens the Print Window to choose the data to print.Save Workspace - Saves the current workspace.Save Workspace As - Saves the current workspace with a newfilename.Exit - Closes the <strong>LabChip</strong> <strong>GX</strong> software.Workspace MenuThe Workspace menu contains the following commands:Remove Plate - Removes the selected plate data file from theworkspace.Save Plate - Saves the plate data file (*.gxd). Changes to theanalysis settings (in the Assay Analysis Window) are saved at theend of the plate data file. Previous analysis settings are notoverwritten, enabling you to use the Restore Plate button on theAssay Analysis Window to go back to any previously savedsettings. Plate data files are automatically saved when theWorkspace is saved.P/N 127170 Rev. 00 <strong>LabChip</strong> <strong>GX</strong> <strong>User</strong> <strong>Manual</strong> Caliper Life Sciences, Inc.
Software Reference 117Collection MenuThe Collection menu contains the following commands:Undo - Undoes changes to the collection view settings and filtersettings. Changes made in pop-up windows, such as analysissettings, export settings, etc, are not affected by this Undo.New Collection - Opens the New Collection Window where youchoose whether to create a new Collection from a saved CollectionTemplate, a Blank Collection, or the Current Collection.Rename Collection - Opens the Rename Collection Window torename the currently selected Collection.Delete Collection - Deletes the current Collection.Save As Template - Opens the Save Template As window to savethe display and filter settings currently displayed in the Collectiontab as a collection template.Apply Template - Opens the Apply Template window to open asaved collection template and apply the settings to the currentCollection.Layout - Opens the Layout Options Window to change where tabsare displayed by default on the main window.Analysis MenuThe Analysis menu contains the following commands:Turn On/Off Analysis - Toggles analysis on and off. When analysisis on, the data displayed in the main window uses the analysissettings in the Assay Analysis Window. When analysis is off, theraw (unanalyzed) data displays.Scale to Sample Peaks - Scales the view to the minimum andmaximum X values of the current sample peaks. Marker and/orsystem peaks are ignored.Scale to All Peaks - Scales the view to the minimum and maximumX values of the all peaks, including marker peaks and systempeaks.Analysis Settings - Opens the Assay Analysis Window to chooseanalysis parameters for the selected plate. These settings areapplied to all wells in the microplate. Use these settings to changethe analysis and peak finding parameters to help resolve hard-todecipherdata.Standard Curve - Opens the Standard Curve Window to view theladder as a curve with a point-to-point fit.P/N 127170 Rev. 00 <strong>LabChip</strong> <strong>GX</strong> <strong>User</strong> <strong>Manual</strong> Caliper Life Sciences, Inc.
Software Reference 118Instrument MenuThe Instrument menu contains the following commands:Start Run - Opens the Start Run Window to begin running a sampleplate. See the Assay <strong>User</strong> Guide for chip and sample prepinstructions.Start Wash - Begins a sequence of steps to wash the chip. See theAssay <strong>User</strong> Guide for chip prep instructions.NOTEThe Instrument menu does not display if the software was installedin Reviewer mode.Tools MenuThe Tools menu contains the following commands:Run File Editor – Opens the Run File Editor window to create Runfiles. Run files contain the settings to run an assay using Caliper’sautomation control software, such as iLink Pro.Sample Name Editor - Opens the Sample Name Editor Window tochange, import, or export the sample names assigned to the wellsof the plate.Assay Editor - Opens the Select Assay To Edit window.Plate Editor - Opens the Plate Information Window to add, edit, ordelete plates from the <strong>LabChip</strong> <strong>GX</strong> software.CDR Utility - Opens the CDR Utility Window to set or change theCDR options or Remote CDR Backup options. This command isonly available when the 21 CFR Part 11 option is installed and thedefault Administrator is logged into the <strong>LabChip</strong> <strong>GX</strong> software.P/N 127170 Rev. 00 <strong>LabChip</strong> <strong>GX</strong> <strong>User</strong> <strong>Manual</strong> Caliper Life Sciences, Inc.
Software Reference 119Security MenuView MenuValidation MenuThe Security menu only displays if the CFR Support option isinstalled with the <strong>LabChip</strong> <strong>GX</strong> software.<strong>User</strong> and System Administration - Opens the <strong>User</strong> AdministrationWindow to create, edit, and view user login information, activate ordeactivate users, define user access, and set user policies.Change Password - Opens the Change Password Window tochange the Login Password for the current user.Perform Signature - Opens the Perform Signature Window to signa data file.Audit Trail Log - Opens the Audit Trail Window to view, search,export, and print the audit trail.Lock Application - Opens the Unlock Application Window to lockthe <strong>LabChip</strong> <strong>GX</strong> software and prevent other users from using thesoftware until the software is unlocked by the current user or anAdministrator.The View menu contains the following commands:Event Viewer - Opens the Event Viewer Window to view eventsand errors that occur during the current run or during a previousrun.Run Info - Opens the Run Info Window to view information aboutthe run.Version Change Details - Displays the Data File Version ChangeDetails window to view changed versions of the selected open datafile. (Only displays if the CFR Support option is installed with the<strong>LabChip</strong> <strong>GX</strong> software.)The Validation menu only displays if the CFR Support option isinstalled with the <strong>LabChip</strong> <strong>GX</strong> software.Software IQ - Opens the Installation Qualification Window toperform the IQ.Diagnostics - Opens the System Diagnostics Window to rundiagnostic tests to verify system operation and performance.Reports - Opens the Print Validation Reports Window to view orprint IQ/OQ results.P/N 127170 Rev. 00 <strong>LabChip</strong> <strong>GX</strong> <strong>User</strong> <strong>Manual</strong> Caliper Life Sciences, Inc.
Software Reference 120Window MenuHelp MenuThe Window menu contains the following commands:Cascade - Displays each Collection in a separate, cascadingwindow in the Collection Pane.Tile Vertical - Displays each Collection in separate side by sidewindows in the Collection Pane.Tile Horizontal - Displays each Collection in separate top to bottomwindows in the Collection Pane.Tabbed - Displays each Collection in a separate tab in theCollection Pane.The Help menu contains the following commands:<strong>LabChip</strong> <strong>GX</strong> HelpOpens the Contents/Index page for the <strong>LabChip</strong> <strong>GX</strong> Help file.About <strong>LabChip</strong> <strong>GX</strong>Opens the About <strong>LabChip</strong> <strong>GX</strong> Window, showing the softwareversion number, hardware versions, etc.P/N 127170 Rev. 00 <strong>LabChip</strong> <strong>GX</strong> <strong>User</strong> <strong>Manual</strong> Caliper Life Sciences, Inc.
Software Reference 121Chip Status and Run StatusThe Chip Status and Run Status areas on the <strong>LabChip</strong> <strong>GX</strong> MainWindow display the status of the system, information about the Chipin the instrument, and information about the assay that is currentlyrunning.NOTEIf the software was installed in Reviewer mode, this status areadoes not display.System Status - Displays the status of the system. Displays Readywhen the system is ready to run an assay. While an assay isrunning, each stage of the assay displays: Priming, Warming,Running, etc.Run Button - Opens the Start Run Window to begin to run anassay. See the Assay <strong>User</strong> Guide for chip preparation instructions.While an assay is running, the Run button changes to a Stop buttonas shown above. Click the Stop button to stop a running assay.Assays that have been stopped cannot automatically be continued.See “Continuing a Stopped Run” on page 29 for details onrestarting a stopped assay.Wash Button - Begins a sequence of steps to wash the chip. Seethe Assay <strong>User</strong> Guide for chip preparation instructions.Chip StatusAssay - The name of the assay file that is being run or thatgenerated the data.P/N 127170 Rev. 00 <strong>LabChip</strong> <strong>GX</strong> <strong>User</strong> <strong>Manual</strong> Caliper Life Sciences, Inc.
Software Reference 122Chip Status and Run Status (Continued)Chip Reagent Status - Displays the time and number of samples(whichever comes first) until the chip reagents expire. Reagentexpiration depends on the type of chip inserted in the instrument.The <strong>LabChip</strong> <strong>GX</strong> automatically detects the chip type from anembedded RF ID tag in each chip. The expiration time and numberof samples reset whenever the chip holder is ejected.Chip Life Status- Displays the date and number of samples(whichever comes first) until the chip expires. Chip expirationdepends on the type of chip inserted in the instrument. The <strong>LabChip</strong><strong>GX</strong> automatically detects the chip type from an embedded RF IDtag in each chip. The sample count and chip expiration date resetwhenever the chip holder is ejected.Run StatusRun Time Left - Displays the time remaining until the assay iscomplete.Plate Name - The name of the plate being used in the assay.Auto Export - Displays Yes if Auto Export was selected in theOutput Tab on the Start Run Window. Displays No if Auto Exportwas not selected.Barcode - If Use Barcode was selected in the Run Tab or OutputTab on the Start Run Window, displays the barcode that was readfrom the plate. If Use Barcode was not selected, displays N/A.Cycles - Displays/, whereCurrentPlateCycleNumber is the number of the plate cycle currentlyexecuting and TotalPlateCycleNumber is the total number of platecycles specified in the Advanced Tab on the Start Run Window.CurrentPlateCycleNumber displays 0 during the priming/andWarming steps before reading the first well.Status - Displays the action the system is performing and the timeremaining in the step. Run Time Left (above) displays the timeremaining in the entire assay.Errors - If an error occurs during an assay, a line of red textdisplays a description of the error below the Run Status area in theError Message Area. Click the red text to view details about theerror.P/N 127170 Rev. 00 <strong>LabChip</strong> <strong>GX</strong> <strong>User</strong> <strong>Manual</strong> Caliper Life Sciences, Inc.
Software Reference 123Error Message AreaError messages are displayed below the Chip Status and RunStatus on the <strong>LabChip</strong> <strong>GX</strong> Main Window.Error messages can result from hardware or software problems.Most are the result of peaks not being located by the analysisalgorithms of the software. This can be due to a sample or ladderpeak not appearing as expected. The software settings (in the PeakFind Tab) can also cause peaks to be undetected, which can causeerrors. Additionally, manually excluding a peak (see page 64) fromanalysis (in the Peak Table View) or changing the start or end timesfor a run can cause errors with the peak find algorithm.See “Error Messages” on page 235 for a list of errors and tips onpreventing or resolving errors.P/N 127170 Rev. 00 <strong>LabChip</strong> <strong>GX</strong> <strong>User</strong> <strong>Manual</strong> Caliper Life Sciences, Inc.
Software Reference 124Plate View or Plate ListThe Plate View or Plate List View displays on the lower left side ofthe <strong>LabChip</strong> <strong>GX</strong> Main Window.The Plate View or List View displays the data files in the opencollection and enables you to select specific wells of microplatedata. Click the tabs at the bottom of the view to switch betweenPlate View and List View.Plate ViewThe Plate View displays a graphical representation of themicroplates in the collection (see below) and indicates selectedwells, filtered wells, and wells with errors. Wells included in thecollection are colored blue. The wells selected to view in the GelView and Well Table View are outlined in black. Select the Platestab at the bottom of the Workspace pane to see the Plates view.If a single well is selected, use the Up, Down, Left, and Right arrowkeys to move the selection to adjoining wells.To select the wells to view in the Collection Pane, see “Selectingthe Wells in a Collection” on page 53.Plate View Right-Click MenuRight-clicking on the plate name in the Plate view displays thefollowing options in the shortcut menu:Keep Gel in Sip Order - If selected, keeps the gel in sip order whenselecting wells in the plate view. If not selected, the gel displays thewells in the order in which the wells were selected.Save Plate - Saves the current data file.Copy Plate - Saves a copy of the plate data file (.gxd) to theselected folder.Export Assay - Saves a copy of the assay settings for the plate toan assay file (.asy) in the selected folder.P/N 127170 Rev. 00 <strong>LabChip</strong> <strong>GX</strong> <strong>User</strong> <strong>Manual</strong> Caliper Life Sciences, Inc.
Software Reference 125Rename Plate - Renames the plate in the workspace. The originaldata file is not renamed, only the name displayed in the workspace.Remove Plate - Removes the plate data file from the workspace.The data file is not deleted, only the workspace view changes.Analysis Settings - Displays the Assay Analysis Window tochange the analysis settings for the data file.Version Change Details - Displays the Data File Version Windowto change the version of the data file displayed in the workspace.Run Info - Displays the Run Info Window to view the runinformation and Event Log.Plate Well Color CodeWhite - Wells are not included in the open collection.Gray - Wells were not read.Blue -Wells are included in the open collection.Any Other Color - Wells are selected by a Filter. See the FilterView to determine which color represents each filter. If a well isselected by multiple filters, the colors are combined in the well.Black Outline - Wells are selected in the Gel View and Well TableView.Red Exclamation Point in Well - An analysis error has occurred inthe well, such as no lower marker detected.Yellow Exclamation Point in Well - An analysis warning hasoccurred in the well.P/N 127170 Rev. 00 <strong>LabChip</strong> <strong>GX</strong> <strong>User</strong> <strong>Manual</strong> Caliper Life Sciences, Inc.
Software Reference 126List ViewThe List View displays a list of all the wells in the currently opendata files. Select the List tab at the bottom of the Workspace paneto see the List view.• Black wells are not included in the open collection.• Dark Blue wells are included in the open collection.• Light Blue wells are selected in the Gel View and Well TableView.• Red wells have an analysis error.Figure 41. List ViewP/N 127170 Rev. 00 <strong>LabChip</strong> <strong>GX</strong> <strong>User</strong> <strong>Manual</strong> Caliper Life Sciences, Inc.
Software Reference 127Collection PaneThe Collection Pane in the <strong>LabChip</strong> <strong>GX</strong> Main Window displays a tabfor each collection in the workspace. Each collection displays theinformation from the data files that are open in the Plate View orPlate List.The Collection Tabs each contain the following views:• Graph View• Gel View• Well Table View• Peak Table View• Filter ViewThe views in the Collection pane are synchronized with each other.• Selecting a graph on the Graph tab automatically selects thesame well on the Gel tab.• Selecting a peak in the Peak Table automatically selects thesame peak in the Graph tab and the Gel tab.• Closing a gel on the Gel tab closes the graph for the well andremoves the well data from the Peak Table and Well Table tabs.P/N 127170 Rev. 00 <strong>LabChip</strong> <strong>GX</strong> <strong>User</strong> <strong>Manual</strong> Caliper Life Sciences, Inc.
Software Reference 128Graph ViewThe Graph view in the Collection Pane is a visual representation ofthe data from each well as an electropherogram.The Graph view contains the Active Data Tab while a run is inprogress, and the Overlay Electropherograms Tab and theElectropherograms Tab to view data from completed wells. Forinformation on changing the view in the Overlay Electropherogramstab, see “Viewing Graphs in the Overlay Electropherograms Tab” onpage 77. For information on changing the view in theElectropherograms tab, see “Viewing Graphs in theElectropherograms Tab” on page 78.Figure 42. Graph ViewIf Type is selected as an annotation, the lower (and upper for DNA)markers are displayed in the graph view with large green arrowslabeled LM and UM respectively. The currently selected peak in theGel view or Peak Table displays a small blue arrow above the peak.You can zoom in and zoom out the Graph View of the wells. Zoomin by clicking and dragging over a region of an electropherogram.Zoom out by right clicking on a graph, and selecting either Unzoomor Unzoom All from the shortcut menu. Double-clicking in the graphwill zoom out to the previous zoom level.Graph data can be exported to a graphic file by choosing Export onthe File menu. (See “Exporting Data” on page 86 for details.) If theworkspace contains multiple collections, the data exported is fromthe active/selected collection.P/N 127170 Rev. 00 <strong>LabChip</strong> <strong>GX</strong> <strong>User</strong> <strong>Manual</strong> Caliper Life Sciences, Inc.
Software Reference 129Graph View (Continued)To show or change the labels on the peaks in the graph, show thedata points on the graph, show peak baselines, or change the graphcolors, see “Graph View Properties” on page 134.To select a peak on the graph, move the cursor near the peak. Ablue arrow above the peak shows that the peak is selected, and thecursor changes to an arrow that points straight up. The Gel Viewand Peak Table View also select the corresponding entry.You can adjust the peak baselines from the graph view, if desired.Select Show Peak Baselines in the Graph View Properties todisplay the baseline for each peak. To change the baseline, clickthe triangle at either end of the peak baseline and drag to thedesired location. To reset the baseline back to the original position,right-click near the baseline end point and choose Reset toDefaults.While a run is in progress, the Active Data Tab displays the raw(unanalyzed) data as it is being read from the chip. As data isacquired, the selected well increments to the well that is currentlybeing run, and the data displays in real time.Graph View Shortcut MenusRight-Click Menu (not near a peak)Right-click away from a peak in the graph to display a shortcutmenu containing the following commands:Unzoom - zooms out to the previous zoom level.Unzoom All - zooms out completely and returns to the standardview.Set Scale - Opens the Set Graph Scales window to specify the Xand Y ranges to show on the graph.Scale to Sample Peaks - Scales the view to the minimum andmaximum X values of the current sample peaks. Marker and/orsystem peaks are ignored.Scale to All Peaks - Scales the view to the minimum and maximumX values of the all peaks, including marker peaks and systempeaks.Copy - Copies the selected graph to the clipboard in a .bmp format.Analysis Settings - Opens the Assay Analysis Window to changethe analysis settings.P/N 127170 Rev. 00 <strong>LabChip</strong> <strong>GX</strong> <strong>User</strong> <strong>Manual</strong> Caliper Life Sciences, Inc.
Software Reference 130Graph View (Continued)Right-Click Menu (near a peak)Right-click above or below a peak in the graph to display a shortcutmenu containing the following commands:Exclude Peak - Excludes the peak from the analysis. (The PeakType label displays X.)Include Peak - Includes an excluded peak in the analysis. Onlyavailable when the selected peak is already excluded or is typeSystem Peak or “?”. Including the peak will compute the peakproperties, populate the peak table, and include the peak in thearea total used for the %Purity calculation.Force Lower Marker - Defines the selected peak as the LowerMarker. (The Peak Type label displays LM*.)Clear Forced Lower Marker - Allows the analysis to determine thelower marker. (The Peak Type label for the calculated lower markerdisplays LM.) Only available when the selected peak is a ForcedLower Marker.Force Upper Marker - (DNA Assays only) Defines the selectedpeak as the Upper Marker. (The Peak Type label displays UM*.)Clear Forced Upper Marker - (DNA Assays only) Allows theanalysis to determine the upper marker. (The Peak Type label forthe calculated upper marker displays UM.) Only available when theselected peak is a Forced Upper Marker.Add Expected Peak - Opens the Add New Expected Peak Windowto add a new Expected Peak to the specified wells.Force Expected Peak - Defines the selected peak as the specifiedExpected Fragment or Protein. A list of all of the defined ExpectedPeaks displays beside the shortcut menu. Select the desiredExpected Peak from the list.Clear Forced EP - Clears the forced peak and allows the analysisto determine the expected peak.Right-Click Menu (at the bottom of an RNA peak)Right-click near the bottom of a peak in the graph for an RNA assayto display a shortcut menu containing the following commands:Reset to Defaults - Sets the Peak Baseline endpoints back to thedefault values.P/N 127170 Rev. 00 <strong>LabChip</strong> <strong>GX</strong> <strong>User</strong> <strong>Manual</strong> Caliper Life Sciences, Inc.
Software Reference 131Active Data TabThe Active Data tab on the Graph View displays the raw(unanalyzed) data as it is being read from the chip. The Active Datatab only displays while a run is in progress. After a well is read, viewthe data in the Overlay Electropherograms Tab.Figure 43. Active Data TabThe Active Data tab does not show any peak labels or markerindicators. The labels and markers are identified during analysis,which occurs after all data from the well is collected.P/N 127170 Rev. 00 <strong>LabChip</strong> <strong>GX</strong> <strong>User</strong> <strong>Manual</strong> Caliper Life Sciences, Inc.
Software Reference 132Overlay Electropherograms TabUse the Overlay Electropherograms tab on the Graph View to viewa single graph or multiple graphs overlaid on top of each other.Figure 44. Overlay Electropherograms TabThe sample list at the upper right displays the name of each sampleand the color assigned to the graph for each sample. If only onegraph is displayed, the Gel View, Well Table View, and Plate Viewor Plate List all show the same selected well.The gel lanes selected in the Gel View are synchronized with thegraphs displayed in the Overlay Electropherograms tab.For information on changing the view in the OverlayElectropherograms tab, see “Viewing Graphs in the OverlayElectropherograms Tab” on page 77.See “Graph View Properties” on page 134 for descriptions of theproperties that can be set for the Overlay Electropherograms tab.P/N 127170 Rev. 00 <strong>LabChip</strong> <strong>GX</strong> <strong>User</strong> <strong>Manual</strong> Caliper Life Sciences, Inc.
Software Reference 133Electropherograms TabUse the Electropherograms tab on the Graph View to view a singlegraph or multiple graphs in the same tab.Figure 45. Electropherograms TabEach graph displays the data file name and well name at the top ofthe graph.For information on changing the view properties in theElectropherograms tab, see “Viewing Graphs in theElectropherograms Tab” on page 78.See “Graph View Properties” on page 134 for descriptions of theproperties that can be set for the Electropherograms tab.P/N 127170 Rev. 00 <strong>LabChip</strong> <strong>GX</strong> <strong>User</strong> <strong>Manual</strong> Caliper Life Sciences, Inc.
Software Reference 134Graph View PropertiesTo view the Properties for the Electropherograms Tab or theOverlay Electropherograms Tab, click the Properties tab on theright side of the Graph View.Figure 46. Electropherograms Properties and OverlayElectropherograms PropertiesThis window contains the following options:OptionMaximum Graphsper PageAnnotation 1FunctionSpecifies the maximum number of graphs displayed on theElectropherograms Tab. If more than the maximum are selected,use the scroll bar on the right side of the tab to scroll through thegraphs. (Only displayed when the Electropherograms tab isselected.)Labels each peak in the graph with the peak property selectedfrom the drop down list. Default is Type.The Annotations available depend on the columns selected inthe Peak Table View.P/N 127170 Rev. 00 <strong>LabChip</strong> <strong>GX</strong> <strong>User</strong> <strong>Manual</strong> Caliper Life Sciences, Inc.
Software Reference 135OptionText Orientation(A) buttonSet Font buttonAnnotation 2Peak AnnotationLegendWell AnnotationWell AnnotationLocation Button(arrow)Show Data PointsShow PeakBaselinesShow SmearsOnly AnnotateExpected PeaksGraph SelectedGels OnlySampleName/ColorTableX Axis ScaleGrid StyleData LegendLocationPin iconFunctionSpecifies the orientation of the text for the annotation: horizontal,vertical up, or vertical down.Opens the Font window to choose the font, style, and size of thetext for all annotations.Labels each peak in the graph with a peak property selectedfrom the drop down list. Default is None.If selected, the types of the annotations display in the upper leftcorner of the graph.Displays the selected well property outside the graph.The location of the well annotation. Click the button to change tolocation: upper right, upper left, lower left, or lower right.If selected, displays a dot on the graph at the location of eachdata point.If selected, displays the baseline for each peak on the graph.If selected, displays smears as a colored line on the trace anddisplays the smear baseline. This option only displays if smearsare defined in the Assay Analysis Window.If selected, only the peaks that are labeled as ExpectedFragments or Expected Proteins display the annotations. If notselected, all peaks display the annotations.If selected, only the wells selected in the Gel View or Well TableView are displayed in the Electropherograms tab. If not selected,all wells in the collection are displayed. (Only displayed whenthe Electropherograms tab is selected.)Displays the names of the samples (well names) on the graphand the color associated with each sample (well). Click on thecolor to choose a different color for a sample.Changes the X Axis from Time to Size.Displays grid lines on the graph, vertical, horizontal, both, ornone. Click the button to cycle through the grid options.If multiple wells are displayed in the Overlay Electropherogramstab, specifies the location where the legend displays on thegraph. The legend shows the color used for each well. (Only forthe Overlay Electropherograms Tab.)In the top right corner, this is used to lock in place or unlock theProperties tab. If locked in place, the Graph is resized toaccommodate the tab.P/N 127170 Rev. 00 <strong>LabChip</strong> <strong>GX</strong> <strong>User</strong> <strong>Manual</strong> Caliper Life Sciences, Inc.
Software Reference 136Gel ViewThe Gel view in the Collection Pane is a visual representation of thedata formatted to look like the Gel slabs that were originally used toprovide DNA, Protein, or RNA data. The data is shown in Time vs.Fluorescence (or digital form). (Protein and Glycan assays are onlysupported on <strong>LabChip</strong> <strong>GX</strong> II instruments.)Click on a gel lane (well) to select the well. Ctrl + click to selectmultiple wells. Selected wells are outlined with a dotted gray line.Wells selected in the Gel view are also selected in the Well TableView and are displayed in the Overlay Electropherograms Tab.Figure 47. Gel ViewMoving the cursor over a band in the Gel view displays a tool tipthat includes the same information about the peak as the PeakTable View. (Changing the columns displayed in the Peak Table willchange the contents of the tool tip in the Gel view.)For DNA assays, the upper and lower markers of all wells arealigned to the upper and lower markers of the first well in the gelview. For Protein and RNA assays, the lower markers of all wellsare aligned to the markers of the first well in the gel view.Figure 48. Gel HeadersP/N 127170 Rev. 00 <strong>LabChip</strong> <strong>GX</strong> <strong>User</strong> <strong>Manual</strong> Caliper Life Sciences, Inc.
Software Reference 137Gel View (Continued)A colored column header indicates that the well is selected by afilter. Click the Filter View to view the color of each filter. A redexclamation point under the header indicates an analysis erroroccurred in the well. A yellow exclamation point under the headerindicates an analysis warning occurred in the well. A gray headerindicates a normal well. To change the size of the gel header, clickon the border between the header and the well and drag the headerto the desired size.Expected Peaks are indicated on the gel by colored horizontallines.The graphs displayed in the Graph View are synchronized with thelanes selected in the Gel tab.You can drag-and-drop the gel lanes to change the order of thewells for comparing two or more gel wells. To drag-and-drop a gellane, click in the header of the lane to be moved and drag the gellane to the desired location.Double-click in the Gel view to zoom out to the previous zoom level.Gel data can be exported to a graphic file by choosing Export onthe File Menu (see “Exporting Data” on page 86 for details). If theworkspace contains multiple collections, data is exported from theactive/selected collection.To change the Lane Width or Gel Contrast Range, see Gel ViewProperties.Right-Click MenuRight-click anywhere in a gel to display a shortcut menu containingthe following commands:Unzoom - Zooms out to the previous zoom level.Unzoom All - Zooms out completely and returns to the standardview.Scale Gel Contrast to this Lane - If selected for a lane, theminimum and maximum RFU values for all lanes in the collectionare set to the minimum and maximum RFU values in the selectedlane.Scale Gel Contrast to Collection - Restores the minimum andmaximum RFU values for all lanes in the collection to the defaultvalues. (Only available when Scale Gel Contrast to This Lane hasbeen selected for a lane.)P/N 127170 Rev. 00 <strong>LabChip</strong> <strong>GX</strong> <strong>User</strong> <strong>Manual</strong> Caliper Life Sciences, Inc.
Software Reference 138Gel View (Continued)Remove - Removes the sample from the collection.Copy Gel - Copies all of the open lanes (wells) to the clipboard in a.bmp format.Copy Lane - Copies the selected lane (well) to the clipboard in a.bmp format.Analysis Settings - Opens the Assay Analysis Window to changethe analysis settings.Edit Sample Name - Opens the Edit Sample Name window tochange the well name or add a comment to the well. The commentdisplays in the Well Table View and in printed reports.Rename Plate - Opens the Rename Plate window to specify a newname for the plate.P/N 127170 Rev. 00 <strong>LabChip</strong> <strong>GX</strong> <strong>User</strong> <strong>Manual</strong> Caliper Life Sciences, Inc.
Software Reference 139Gel View PropertiesTo view the Gel View Properties, click the Properties tab on theright side of the Gel View.Figure 49. Gel View PropertiesThe following properties can be set for the Gel view:Option/ButtonLane WidthGel ContrastRangeGel ColorSet Lane LabelFont buttonShow EPs andSmearsShow EP/Smear LegendShow FilterLegendPin iconFunctionSets the width of the Collection column. Select Auto Fit to have thesoftware automatically fit all the data, or use the slider to manuallyset the width.Sets the minimum and maximum Gel Band Contrast for the bandsin each well. Use the sliders to change the min and max values.Click on the Foreground color or the Background color to open theColor window to choose the desired colors for the gel.Opens the Font window to change the font or size of the labels inthe gel headers.If selected, expected peaks are indicated in the gel by coloredhorizontal lines and smears are indicated by bands of translucentcolor.Displays a legend of the band colors and expected peak sizes orsmear sizes in the Gel view. Click and drag to move the legend.Displays a legend of the colors assigned to each filter. Click anddrag to move the legend. Only displays if at least one filter isdefined in the Filter tab.In the top right corner, this is used to lock in place or unlock theProperties tab. If locked in place, the Gel display panel is resized toaccommodate the tab.P/N 127170 Rev. 00 <strong>LabChip</strong> <strong>GX</strong> <strong>User</strong> <strong>Manual</strong> Caliper Life Sciences, Inc.
Software Reference 140Well Table ViewThe Well Table view in the Collection Pane contains a summary ofanalysis results for the wells selected from the microplates in thecollection.To view or hide columns in the Well Table view, right-click on acolumn header in the table. The Select Well Table Columns windowdisplays all available columns with the current selections checked.Show or hide columns in the well table by selecting or clearing thecheck boxes in the Select Well Table Columns window.Figure 50. Well Table ViewChange the order of columns in the table by clicking on a columnheader and dragging the column to the desired position in the table.Click a column header to sort the table in ascending/ descending/original order.Right-click in the Plate Name column to open the Rename Platewindow to rename the plate.Right click in the Sample Name column to edit the well name orcopy the well name to the clipboard.Right click in the <strong>User</strong> Comment column to add or edit the <strong>User</strong>Comment or copy the comment to the clipboard.The output of an exported Well Table includes the columns in theorder displayed in the Collection Pane at export time. A Well Tableis exported to a CSV format, which you can import to a programsuch as Microsoft Excel. If your workspace contains multiplecollections, the data is exported from the active/selected collection.P/N 127170 Rev. 00 <strong>LabChip</strong> <strong>GX</strong> <strong>User</strong> <strong>Manual</strong> Caliper Life Sciences, Inc.
Software Reference 141Peak Table ViewThe Peak Table view in the Collection Pane is a text-basedrepresentation of all the information about each peak.To view or hide columns in the Well Table view, right-click on thecolumn headers in the table. The Select Peak Table Columnswindow displays all available columns with the current selectionschecked. Show or hide columns in the peak table by selecting orclearing the check boxes in the Select Peak Table Columns window.Figure 51. Peak Table ViewThe order of columns in the table can be changed by clicking on acolumn header and dragging the column to the desired position inthe table. Click a Column header to sort the table in ascending/descending/ original order.The analysis normally labels the upper marker (UM) (DNA Assaysonly) and lower marker (LM) in each sample and in the ladder. Thelabels display in the Type column of the table. If the analysis hasmisidentified the markers, the correct marker can be selectedmanually by right-clicking on the peak row to open a shortcut menuof possible peak types for the peak. This can also be used to label apeak as Excluded (X). The concentration of an excluded peak isforced to zero so that it does not affect the total well concentrationand the %Purity calculation.Expected Peaks are indicated by the Expected peak name in theType column.The output of an exported Peak Table includes the columns in theorder displayed in the Collection Pane at export time. A Peak Tableis exported to a CSV format, which can be imported into a programsuch as Microsoft Excel. If the workspace contains multiplecollections, the data is exported from the active/selected collection.P/N 127170 Rev. 00 <strong>LabChip</strong> <strong>GX</strong> <strong>User</strong> <strong>Manual</strong> Caliper Life Sciences, Inc.
Software Reference 142Peak Table View (Continued)To show only filtered peaks, sort within each well, or hide excludedpeaks, see Peak Table Properties.Protein and Glycan assays are only supported on <strong>LabChip</strong> <strong>GX</strong> IIinstruments. DNA and RNA assays are supported on <strong>LabChip</strong> <strong>GX</strong>and <strong>GX</strong> II instruments.The Peak Table can display the following columns:Well NumberThe number of the well in the same order as the wells wereselected in the collection. See Selecting the Wells in a Collection.Plate NumberThe number of the plate in the same order as the plates aredisplayed in the Plate View or Plate List.Plate NameThe name of the plate defined in the workspace.Plate FileThe name of the original plate data file. This name cannot bechanged.Instrument NameThe name of the instrument that was used to run the plate andcreate the data file.Date_TimeThe date and time that the plate data files was created.Well LabelThe row letter and column number of the well (A1 - H12 for 96-wellplates, or A1 - P24 for 384-well plates).Sample NameThe sample name defined in the Sample Name File selected in theAdvanced Tab on the Start Run Window. The Sample name canalso be changed in the Well Table View or the Gel View.Chip IDThe ID number of the Chip used to run the plate.BarcodeThe barcode on the plate used in the run.Peak IndexThe index number of the peaks in the sample. Marker peaks, peaksbefore the lower marker, and peaks after the upper marker are notnumbered.P/N 127170 Rev. 00 <strong>LabChip</strong> <strong>GX</strong> <strong>User</strong> <strong>Manual</strong> Caliper Life Sciences, Inc.
Software Reference 143Peak Table View (Continued)Peak NumberThe order in which the peaks were detected for each well. All peaksin each well are numbered, starting at 1.Migration Time - CenterThe time from injection to the peak apex in seconds.HeightThe value at the apex of the peak minus the local baseline startvalue.AreaThe peak area is calculated as the sum of the parallelograms of apoint-to-point fit down to absolute zero minus the parallelogram ofthe local baseline down to absolute zero. Data points are 0.05seconds apart.Aligned AreaIf the sample has been aligned, the area of the aligned peaks isreported.Size (BP for DNA assays, KDa for Protein Assays, nt for RNAAssays, CGU for Glycan Assays)The size of the peak based on the ladder sizes specified in theassay.Conc. (ng/uL)(DNA and Protein Assays only) The concentration calculatedrelative to the ladder and marker peak concentrations. The ladderconcentration is displayed in the Analysis Tab of the Assay AnalysisWindow.% Purity(Protein Assay only) The quantity of protein, expressed as apercentage of the total protein, found in a particular peak.%Area(Glycan Assay only) The peak's area as a percentage of the totalarea of peaks within the sample range (> 6.6 CGU).Expected Fragment (BP)/ Expected Protein (kDa)/ExpectedGlycan (CGU)Displays the size of the Expected Fragments, Expected Proteins, orExpected Glycan.TypeDisplays the type of peak for markers or expected peaks.P/N 127170 Rev. 00 <strong>LabChip</strong> <strong>GX</strong> <strong>User</strong> <strong>Manual</strong> Caliper Life Sciences, Inc.
Software Reference 144Peak Table View (Continued)CommentDisplays any comments associated with the well, either from theSample Name File selected in the Advanced Tab on the Start RunWindow or from the Sample Name Editor Window.Signal NoiseThe statistical standard deviation of 1 second of data just before thePeak Find Start Time.BaselineThe center average height of the peak baseline, measured in RFUs.FWHMThe width of the peak (Full Width at Half Maximum), measured inseconds.Molarity (nmol/l)(DNA Assays only) Displays the molarity of the peak.Corr. Area (Glycan Assays) and Time Corr. Area (Protein Assays)Displays the mobility corrected area. The area of a peak shouldrepresent the total area of the compound responsible for thefluorescence. In the Caliper instrumentation, the fluorescence of thecompound moving past the detector is sampled at constant timeintervals unlike the conventional slab gel where the compound isspread out spatially and imaged at a single time. To convert from apeak area integrated in the time dimension to one integrated in thespace dimension, we use the fact that x is proportional to µt so ∆xα µ∆t and the mobility µ is proportional to 1/T where T is themigration time of the peak. So the Time Corr Area = 100 * Area/T.The 100 is an arbitrary constant designed to keep the correctedarea in a range similar to the original area computed from the timeseries data.RNA Fragment(RNA Assays only) The name of the fragment based on its sizefalling within a certain range set in the assay definition. (Thesedefinitions are visible only to assay developers).Fragment Area(RNA Assays only) The sum of the trapezoids between thefragment start and end times. The trapezoid base is a line drawnacross the fragment base from the start point to the end point.P/N 127170 Rev. 00 <strong>LabChip</strong> <strong>GX</strong> <strong>User</strong> <strong>Manual</strong> Caliper Life Sciences, Inc.
Software Reference 145Peak Table View (Continued)% of Total Area(RNA Assays only) The area of the RNA fragment divided by thetotal area. The total RNA area is computed using trapezoidalintegration of the electropherogram from the end of the lowermarker to the baseline end time. The baseline for the total area is astraight line drawn from the baseline start time to the baseline endtime. The height of the baseline at these points is the averagesignal value over a 5 second region around these points.Fragment Start (sec)(RNA Assays only) Amount of time from injection to the leadingedge of the fragment in seconds.Fragment End (sec)(RNA Assays only) Amount of time from injection to the falling edgeof the fragment in seconds.Peak Table View Shortcut MenusRight-click on a peak in the peak table to display a shortcut menucontaining the following commands:• Exclude Peak• Include Peak (for excluded peaks, peaks of type "?", or SystemPeaks in Protein assays)• Force Lower Marker• Force Upper Marker (DNA assays only)• Force Expected PeakNOTEExcluding a peak or manually setting a peak to be an upper or lowermarker can cause errors with analysis.P/N 127170 Rev. 00 <strong>LabChip</strong> <strong>GX</strong> <strong>User</strong> <strong>Manual</strong> Caliper Life Sciences, Inc.
Software Reference 146Peak Table PropertiesTo view the Peak Table Properties, click the Properties tab on theright side of the Peak Table View.Figure 52. Peak Table PropertiesThis window contains the following options:OptionSort withineach wellHide excludedpeaksExpectedPeaks onlyFiltered peaksonlySelected in GelEntireCollectionPin iconFunctionIf selected (default), sorting occurs only within each well ratherthan across the entire table. Click a column header to sort thetable rows by the column value. If cleared, uses conventionalsorting, which mixes together peaks from all wells. Clicking thecolumn header sorts in ascending/descending/original order.If selected, excluded peaks and unknown peaks are hidden in thePeak Table view. In protein assays, the analysis excludes systempeaks, which are compounds that are artifacts of the assaychemistry and not generally of interest.If selected, only peaks identified as Expected peaks display in thePeak Table.If selected, the Peak Table displays only peaks that match the filtercriteria. Useful when generating a collection based on a filterwhose selection criteria are peak specific, such as Area,Concentration, %Purity, Expected Peaks, and Size.If selected, only the gel lanes selected in the Gel View display. Toselect multiple wells, Ctrl + click on the lanes in the Gel view.If selected, all wells in all plates that are included in the collectionare displayed.In the top right corner, used to lock in place or unlock theProperties tab. If locked in place, the Peak Table display panel isresized to accommodate the tab.P/N 127170 Rev. 00 <strong>LabChip</strong> <strong>GX</strong> <strong>User</strong> <strong>Manual</strong> Caliper Life Sciences, Inc.
Software Reference 147Filter ViewThe Filter view in the Collection Pane is used to define criteria toselect wells for a collection automatically. The filter types availabledepend on the type of assay that was used to create the data. Eachfilter can be assigned a different color to determine which filterapplies to each well. See Example: Expected Peaks Filter for anexample of a filter.Figure 53. Filter ViewOne or more filters can be defined independently by selecting theappropriate filter type, range mode, and range values, and thenclicking the Add button. The Available Filters list box displays allof the filters that are part of the current collection. The check boxnext to each filter in the list is used to include or exclude that filterfrom the analysis.The Filter Options selection determines how multiple filters arelogically combined. The options available are OR, AND(Peak), andAND(Well).• OR - Selects any well that contains a peak that matches any ofthe filters selected in the Available Filters list.• AND(Peak) - Selects any well that contains a single peak thatmatches all of the filters selected in the Available Filters list.• AND(Well) - Selects any well that contains peaks that match allof the filters selected in the Available Filters list. Different peaksin the same well can match different filters, as long as all filterconditions are met in the same well.P/N 127170 Rev. 00 <strong>LabChip</strong> <strong>GX</strong> <strong>User</strong> <strong>Manual</strong> Caliper Life Sciences, Inc.
Software Reference 148Filter View (Continued)The Quadrant Select panel specifies which quadrants of all platesin the collection will have the specified filters applied to them.Selecting a quadrant check box applies the specified filters to thatquadrant. Clearing a quadrant check box excludes that quadrantfrom the specified filters.Example: Expected Peaks FilterIn the example below, the sizes 100 +/- 10%, 300 +/- 10%, and 500+/- 10% are selected, with each expected peak size identified by adifferent color. This filter will select any wells that contain all threeexpected peaks: 100, 300, AND 500. Note that the filter is selected(checked) under Available Filters, indicating that the filter is beingapplied to the data.To select wells that contain any of the three peaks, create aseparate filter for each peak and select OR as shown below.P/N 127170 Rev. 00 <strong>LabChip</strong> <strong>GX</strong> <strong>User</strong> <strong>Manual</strong> Caliper Life Sciences, Inc.
Software Reference 149Filter View (Continued)When using multiple filters that include peak properties, ifAND(Peak) is selected, a single peak in the well must meet allselected filter properties. See the examples below, which each usetwo filters:• Height > 100 AND(Peak) Conc > 50 selects any well thatcontains a single peak that meets both criteria.• Height >100 OR Conc > 50 selects any well that contains a peakthat meets either (or both) criteria.• Height >100 AND(Peak) Height
Software Reference 150Filter View (Continued)In the Plate diagram (above), the pink and black wells are the wellsthat meet the filter criteria. To see the gels of each well, click on thewell in the Plate diagram and view the gel in the Gel view. To seethe graph for each well, click on the well in the Plate diagram andview the graph in the Graphs view.The gel (above) shows the expected peaks marked with coloredlines on the Gel view. The well header is pink if the well meets thefilter criteria for the first filter, and black if it meets the filter criteriafor both the first and second filters.About <strong>LabChip</strong> <strong>GX</strong> WindowThe About <strong>LabChip</strong> <strong>GX</strong> window displays the software and firmwareversions. Selecting About <strong>LabChip</strong> <strong>GX</strong> on the Help Menu opensthis window.Figure 54. About <strong>LabChip</strong> <strong>GX</strong> WindowP/N 127170 Rev. 00 <strong>LabChip</strong> <strong>GX</strong> <strong>User</strong> <strong>Manual</strong> Caliper Life Sciences, Inc.
Software Reference 151Add New Expected Peak WindowUse the Add New Expected Peak Window to add an expected peakto specific wells. To open this window, right-click near a peak in theGraph View and select Add Expected Peak.Figure 55. Add New Expected Peak WindowSizeWindow (%)ColorNamePropertyDisplayed inWell TableApply toWellsSpecifies the expected size of the peak in BP for DNA assays, in kDafor Protein assays, and in CGU for Glycan assays. The default size isthe size of the peak that was selected.Specifies the tolerance window as a percent of the expected size forthe fragment/protein/glycan to allow for small variations in expectedpeak size.Displays the color to use to mark the peak in the Graph View or theGel View.Specifies a name to display in the Type description for the peak.Specifies the content of a column added to the well table for eachexpected peak.Specifies the wells that the expected peak is applied to. specifies that the expected peak applies to all wells. Clicking on thecolumn opens the Select Wells window to choose the specific wells toapply the expected peak to.P/N 127170 Rev. 00 <strong>LabChip</strong> <strong>GX</strong> <strong>User</strong> <strong>Manual</strong> Caliper Life Sciences, Inc.
Software Reference 152Add Plate WindowUse the Add Plate window to add new plates to the system. To openthe Add Plate window, click the Add Plate button on the PlateInformation Window.Plate NameFigure 56. Add Plate WindowThe Add Plate window contains the following settings:Specifies the plate name that displays in the Start Run Window.Plate Type Specifies the number of wells in the plate, either 96 or 384.X Margin The distance from the outer edge of the plate to the center of well A1in the X direction.Y Margin The distance from the outer edge of the plate to the center of well A1in the Y direction.Plate Height The distance from the bottom of the plate to the top of the plate.Well Depth The distance from the top of the plate to the bottom of the well.Sip Height The distance from the bottom of the well to the bottom of the sipperwhen the sipper is positioned to sip sample from the well.P/N 127170 Rev. 00 <strong>LabChip</strong> <strong>GX</strong> <strong>User</strong> <strong>Manual</strong> Caliper Life Sciences, Inc.
Software Reference 153Assay Analysis WindowThe Assay Analysis window specifies the analysis parameters.These settings are used to display assay settings and change theanalysis and peak finding parameters to help resolve hard-todecipherdata. To open the Assay Analysis window, select Analysis Analysis Settings on the main menu.The Assay Analysis window contains the following tabs:• Assay Information Tab• Alignment Tab• Analysis Tab• Peak Find Tab• Expected Fragments/Proteins/Glycans Tab• Excluded Peaks Tab• Smear Analysis Tab• Titer Tab• Advanced TabThe following buttons at the bottom of the Assay Analysis windoware used to save, apply, or cancel changes:ButtonsApplyApplyGlobalExport AsAssayRestorePlateOKPrintPreviewPrintCancelFunctionApply setting changes and re-analyze the plate but keep the AssayAnalysis window open.Applies the selected analysis settings to all plates in the openworkspace.Opens the Export Assay Settings from Plate to Assay file window tospecify a name and location for a new assay file (*.asy). Clicking Savecreates a new assay file with the settings in the Assay Analysis Window.Restores the analysis settings for the plate to the settings selected inthe Restore Plate Settings window. If installed with CFR, opens theRestore Plate Settings To Version window to choose which version of adata file to restore.Apply changes in the Assay Analysis window and re-analyze the platewith these new settings.Opens the Print Preview window to view the analysis settings beforeprinting.Opens the Print window to print the analysis settings.Restores the settings that were selected when the window was openedor when the last Apply was performed. No re-analysis is performedbecause the settings were used for the last analysis performed.P/N 127170 Rev. 00 <strong>LabChip</strong> <strong>GX</strong> <strong>User</strong> <strong>Manual</strong> Caliper Life Sciences, Inc.
Software Reference 154Assay Information TabThe Assay Information tab on the Assay Analysis Window displaysthe header information for the current plate. The informationdisplayed was specified when the assay was run and cannot bechanged.Figure 57. Assay Analysis Window - Assay Info TabThe following read-only information is displayed:Assay Class - Either DNA, Protein, RNA, or Glycan. (Protein andGlycan assays are only supported on <strong>LabChip</strong> <strong>GX</strong> II instruments.)Name - The name of the assay.Title - The title of the assay.Comments - Any comments that were added in the Start RunWindow.Version - The version of the assay that was run.Format - The format of the data file.Plate - The name of the plate in the workspace. Usually the sameas the name of the data file that was created when the plate wasrun, unless the name is changed after it is added to the workspace.P/N 127170 Rev. 00 <strong>LabChip</strong> <strong>GX</strong> <strong>User</strong> <strong>Manual</strong> Caliper Life Sciences, Inc.
Software Reference 155Alignment TabThe Alignment tab on the Assay Analysis Window is used to assignalternate ladders to a specified group of wells in the event of afaulty ladder result. The default assignment for full rows uses theladder adjacent to the row where the sample is located. If thisladder cannot be analyzed, the software automatically looks foranother nearby ladder to perform the analysis. The actual ladderused for the analysis is shown in the Well Peak Find Settings panelof the Peak Find Tab. It can be changed by selecting the “AlignWell Groups to Specified Ladder” option and then selecting adifferent ladder in the “To Ladder” column corresponding to the rowto be changed.For Protein Assays, which do not use an upper marker, alignment isnormally performed with ladders on each end of the row tocompensate for drift between start and end of each row. Thisfeature can be disabled by selecting “Align Well Groups toPrevious Ladder” or “Align Well Groups to Specified Ladder”instead of “Align Well Groups to Bracketed Ladder”.Figure 58. Assay Analysis Window - Alignment TabThe Alignment tab contains the following settings:• Align Well Groups to corresponding Ladders - If selected,each row is aligned to the ladder at the beginning of the row.• Align Well Groups to Bracketing Ladders - (Protein assaysonly.) If selected, each row is aligned with the ladder at thebeginning of the row and a ladder at the end of the row. (Proteinassays are only supported on <strong>LabChip</strong> <strong>GX</strong> II instruments.)P/N 127170 Rev. 00 <strong>LabChip</strong> <strong>GX</strong> <strong>User</strong> <strong>Manual</strong> Caliper Life Sciences, Inc.
Software Reference 156Alignment Tab (Continued)Analysis Tab• Align Well Groups to Specified Ladders - If selected, eachrow is aligned with the ladder selected in the table.The Markers panel displays which markers are being used foralignment. This setting is determined by the assay type and cannotbe modified.To turn off alignment, select Turn Off Analysis from the Analysismenu.Use the Analysis tab on the Assay Analysis Window to view theUpper and/or Lower marker peak designation (this setting cannotbe changed) or to view or change the Ladder Sizes, LadderConcentration, Standard Curve (DNA only), Data Range, MarkerConcentration (DNA) Dilution Ratio (Protein), and System PeakExclusion (Protein). (Protein and Glycan assays are only supportedon <strong>LabChip</strong> <strong>GX</strong> II instruments.)Figure 59. Assay Analysis Window - Analysis TabLadder SizesA table showing the sizes (in base-pairs for DNA, kiloDaltons forprotein, and nt for RNA) of the ladder peaks. Click in the Sizecolumn and type the desired size to change the ladder size.Clear Default Ladder buttonDisplays at the bottom of the Ladder Sizes if a default ladder isdefined for the plate.Ladder ConcentrationThe concentration (in ng/uL) for the ladder peaks. (Not available forGlycan assays.)P/N 127170 Rev. 00 <strong>LabChip</strong> <strong>GX</strong> <strong>User</strong> <strong>Manual</strong> Caliper Life Sciences, Inc.
Software Reference 157Analysis Tab (Continued)Standard CurveDetermines whether the fit for the standard curve used to calibratemigration time to size will be done on a point-to-point, logarithmic,or Polynomial fit of the ladder. DNA, RNA, and Glycan assays areset to point-to-point curve fits but can be changed to Polynomial.Protein assays are set to Log and cannot be changed.Data Range• Baseline - Specifies the time in seconds after the start of therun when the first peak can appear (any peaks appearing beforethis time are ignored).• Well End - Specifies the time when peak detection stops. Thegraph ends at this time.Dilution Ratio (Protein assays only)Used to compensate for differences between sample and ladderdilutions in the computation of the sample peak concentrations.• Ladder - Reflects a dilution of ladder in a total volume of ladderand sample buffer according to the <strong>LabChip</strong> <strong>GX</strong>/<strong>GX</strong>II Assay<strong>User</strong> Guide.• Sample - Reflects a dilution of sample in a total volume ofsample, water, and sample buffer according to the <strong>LabChip</strong><strong>GX</strong>/<strong>GX</strong>II Assay <strong>User</strong> Guide.System Peak Exclusion (Protein and Glycan assays only)Used to specify the region where System peaks are to be taggedand excluded from the analysis.• Ladder Ratio - Time at which ladder peaks are detected asladder peaks rather than system peaks. For example, if theladder ratio is set to 1.5, the software multiplies the lowermarker migration time x 1.5 and then begins ladder peakidentification. In this example, if the lower marker elutes at sixseconds, the ladder peak detection starts at 6x1.5 or 9 seconds.• Min. Sample Size (kDa or CGU) - Size at which peaks areidentified as sample peaks rather than system peaks (exceptthe Lower Marker).Markers (DNA and Glycan assays only)DNA assays: The size and concentration (in ng/uL) for the upperand lower markers for the DNA assay.Glycan assays: The size of the lower marker.If a default Ladder is defined for the plate, the Marker MigrationTime, Height, and Area are available for editing.P/N 127170 Rev. 00 <strong>LabChip</strong> <strong>GX</strong> <strong>User</strong> <strong>Manual</strong> Caliper Life Sciences, Inc.
Software Reference 158Peak Find TabUse the Peak Find tab on the Assay Analysis Window to adjustparameters to detect peaks for individual wells, rows, columns, asingle plate, or the entire plate specified in the Plate field.Figure 60. Assay Analysis Window - Peak Find TabInitial individual plate and well selections are made by right-clickingon a well in the Gel View or the graph in the Graph View andselecting the Analysis Settings option. The corresponding wellsettings are displayed in the Well Peak Find Settings fields.Subsequent well selections in a plate can be made using the Welldrop-down list. The well list includes all the wells on the currentplate that are selected. The Plate and Well Name fields are readonly, and cannot be changed from the Peak Find Tab. (Protein andGlycan assays are only supported on <strong>LabChip</strong> <strong>GX</strong> II instruments.)P/N 127170 Rev. 00 <strong>LabChip</strong> <strong>GX</strong> <strong>User</strong> <strong>Manual</strong> Caliper Life Sciences, Inc.
Software Reference 159Peak Find Tab (Continued)PlateSettingsMinimumPeak HeightMinimumPeak WidthSlopeThresholdInflectionThresholdStart TimeEnd TimeFilter WidthBaselinePlateauPolynomialOrderThis window contains the following options:Table 1. Plate Peak Find SettingsFunctionSpecifies the height limit below which a peak is not detected. Foreach peak, the difference between the peak start time and the peakapex must be greater than the Min Peak Height value.Specifies the limit (in seconds) for the peak width. Peaks narrower intime than this value are not detected.Represents the amount of change in absorbance units over timerequired to indicate that a peak has occurred. This setting is used todetect the leading and trailing edges of a peak. Increasing this settingmay cause broad rolling bumps to be ignored or merge multiplebumps into a single peak. Decreasing this setting will broaden thepeaks’ width and potentially pick up broad bumps as peaks. See“Peak Identification” on page 260 for more information.Represents the value that the slope minimum must be below totrigger a splitting of the peak. As the threshold is increased, morepeak splitting occurs. See “Inflection Threshold Example” onpage 254 for more information.Specifies the time after the start of a run when the first peak will bedetected (any peaks appearing before this time are ignored). The Geland Graph views will not plot data earlier than this time.Specifies the time after which peak detection stops. The Gel andGraph views will not plot data beyond this time.Specifies the width, in seconds, of the low pass filter to be convolvedwith the data. The width of this filter should be about 6 samples wide(i.e. 0.1 sec for 60 Hz sampling). If this setting is too large, peaks willdevelop spurious side lodes (ringing) due to over-filtering.Specifies a baseline selection parameter for peak finding. The signalis at baseline whenever the slope of the data is less than the slopethreshold setting (positive or negative) for longer than the BaselinePlateau. This rejects brief, low slope areas such as in between nonbaseline-resolvedpeaks.A filter algorithm is used to filter the data, increasing the signal-tonoiseratio. The data is convolved with a polynomial of this order toproduce filter data and a filter slope and decrease the background orbaseline noise and/or spikes in the signal. This value is read only.P/N 127170 Rev. 00 <strong>LabChip</strong> <strong>GX</strong> <strong>User</strong> <strong>Manual</strong> Caliper Life Sciences, Inc.
Software Reference 160Table 1. Plate Peak Find SettingsPlateSettingsExcludeSystemPeaksBaselineAlgorithmHigh SizeFilteringFunction(Protein and Glycan assays only) If selected, excludes the systempeak (peak due to buffer constituent) from any changes you make tothe peak find settings (the most recent custom ladder settings areused instead).• None - No correction.• Zero Baseline - Offsets all graphs to zero baseline but does notaffect analysis.• Baseline Subtraction - A dynamic subtraction of the baseline thatcorrects for drifting Baseline. This algorithm creates a smooth linefit to the baseline data points and subtracts this smooth fit from thedata. The threshold for the baseline correction allows you todetermine how much the baseline fit tries to follow changes in thedata. Lowering the Threshold below the default value of 20 allowsthe baseline fit to ignore regions that are slow changes of realsignal peaks and not baseline drift.If selected, a second, larger filter is applied to the data after thespecified time. This is useful for assays where the peaks are narrowat the start of the assay and become broad and noisy for larger sizesof DNA, protein or Glycan. If not selected, the same size filter is usedfor all data.• Filter Width (sec) - The width of the second filter to be applied afterthe specified transition time. Filter Width must be greater than theSample Well Filter width and less than or equal to 3.0 seconds.• Transition Time (sec) - The time at which to transition to the largerfilter size. Transition time must be greater than the Baseline Timeon the Analysis tab and less than the Well End time.Table 2. Well Peak Find SettingsWellSettingsWellLadderMinimumPeak HeightFunctionDisplays the well being edited. Select any well or ladder on the platebelonging to the current collection.Read only. Displays the ladder used for aligning this well. UseAlignment tab to edit. New value displays here after clicking Apply.Specifies an override to the Peak Find Settings for Minimum PeakHeight for the entire plate. Specify a valid numeric value to override,or clear the field to reset to the Global setting.P/N 127170 Rev. 00 <strong>LabChip</strong> <strong>GX</strong> <strong>User</strong> <strong>Manual</strong> Caliper Life Sciences, Inc.
Software Reference 161Table 2. Well Peak Find SettingsWellSettingsMinimumPeak WidthSlopeThresholdUse PlateValue buttonSave asDefaultLadderApplyWell/LadderApply RowApplyColumnApply AllLaddersApply PlateFunctionSpecifies an override to the Peak Find Setting for Minimum PeakWidth for the entire plate. Specify a valid numeric value to override,or clear the field to reset to the Global setting.Specifies an override to the Peak Find Setting for Slope threshold forthe entire plate. Specify a valid numeric value to override, or clear thefield to reset to the Global setting.Sets Min Peak Height, Min Peak Width, and Slope Threshold textboxes to settings.Sets the selected ladder to the default ladder for the plate. Does notalign any wells to the default ladder. (Only available for DNA andRNA assays.)Apply well-specific peak find settings only to the well or laddershowing in the Well field.Apply well-specific peak find settings to all wells in the same row asthe selected well.Apply well-specific peak find settings to all wells in the same columnas the selected well.(Displays only if a ladder is selected in the Well field.) Applies peakfind settings to all ladders in the plate.Apply well-specific peak find settings to all wells on the same plate.P/N 127170 Rev. 00 <strong>LabChip</strong> <strong>GX</strong> <strong>User</strong> <strong>Manual</strong> Caliper Life Sciences, Inc.
Software Reference 162Expected Fragments/Proteins/Glycans TabUse the Expected Fragments/ Proteins/Glycans tab on the AssayAnalysis Window to enter Expected Fragments for DNA assays,Expected Proteins for Protein assays, or Expected Glycans forGlycan assays. (See “Using Expected Fragments/ ExpectedProteins/ Expected Glycans” on page 57 for more information.)After the data is analyzed, any peaks matching the expectedfragments/proteins/glycans are shown in the Peak Table View, WellTable View, Gel View, and Graph View (if Type is selected as anAnnotation in the Graph View Properties). (Protein and Glycanassays are only supported on <strong>LabChip</strong> <strong>GX</strong> II instruments.)Figure 61. Assay Analysis Window - Expected Fragments TabThe Expected Fragments/Proteins tab contains the followingoptions and buttons:Expected Peak Table - Lists the expected peaks for the assayanalysis.• Size - Specifies the expected size of the peak in BP (DNA), kDa(Protein), or CGU (Glycan).P/N 127170 Rev. 00 <strong>LabChip</strong> <strong>GX</strong> <strong>User</strong> <strong>Manual</strong> Caliper Life Sciences, Inc.
Software Reference 163Expected Fragments/Proteins/Glycans Tab (Continued)• Window (%) - Specifies the tolerance window as a percent ofthe expected size for the peak to allow for small variations inexpected peak size.• Color - Displays the color to use to mark the peak in the GraphView or the Gel View.• Name - Specifies a name to display in the Type description forthe peak.• Property Displayed in Well Table - Specifies the content of acolumn added to the well table for each expected peak.• For Aligning check box - (Protein assays only.) If selected, thedata signal is realigned so the selected expected peaks matchtheir aligned size. Note that incorrect alignment settings cancause analysis errors.• Apply to Wells - Specifies the wells that the expected peak isapplied to. specifies that the expected peak applies to allwells. Clicking on the column opens the Select Wells window tochoose the specific wells to apply the expected peak to.Import button - Opens the Import Expected Fragments/ Proteins/Glycan Table window to select an Expected Peak File (.gep) toimport. The .gep file is created by exporting expected peaks fromanother assay.Clear button - Deletes all Expected Peaks from the table.Restore button - Restores the settings to the last saved settingsfor expected peaks.Export button - Opens the Export Expected Fragments/ Proteins/Glycans window to create an Expected Peak File (.gep) from thecurrent settings in the tab. Import the .gep file into another assay touse the same expected peaks in another assay.P/N 127170 Rev. 00 <strong>LabChip</strong> <strong>GX</strong> <strong>User</strong> <strong>Manual</strong> Caliper Life Sciences, Inc.
Software Reference 164Excluded Peaks TabUse the Excluded Peaks tab on the Assay Analysis Window to enterExcluded Fragments for DNA assays, Excluded Proteins for Proteinassays, or Excluded Glycans for Glycan assays. After the data isanalyzed, any peaks matching the excluded peaks are excludedfrom the analysis. (Protein and Glycan assays are only supportedon <strong>LabChip</strong> <strong>GX</strong> II instruments.)Figure 62. Assay Analysis Window - Excluded Peaks TabThe Excluded Peaks tab contains the following options and buttons:Excluded Peak Table - Lists the excluded peaks for the assayanalysis.• Size - Specifies the size of the excluded peaks in BP(DNA), kDa(Protein). or CGU (Glycan).• Window (%) - Specifies the tolerance window as a percent ofthe size of the peak to allow for small variations in peak size.• Color - Displays the color to use to mark the peak in the GraphView or the Gel View.• Name - Specifies a name to display in the Type description forthe peak.P/N 127170 Rev. 00 <strong>LabChip</strong> <strong>GX</strong> <strong>User</strong> <strong>Manual</strong> Caliper Life Sciences, Inc.
Software Reference 165Excluded Peaks Tab (Continued)• Apply to Wells - Specifies the wells that the excluded peak isapplied to. specifies that the excluded peak applies to allwells. Clicking on the column opens the Select Wells window tochoose the specific wells to apply the excluded peak to.Import button - Opens the Import Excluded Peaks window toselect an Expected Peak File (.gep) to import. The .gep file iscreated by exporting excluded peaks from another assay.Clear button - Deletes all Excluded Peaks from the table.Restore button - Restores the settings to the last saved settingsfor excluded peaks.Export button - Opens the Export Excluded Peaks window tocreate an Expected Peaks File (.gep) from the current settings inthe tab. Import the .gep file into another assay to use the sameexcluded peaks in another assay.P/N 127170 Rev. 00 <strong>LabChip</strong> <strong>GX</strong> <strong>User</strong> <strong>Manual</strong> Caliper Life Sciences, Inc.
Software Reference 166Smear Analysis TabUse the Smear Analysis tab on the Assay Analysis Window todefine Smears. After the data is analyzed, the area matching thesmear is shown in the Well Table View, Gel View (if Show EPs andSmears is selected in the Gel View Properties), and Graph View (ifShow Smears is selected in the Graph View Properties).Figure 63. Assay Analysis Window - Smear TabThe Smear Analysis tab contains the following options and buttons:Smear Table - Lists the smears for the assay analysis.• Start Size - Specifies the starting size of the area to be includedin the smear.• End Size - Specifies the ending size of the area to be includedin the smear.• Color - Displays the color to use to mark the smear in the GraphView or the Gel View.• Name - Specifies a name to display in the Well Table View.P/N 127170 Rev. 00 <strong>LabChip</strong> <strong>GX</strong> <strong>User</strong> <strong>Manual</strong> Caliper Life Sciences, Inc.
Software Reference 167Smear Analysis Tab (Continued)• Property Displayed in Well Table - Specifies the content of acolumn added to the Well Table for each smear.• Apply to Wells - Specifies the wells that the smear is applied to. specifies that the smear applies to all wells. Clicking onthe column opens the Select Wells window to choose thespecific wells to apply the smear to.Export button - Opens the Export Smear Analysis Table window tocreate a Smear Analysis Export File (.sma) from the current settingsin the tab. Import the .sma file into another assay to use the samesmear in another assay.Restore button - Restores the settings to the last saved settingsfor smears.Import button - Opens the Import Smear Analysis Table window toselect an Smear Analysis Import File (.sma) to import. The .sma fileis created by exporting smears from another assay.Clear button - Deletes all smears from the table.P/N 127170 Rev. 00 <strong>LabChip</strong> <strong>GX</strong> <strong>User</strong> <strong>Manual</strong> Caliper Life Sciences, Inc.
Software Reference 168Titer TabUse the Titer tab on the Assay Analysis Window to specify the wellsin the plate that contains the standard to be used as the calibrationstandard. The Titer is used for calibration instead of the ladder.(Titer is not available for Glycan assays.)Figure 64. Assay Analysis Window - Titer TabThe Titer tab contains the following options and buttons:Titer Table - Lists the standard size, well locations, andconcentrations for the titer on the plate.• Size - Specifies the size of the standard in BP for DNA assays,nt for RNA assays, or kDa for Protein assays.• Window (%) - Specifies the tolerance window as a percent ofthe size for the standard to allow for small variations in size.• Found in Well- Specifies the location of the standard in theplate. (Not displayed for imported titers.)• Normalized Area - Specifies the titer peak normalized area forimported titers. The table for imported titers is Read Only andcannot be edited. (Not displayed for manually entered titers.)P/N 127170 Rev. 00 <strong>LabChip</strong> <strong>GX</strong> <strong>User</strong> <strong>Manual</strong> Caliper Life Sciences, Inc.
Software Reference 169Titer Tab (Continued)• Concentration - Specifies the concentration of the standard inthe specified well.• Name - Specifies a name to display in the Type description forthe peak.Import Titer from Another Plate - Selecting the check box opensthe Select Plate For Titer Import window to select the desired titerfrom another plate. The plate must be open in the collection, thetiter curve must be analyzed, and the normalization peak mustmatch. The normalization peak is set in the Analysis tab: LowerMarker, Upper Marker (DNA only), or Sample Peak. If the SamplePeak option is used, the peak size specified must also match. If nocompatible plate is found in the workspace, a message displays andthe Import is cancelled. Clearing the check box returns to themanually entered titer.Concentration to Favor in Fit - Adjusts the weight of the points inthe linear fit for the Titer Standard Curve. The points are weightedby raising the concentration to a power depending on the sliderposition. Each line on the slider represents a ½ power increment,with the center position equal to 0. The left most position raises theconcentration to the power -2.5. The right most position raises theconcentration to the power of 2.5 to weight each point.Force Fit through Origin check box - If selected, the TiterStandard Curve is forced to include the origin (0,0). This preventsvery small peaks from generating negative concentrations.Fit Model - Choose Linear or Quadratic to fit the Standard Curve tothe Titer. Linear: y = a + bx. Quadratic: y = a + bx + cx 2 .Plot Titer Curve button - Plots the Titer Standard Curve usinglinear regression to fit the data to a straight line and then displays agraph of the curve.Select Titer Plate button - Opens the Select Plate For Titer Importwindow to select a different plate from which to import a titer. Theplate must be open in the collection, the titer curve must beanalyzed, and the normalization peak must match. Thenormalization peak is set in the Analysis tab: Lower Marker, UpperMarker (DNA only), or Sample Peak. If the Sample Peak option isused, the peak size specified must also match. Only displays after atiter has been imported.Export button - Opens the Export Titer Table window to create aTiter Export File (.ttr) from the current settings in the tab. Import the.ttr file into another assay to use the same titer in another assay.P/N 127170 Rev. 00 <strong>LabChip</strong> <strong>GX</strong> <strong>User</strong> <strong>Manual</strong> Caliper Life Sciences, Inc.
Software Reference 170Titer Tab (Continued)Restore button - Restores the settings to the last saved titersettings.Import button - Opens the Import Titer Table window to select anTiter Import File (.ttr) to import. The .ttr file is created by exporting atiter table from another assay.Clear button - Deletes all entries from the table. Clear the entriesto use the default Standard Curve instead of the Titer StandardCurve.P/N 127170 Rev. 00 <strong>LabChip</strong> <strong>GX</strong> <strong>User</strong> <strong>Manual</strong> Caliper Life Sciences, Inc.
Software Reference 171Advanced TabUse the Advanced tab on the Assay Analysis Window to view thequantification marker settings or change the Peak Size Calibrationpoint.Figure 65. Assay Analysis Window - Advanced TabQuantificationDetermines whether the upper or lower marker is used forquantitation. Protein and RNA assays use the lower marker. DNAassays use the upper marker. DNA and RNA Quantificationselections are set by the assay properties and cannot be changed.For Protein assays, selecting Sample Peak uses the peak size andconcentration of the <strong>User</strong> Standard instead of the default laddersettings. Not available for Glycan assays. (Protein and Glycanassays are only supported on <strong>LabChip</strong> <strong>GX</strong> II instruments.)Peak Size Calibration PointSpecifies which part of the peak is used as the size calibrationpoint.• Leading Edge - If selected, uses the start of the peak. (May bebetter for data where sample peaks are broader than ladderpeaks.)• Center - If selected, uses the top of the peak. (May be better fordata where leading edge is not well-defined.)Concentration Size Correction (Protein assays only)Protein concentration is size-corrected to account for differences inthe amount of protein injected into the separation channel based onits size. The correction is obtained using the formula:Conc(Size Corrected) = Conc(Time Corrected Area) * Amplitude *(Size)^PowerP/N 127170 Rev. 00 <strong>LabChip</strong> <strong>GX</strong> <strong>User</strong> <strong>Manual</strong> Caliper Life Sciences, Inc.
Software Reference 172Advanced Tab (Continued)The default values for the Concentration Size Correction weredetermined empirically by measuring a wide range of proteins ofknown size and concentration. This correction can be bypassed bysetting Amplitude = 1.0, Power = 0.0.Peak Integration ModeSpecifies the mode for determining the baseline.• Peak Baseline - A global peak baseline is used as the baselinefor all peaks. This baseline is determined by stitching togetherregions of low variance across the data signal.• Valley to Valley - Each peak is assigned a baseline by drawinga line beneath the peak joining the start and end of the peak atthe data signal values.P/N 127170 Rev. 00 <strong>LabChip</strong> <strong>GX</strong> <strong>User</strong> <strong>Manual</strong> Caliper Life Sciences, Inc.
Software Reference 173Audit Trail WindowThe Audit Trail Window enables you to search the Audit Trail Logfor specific events, to export the events, or to print events.To open the Audit Trail window, select Security Audit Trail Logon the <strong>LabChip</strong> <strong>GX</strong> Main Window.Figure 66. Audit Trail WindowThe Audit Trail Window contains the following options:Search mostrecent entriesNumber ofentriesSearch by datesFrom and Totext boxesSearch entiredatabase<strong>User</strong>name textboxFilename textboxEvent CategoryIf selected, the specified most recent number of entries issearched for entries matching the selected criteria.Specifies the number of most recent entries to search.If selected, entries between the specified dates are searched forentries matching the selected criteria.Select the dates that contain the events that you want to view.If selected, all entries in the database are searched.Select a specific user name to view only events performed underthe specified user name. Select All <strong>User</strong>s to view eventsperformed by any user.Clicking the Browse (...) button opens the Audit Trail CDRBrowser window to open the audit trail for a different data file.Specifies the Event Category of events to search for. Defaultselects all event categories.P/N 127170 Rev. 00 <strong>LabChip</strong> <strong>GX</strong> <strong>User</strong> <strong>Manual</strong> Caliper Life Sciences, Inc.
Software Reference 174Green ArrowbuttonSearch buttonExport buttonPrint ViewbuttonClose buttonDisplays the Audit Trail Manage Columns Window to select thecolumns to view in the Audit Trail window.Searches for events matching the search criteria specified.Opens the Audit Trail Export Window to export a copy of theselected events out of the audit trail log.Displays a preview for printing the Audit Trail Report.Closes the Audit Trail Window.Audit Trail Export WindowUse the Audit Trail Export Window to export the contents of theAudit Trail Window to either an ASCII text file, and XML file, or aMicrosoft Excel file. Only the events displayed in the Audit TrailWindow are exported. Events filtered out of the view are notexported.To open the Audit Trail Export Window, click the Export button inthe Audit Trail Window.Figure 67. Audit Trail Export WindowThe Audit Trail Export Window contains the following options:File Formats - Select the desired format for the exported file:• ASCII Text File - If selected, the file is saved as a .txt file.• XML File - If selected, the file is saved as a .xml file.• MS Excel - If selected, the file is saved as a .xls file.Number of Events Included - Displays the number of events thatwill be exported.P/N 127170 Rev. 00 <strong>LabChip</strong> <strong>GX</strong> <strong>User</strong> <strong>Manual</strong> Caliper Life Sciences, Inc.
Software Reference 175Audit Trail Manage Columns WindowUse the Audit Trail Manage Columns Window to select the columnsto view at the bottom of the Audit Trail Window.To open the Audit Trail Manage Columns Window, click the GreenArrow button next to the Event Category text box in the Audit TrailWindow.Figure 68. Audit Trail Manage Columns WindowThe Audit Trail Manage Columns window contains the followingparts:Show All checkboxColumn listGreen Up andDown ArrowsSave buttonClose buttonSelecting the check box selects all of the listed columns to displayat the bottom of the Audit Trail window. Clearing the check boxclears all of the column check boxes.Only the selected columns display at the bottom of the Audit Trailwindow. Cleared (unselected) columns are hidden.Moves the selected column up or down in the list. The columnsdisplay in the Audit Trail window in order from the top column onthe left to the bottom column on the right.Saves the selections and applies the current column view to theAudit Trails window.Closes the window without saving changes to the selections.P/N 127170 Rev. 00 <strong>LabChip</strong> <strong>GX</strong> <strong>User</strong> <strong>Manual</strong> Caliper Life Sciences, Inc.
Software Reference 176CDR Manager WindowUse the CDR Manager Window to select a data file to open, tocreate, rename, or delete CDR data folders, and to show or hidedata files from view in the CDR Manager Window.To open the CDR Manager Window, select File Import <strong>GX</strong>D Fileon the <strong>LabChip</strong> <strong>GX</strong> Main Window. The CDR Manager window onlyopens if the 21 CFR Part 11 Security option is installed. If the 21CFR Part 11 Security option is not installed, see “Select a Data FileWindow” on page 202.Figure 69. CDR Manager WindowThe CDR Manager Window contains the following optionsLeft Side ButtonsImport Imports a CDR data file into the open workspace.ButtonCopy Button Copies the selected data file to another location.The copy of the data file will not be part of the CDRand will not be change-controlled.New Button Creates a new folder in the CDR.RenameButtonRenames the selected folder in the CDR. (Data filesin the CDR cannot be renamed.P/N 127170 Rev. 00 <strong>LabChip</strong> <strong>GX</strong> <strong>User</strong> <strong>Manual</strong> Caliper Life Sciences, Inc.
Software Reference 177DeleteButtonHide ButtonShowButtonDeletes an empty folder in the CDR. If the folder isnot empty, you cannot delete the folder.Hides the selected folder or data files from view inthe CDR Manager window. If a folder is selected, allfiles and subfolders in the selected folder arehidden.Displays all hidden data files and folders in theselected folder.Top Right ButtonsNew Button Creates a new folder in the CDR.DeleteButtonShow/HideHidden FilesButtonExpand AllButtonCollapse AllButtonDeletes an empty folder in the CDR. If the folder isnot empty, you cannot delete the folder.Shows or hides the filenames of all files that havebeen hidden in the CDR Manager window.Expands all folders in the CDR to show all data filesand folders.Closes all folders in the CDR folder.P/N 127170 Rev. 00 <strong>LabChip</strong> <strong>GX</strong> <strong>User</strong> <strong>Manual</strong> Caliper Life Sciences, Inc.
Software Reference 178CDR Server Utility WindowUse the CDR Server Utility Window to create a repository (theRemote CDR Server Folder) on a remote computer to back up theCDR. The repository stores secure backup copies of data files. TheCDR Server Utility Window is only available if the CDR ServerUtility is installed on the remote computer.To open the CDR Server Utility Window, double-click the CDRServer Utility icon on the remote computer desktop.Figure 70. CDR Server Utility WindowThe CDR Server Utility Window contains the following options:ServerFolderCreateServerFolderName<strong>User</strong>namePasswordConfirmPasswordGet FolderDetailscheck boxApply buttonThe name of the repository that will contain the datafolders.Creates the repository for backup data inC:\RemoteCDR.Specifies the name of the data folder to create inthe repository.Specifies the user name to use when accessing thedata folder.Specifies the password to use when accessing thedata folder.The same password as typed in the Password textbox.If selected, creates a text file containing the URL,Folder Name, <strong>User</strong>name, and Password for the newdata folder.Creates the specified data folder.P/N 127170 Rev. 00 <strong>LabChip</strong> <strong>GX</strong> <strong>User</strong> <strong>Manual</strong> Caliper Life Sciences, Inc.
Software Reference 179CDR Utility WindowUse the CDR Utility Window to view the location of the local CDRfolder, specify whether the CDR folder is accessible by WindowsAdministrators, and to enable Remote CDR Backup. Beforeenabling remote CDR Backup, the remote CDR server and foldermust be set up (see page 109).To open the CDR Utility Window, select Tools CDR Utility on the<strong>LabChip</strong> <strong>GX</strong> Main Window. The CDR Utility command is onlyavailable if the 21 CFR Part 11 Security option is installed.Figure 71. CDR Utility WindowThe CDR Window contains the following options:CDR FolderAccessible byWindowsAdministratorEnableRemote CDRBackupRemote CDRDatabaseFolder NameDisplays the location of the CDR folder where the<strong>LabChip</strong> <strong>GX</strong> data files will be saved. This locationcannot be changed.If selected, Windows Administrators who arelogged into the computer can access the CDRfolder. If not selected, access is denied to all usersand only the <strong>LabChip</strong> <strong>GX</strong> software can access thefolder.If selected, all new or edited data files areautomatically copied to the specified remotedatabase.Specifies the path to the remote database.Specifies the name of the folder in the database inwhich to save copies of the data files.P/N 127170 Rev. 00 <strong>LabChip</strong> <strong>GX</strong> <strong>User</strong> <strong>Manual</strong> Caliper Life Sciences, Inc.
Software Reference 180<strong>User</strong> NamePasswordApply buttonCancelbuttonSpecifies the user name assigned to the folderwhen the folder was created.Specifies the password assigned to the folderwhen the folder was created.Applies the changes and closes the window.Closes the window without saving any changes.P/N 127170 Rev. 00 <strong>LabChip</strong> <strong>GX</strong> <strong>User</strong> <strong>Manual</strong> Caliper Life Sciences, Inc.
Software Reference 181Change Password WindowUse the Change Password Window to change the password for thecurrent user. (To change passwords for other users, see <strong>User</strong>Administration Window.)To open the Change Password Window, select Security ChangePassword on the <strong>LabChip</strong> <strong>GX</strong> Main Window.Figure 72. Change Password WindowThe Change Password Window contains the following options:<strong>User</strong>nameCurrentPasswordNewPasswordConfirmPasswordOK buttonCancelbuttonDisplays the user name for the current user.Type the current password for the current user.Type the new password for the current user.Retype the new password for the current user.Saves the new password and closes the window.Closes the window without saving changes to thepassword.P/N 127170 Rev. 00 <strong>LabChip</strong> <strong>GX</strong> <strong>User</strong> <strong>Manual</strong> Caliper Life Sciences, Inc.
Software Reference 182Data File Version WindowUse the Data File Version Window to view the saved versions of thedata file. Also displays when the data file was signed.To open the Data File Version Window, select View VersionChange Details on the main menu.Figure 73. Data File Version WindowThe Data File Version Window lists each version of the plate datafile and describes the changes that were performed for eachversion change. Each time the data file is signed, the Data FileVersion Window lists the details of the signature. (To open adifferent version of the data file, click the Restore Plate button inthe Assay Analysis Window.)The Data File Version Window contains the following options:List ofVersionsDetailsPrintOptionsPrintPreviewPrintCloseDisplays the list of all saved data file versions andelectronic signatures.Displays the details of the changes or signature.All Versions: If selected, version information anddetails for all data versions is printed.Selected Version: If selected, version informationand details for only the selected version is printed.Opens the Print Preview window to preview theprinted version information.Opens the Print window to print the data file versioninformation.Closes the Data File Version window.P/N 127170 Rev. 00 <strong>LabChip</strong> <strong>GX</strong> <strong>User</strong> <strong>Manual</strong> Caliper Life Sciences, Inc.
Software Reference 183Event Viewer WindowUse the Event Viewer window to view events and errors that occurduring the current run or during a previous run.To open the Event Viewer window, select View Event Viewer onthe <strong>LabChip</strong> <strong>GX</strong> Main Window.Figure 74. Event Viewer WindowThe Event Viewer window contains the following tabs:Current Events tab - Displays the events that occurred during thecurrent session.Past Events tab - Displays all events from previous sessions.Search Results tab - Enables you to search for specified text inpast events, current events, or all events.The tabs on the Event Viewer window contain the followingcolumns:Column TitleTimeSourceEvent CodeDescriptionDescriptionThe data and time the event or error occurred.The system component that generated the event or error.The event/error ID number used by Caliper to troubleshoot errors.Text describing the event or error.Click the OK button to close the Event Viewer window.P/N 127170 Rev. 00 <strong>LabChip</strong> <strong>GX</strong> <strong>User</strong> <strong>Manual</strong> Caliper Life Sciences, Inc.
Software Reference 184Export WindowUse the Export window to export data manually. To open the Exportwindow, select File Export on the main Menu Bar.The Auto Export window contains the same options and is used toautomatically export data at the end of each run. To automaticallyexport data, click the Settings button next to Automatic Export inthe Output Tab on the Start Run Window.Peak Tables and Well Tables are exported to .CSV files, which canbe imported into a spreadsheet program such as Microsoft Excel.Raw Data can be exported to either a .CSV file or to aChromatography Data Interchange Format file (formerly AIA), whichis used by some graphical analysis software tools.Electropherogram and Gel data are exported to the selected imageformat. See “Exporting Data” on page 86 for instructions.Figure 75. Export WindowPeak TableIf selected, the data in the Peak Table View is exported to a .CSVfile. Click the Browse (...) button to specify the desired path and filename for the .CSV file.P/N 127170 Rev. 00 <strong>LabChip</strong> <strong>GX</strong> <strong>User</strong> <strong>Manual</strong> Caliper Life Sciences, Inc.
Software Reference 185Export Window (Continued)Well TableIf selected, the data in the Well Table View is exported to a .CSVfile. Click the Browse (...) button to specify the desired path and filename for the .CSV file.Raw DataIf selected, the raw (unanalyzed) data from the run is exported.• If the AIA Format check box is selected, the raw data isexported to a file in the Chromatography Data InterchangeFormat (formerly AIA). (Include Size Data and Export SingleTable are not available.)• If the AIA Format check box is NOT selected, the raw data isexported to a .CSV file. Click the Browse (...) button to specifythe desired path and file name for the .CSV file. The followingoptions are available:— Include Size Data: If selected, the data is aligned to thewell's ladder (for one file per well) or to the first well (for asingle data file) and the size data is included in theexported data. If not selected, the data is not aligned to aladder.— Export Single Table: If selected, the data for all wells inthe plate is exported to one .CSV file. If not selected, thedata from each well is exported to a separate .CSV file.ElectropherogramIf selected, the graph displayed in the Graph View is exported to thespecified folder in the selected image format. Click the Browse (...)button to specify the desired path for the image file. The file namesare _Gel_. The following options areavailable on the Export window. (These options are not available onthe Auto Export window.)• Entire Collection: If selected, a separate graph is exported foreach well in the collection.• Selected Wells: If selected, a separate graph is exported foreach of the wells selected in the Gel View or Plate View or PlateList.P/N 127170 Rev. 00 <strong>LabChip</strong> <strong>GX</strong> <strong>User</strong> <strong>Manual</strong> Caliper Life Sciences, Inc.
Software Reference 186Export Window (Continued)GelIf selected, the gels selected in the Gel View are exported to thespecified folder in the selected image format. Click the Browse (...)button to specify the desired path for the image file. The file namesare _Gel_. The following options areavailable on the Export window. (These options are not available onthe Auto Export window.)• Entire Collection: If selected, a gel is exported for each well inthe collection.• Selected Wells: If selected, a gel is exported for each of thewells selected in the Gel View or Plate View or Plate List.• Single File: If selected, the selected gels are all included in thesame image file.• Separate Files: If selected, the selected gels are each exportedto a separate image file.• Contrast Lane: Specifies the gel lane to use to set the minimumand maximum RFU values for all lanes in the collection orselected wells before exporting the gels. All exported gels areset to the minimum and maximum RFU values in the selectedlane. The contrast lane option only displays in the Auto Exportwindow after the dwell pattern has been selected.• Height: Specifies the desired height, in pixels, of the gelgraphic.Image Format for Gel and ElectropherogramSelect the desired format for the exported image files.P/N 127170 Rev. 00 <strong>LabChip</strong> <strong>GX</strong> <strong>User</strong> <strong>Manual</strong> Caliper Life Sciences, Inc.
Software Reference 187Installation Qualification WindowUse the Installation Qualification Window to perform the IQ test.The IQ test verifies proper installation of the <strong>LabChip</strong> <strong>GX</strong> softwareand verifies no unauthorized changes have been made to thesoftware. To open the Installation Qualification Window, selectValidation Software IQ on the <strong>LabChip</strong> <strong>GX</strong> Main Window.Figure 76. Installation Qualification WindowThe Installation Qualification Window contains the followinginformation:ApplicationInformationDirectoryStructureFilesSummaryProgressView DetailsButtonPrevious ResultbuttonSave As buttonStart IQ buttonClose buttonVerifies that the <strong>LabChip</strong> <strong>GX</strong> Registry Entries exist. If all expectedregistry entries are found, displays Passed. If any problems arefound, displays Failed.Verifies that all folders exist. If all expected folders exist, displaysPassed. If any folders are not found, displays Failed.Verifies that all files that were installed by the <strong>LabChip</strong> <strong>GX</strong>software still exist. If all file exist, displays Passed. If any files arenot found, displays Failed.Displays Passed if all tests passed. Displays Failed if any of theIQ tests failed.Displays a progress bar while the IQ test is running.Displays the detailed results of the current IQ. (Only displays afterthe IQ has been completed.)Displays the results of the last IQ that was completed. (Onlyavailable before another IQ test is run.)Saves the results of the IQ in an .xml file.Begins running the IQ.Closes the Installation Qualification Window.P/N 127170 Rev. 00 <strong>LabChip</strong> <strong>GX</strong> <strong>User</strong> <strong>Manual</strong> Caliper Life Sciences, Inc.
Software Reference 188Layout Options WindowUse the Layout Options window to change the location of the viewsin a collection. To open the Layout Options window, selectCollection Layout on the <strong>LabChip</strong> <strong>GX</strong> Main Window.Figure 77. Layout Options WindowViewer - Lists the viewers available to display in the CollectionPane.Left - If selected, the view displays on the right side of theCollection pane. (The view displays at the top if any view is selectedto display at the bottom of the pane.)Right - If selected, the view displays on the left side of theCollection pane. (The view displays at the top if any view is selectedto display at the bottom of the pane.)Bottom - If selected, the view displays at the bottom of theCollection pane. (The view displays at the top if there are no viewsdisplayed at the top left or right in the pane.)NOTES• A view can only be displayed in one location. Selecting alocation automatically clears any other selected location.• To hide a view, click on the selected location to clear theselection.• A location is hidden if it contains no views.• The Gel View is always displayed and cannot be hidden.P/N 127170 Rev. 00 <strong>LabChip</strong> <strong>GX</strong> <strong>User</strong> <strong>Manual</strong> Caliper Life Sciences, Inc.
Software Reference 189Login WindowUse the Login Window to log into the <strong>LabChip</strong> <strong>GX</strong> software whenthe 21 CFR Part 11 option is installed. The <strong>LabChip</strong> <strong>GX</strong> softwarewill not start until a valid user name and password are entered.The Login Window opens when you start the <strong>LabChip</strong> <strong>GX</strong> softwarewith the 21 CFR Part 11 option is installed.Figure 78. Login WindowThe Login Window contains the following options:<strong>User</strong>nametext boxPasswordtext boxType the username to log into the <strong>LabChip</strong> <strong>GX</strong>software. Each user should have a unique username.Type the password assigned to the <strong>User</strong>name. Allpasswords must be at least 5 characters long andmust contain at least one uppercase letter and atleast one number. The <strong>User</strong> Account Policiesspecify additional password requirements.P/N 127170 Rev. 00 <strong>LabChip</strong> <strong>GX</strong> <strong>User</strong> <strong>Manual</strong> Caliper Life Sciences, Inc.
Software Reference 190New Collection WindowThe New Collection window is used to create a new collection usingeither a Blank Collection (default) or a Template. To open the NewCollection window, select Collection New Collection on the<strong>LabChip</strong> <strong>GX</strong> Main Window.Figure 79. New Collection WindowThe following options are available:Template - Opens a blank collection and then applies the selectedcollection template.Blank Collection - Opens a blank collection that does not containany data. The new collection will use the same settings as the lastsaved collection of the same assay type.The current collection settings are automatically saved in a blankcollection template in the current user’s “Documents and Settings”folder on the local computer. These preferences are applied when ablank collection is created. <strong>User</strong> preferences are saved by assay type,with separate settings saved for DNA, RNA, Protein and Glycanassays.Current Collection - Opens a blank collection and applies thesettings from the currently open collection as a template.Assay Type (DNA, Protein, RNA, or Glycan) - Specifies the type ofdata files that can be imported into the collection. Only enabled ifthis is the first collection and no plates have been imported into theworkspace. If a workspace already contains a collection, all newcollections are the same type as the existing collections. (Proteinand Glycan assays are only supported on <strong>LabChip</strong> <strong>GX</strong> IIinstruments.)Name - Specifies the name of the new collection.P/N 127170 Rev. 00 <strong>LabChip</strong> <strong>GX</strong> <strong>User</strong> <strong>Manual</strong> Caliper Life Sciences, Inc.
Software Reference 191Perform Signature WindowUse the Perform Signature Window to add an electronic signatureto a data file. Signatures can be added as required by thecompany’s standard operating procedures. (Data files cannot besigned while the assay is running.) If multiple data files are open inthe workspace, only one data file can be signed at a time.To open the Perform Signature Window, select Security Perform Signature on the <strong>LabChip</strong> <strong>GX</strong> Main Window.Figure 80. Perform Signature WindowThe Perform Signature Window contains the following options:Data File Name<strong>User</strong>nameRoleComment<strong>User</strong> PasswordSign buttonCancel buttonDisplays the name of the data file being signed.Select the username of the user that is signing the data file.Displays the Access Level of the selected <strong>LabChip</strong> <strong>GX</strong> user.Details on why the signature is being performed and what actionshave taken place. It is the signer’s responsibility to ensure alldetails required by the company’s procedures are included in thiscomment.The password for the user.Signs the data file and closes the window.Closes the window without signing the data file.P/N 127170 Rev. 00 <strong>LabChip</strong> <strong>GX</strong> <strong>User</strong> <strong>Manual</strong> Caliper Life Sciences, Inc.
Software Reference 192Plate Information WindowUse the Plate Information window to view, add, or change platenames and measurements. To open the Plate Information window,select Tools Plate Editor on the <strong>LabChip</strong> <strong>GX</strong> Main Window.Figure 81. Plate Information WindowThe Plate Information window contains the following tabs:• Predefined Plates - Displays Caliper-defined plates. Theseplates are read-only and cannot be edited or deleted.• Custom Plates - Displays all user-created plates. Plates can beadded, deleted, and modified.The Plate Information window contains the following options andbuttons:Plate InformationtableDelete SelectedPlateAdd PlateModify SelectedPlateVerify PlateClose buttonDisplays the plate information for each plate defined for use inthe system. (See “Add Plate Window” on page 152 for adescription of each column.)Deletes the selected plate from the system. (Only availablewhen the Custom Plates tab is selected.)Opens the Add Plate Window to enter the information for anew plate. (Only available when the Custom Plates tab isselected.)Opens the Add Plate Window to edit the information for theselected plate. (Only available when the Custom Plates tab isselected.)Opens the Verify Plate window to perform a puncture testusing the selected plate information. Follow the instructions inthe Verify Plate window to test the settings for the selectedplate.Closes the Plate Information window.P/N 127170 Rev. 00 <strong>LabChip</strong> <strong>GX</strong> <strong>User</strong> <strong>Manual</strong> Caliper Life Sciences, Inc.
Software Reference 193Print WindowUse the Print window to print information from the currently openworkspace. If the workspace contains multiple collections,information from the active (selected) collection is printed. To openthe Print window, select Tools Print on the <strong>LabChip</strong> <strong>GX</strong> MainWindow.Figure 82. Print WindowThe Print window provides the following options for printing:• Print All - Selects all of the options.• Gel - Prints a graphic of the gel for either all wells in thecollection or all selected wells.• Electropherogram - Prints a graph of either all wells in thecollection or all selected wells.• Overlay Electropherogram - Prints a graphic of allelectropherograms (either all selected or all in the collection)over-laid onto the same graph.• Well Table - Prints the well table for either all wells in thecollection or all selected wells. The columns selected for view inthe well table are printed. Changing the columns selected toview in the Well Table View changes the columns that areprinted.• Peak Table - Prints the peak table for all wells in the collectionor all selected wells. The columns selected for view in the peaktable are printed. Changing the columns selected to view in thePeak Table View changes the columns that are printed.• Exclude Marker - If selected, markers are not printed.Page Option - Select the page orientation, either Portrait orLandscape.P/N 127170 Rev. 00 <strong>LabChip</strong> <strong>GX</strong> <strong>User</strong> <strong>Manual</strong> Caliper Life Sciences, Inc.
Software Reference 194Print Window (Continued)Well Option - Select the wells to be included in the printout, eitherEntire Collection or Selected Wells.Preview button - Displays a preview of the selected options.Add Border Option - If selected, the Well Table and Peak Table willprint with a border between each column and a border below thecolumn header.Add Well Name as Header - If selected, a well header, containingthe plate, well, and sample name for the well, is printed before eachset of peaks in a well. (This option is only available if Peak Table isselected.)Column Header - Specifies where to print the column headers,which identify each column in the Peak Table. (This option is onlyavailable if Peak Table is selected and Well Table is not selected.)• If Per Page is selected, the column header is printed only at thetop of each page.• If Per Well is selected, the column header is printed at the top ofeach page and at the start of each new well.P/N 127170 Rev. 00 <strong>LabChip</strong> <strong>GX</strong> <strong>User</strong> <strong>Manual</strong> Caliper Life Sciences, Inc.
Software Reference 195Print Validation Reports WindowUse the Print Validation Reports Window to print the results afterperforming Installation Qualification (IQ) or OperationalQualification (OQ). OQ is performed in the System DiagnosticsWindow.To open the Print Validation Reports Window, select Validation Reports on the <strong>LabChip</strong> <strong>GX</strong> Main Window.Figure 83. Print Validation Reports WindowThe Print Validation Reports Window contains:Option/ButtonDiagnostics ReportSoftware IQ ReportFailed Tests OnlyReport PeriodPrint PreviewbuttonPrint buttonClose buttonFunctionIf selected, the results of Hardware OQ tests are printed.If selected, the results of Software IQ tests are printed.If selected, only tests that have failed are printed. If notselected, both passed and failed tests are printed.Specifies the dates when the tests were run. Tests performedbetween the From and To dates (inclusive) are printed.Displays a preview of the report and enables you to print orexport the results.Opens the Print window to print the report.Closes the window.P/N 127170 Rev. 00 <strong>LabChip</strong> <strong>GX</strong> <strong>User</strong> <strong>Manual</strong> Caliper Life Sciences, Inc.
Software Reference 196Rename Collection WindowUse the Rename Collection window to rename the currentlyselected collection. The collection name displays on the Collectiontab at the top of the <strong>LabChip</strong> <strong>GX</strong> Main Window. To open theRename Collection window, select Collection RenameCollection on the <strong>LabChip</strong> <strong>GX</strong> Main Window.Figure 84. Rename Collection WindowName - Type the desired name for the selected collection.P/N 127170 Rev. 00 <strong>LabChip</strong> <strong>GX</strong> <strong>User</strong> <strong>Manual</strong> Caliper Life Sciences, Inc.
Software Reference 197Run File Editor WindowUse the Run File Editor window to create run files (*.xml) for usewith Caliper's automation control software. When the <strong>LabChip</strong> <strong>GX</strong> isrunning in automation mode and is being controlled by softwaresuch as iLink Pro, you must create a run file to specify the settingsfor the assay that will be run. The run file contains all of the runsettings that would be specified in the Start Run Window. Run filescan also be imported into the Start Run window to start a run.To open the Run File Editor window, choose Tools Run FileEditor on the <strong>LabChip</strong> <strong>GX</strong> Main Window.Figure 85. Run File Editor WindowThe tabs on the Run File Editor contain the same options as thetabs on the Start Run window. See Start Run Window for definitionsof specific options or settings.The following buttons are located at the bottom of the Run FileEditor window:ButtonExportImportCloseDescriptionSaves the selected settings in a run file with the specified name (*.xml).Imports the settings from an existing run file (*.xml) into the Run FileEditor window.Closes the Run File Editor window without saving the settings.P/N 127170 Rev. 00 <strong>LabChip</strong> <strong>GX</strong> <strong>User</strong> <strong>Manual</strong> Caliper Life Sciences, Inc.
Software Reference 198Run Info WindowUse the Run Info window to view information about the run optionsfor the selected plate data file.To open the Run Info window, select View Run Info on the<strong>LabChip</strong> <strong>GX</strong> Main Window, or right-click on the name of the data fileabove the plate diagram and select Run Info.Figure 86. Run Info WindowThe information in this window is view-only and cannot be changed.The Run Info tab displays assay information and run information.The Event Log tab displays the events that occurred during therun.The Run Info window contains the following buttons:PrintPreviewPrintCancelOpens the Print Preview window to view the run information beforeprinting.Opens the Print window to print the run information.Closes the Run Info window.P/N 127170 Rev. 00 <strong>LabChip</strong> <strong>GX</strong> <strong>User</strong> <strong>Manual</strong> Caliper Life Sciences, Inc.
Software Reference 199Sample Name Editor WindowUse the Sample Name Editor window to specify names for thesamples in the plate. For DNA, Protein, and Glycan assays, alsocan be used to view, add, edit, or delete expected peaks. SampleNames can be exported to a .CSV file to be re-used in otherworkspaces or for other plates.To open the Sample Name Editor window, choose Tools SampleName Editor on the <strong>LabChip</strong> <strong>GX</strong> Main Window.Figure 87. Sample Name Editor WindowEdit Expected Peaks check box - If selected, displays theExpected Peaks and Window (%) columns for DNA, Protein, andGlycan assays. This option is not available for RNA assays.The following columns display in the Sample Name Editor window:ColumnWell LabelSample NameSampleCommentDescriptionDisplays the row letter and column number of each well.The sample name for the sample in the specified well. Type anew name to change the sample name.Any comment to be associated with each well of the plate.Displays in the Well Table View.P/N 127170 Rev. 00 <strong>LabChip</strong> <strong>GX</strong> <strong>User</strong> <strong>Manual</strong> Caliper Life Sciences, Inc.
Software Reference 200Expected PeaksWindow (%)Displays the Expected Peaks for DNA, Protein, or Glycanassays. (The Expected Peaks are also displayed in the ExpectedFragments/Proteins/Glycans Tab on the Assay AnalysisWindow.)Only displays if the Edit Expected Peaks check box is selected.Specifies the tolerance window as a percent of the expected sizefor the peak to allow for small variations in expected peak size.Only displays if the Edit Expected Peaks check box is selected.The following buttons are located at the bottom of the SampleName Editor window:ButtonImportExportBlank 96 WellsBlank 384 WellsApplyCloseDescriptionImports a sample name file (*.csv) into the Edit Sample Nameswindow.Exports the current sample names and comments into a .csv file.SeeClears the sample names in the window and creates a newsample name that is the same as the well label for each well in a96 well plate.Clears the sample names in the window and creates a newsample name that is the same as the well label for each well in a384 well plate.Applies the sample name changes to the plate. Sample namescannot be applied during a run.Closes the Edit Sample Names window. If changes have notbeen applied to the plate, prompts you to discard the changes. Tosave the changes, click the Apply button before clicking theClose button.P/N 127170 Rev. 00 <strong>LabChip</strong> <strong>GX</strong> <strong>User</strong> <strong>Manual</strong> Caliper Life Sciences, Inc.
Software Reference 201Save Workspace As WindowThe Save Workspace File As window saves the currently openworkspace with the specified name in the specified location.To open this window, choose File Save Workspace As. Thiswindow also opens the first time you save a new workspace.Figure 88. Save Workspace As WindowTip: You may want to save the workspace file in the same locationas the plate data files to prevent missing plate data files whenmoving workspace files.P/N 127170 Rev. 00 <strong>LabChip</strong> <strong>GX</strong> <strong>User</strong> <strong>Manual</strong> Caliper Life Sciences, Inc.
Software Reference 202Select a Data File WindowWhen you choose Import Data File from the File Menu, the Selecta Data File window opens as shown in Figure 89. (If the 21 CFRPart 11 option is installed, the CDR Manager Window opens.) Datafiles generated by the <strong>LabChip</strong> <strong>GX</strong> software have a .gxd fileextension. Data files generated by the <strong>LabChip</strong> HT software have a.cla file extension;change the File Type to display .cla files.Figure 89. Select A Data File WindowSelect a data file name in the list box and click the Open button ordouble-click a file name to open the data file.To select multiple files, press and hold CTRL then click each filename. To select a continuous block of files, click the first file, pressand hold SHIFT, and then click the last file. To select all files, pressCTRL+A.P/N 127170 Rev. 00 <strong>LabChip</strong> <strong>GX</strong> <strong>User</strong> <strong>Manual</strong> Caliper Life Sciences, Inc.
Software Reference 203Start Run WindowThe Start Run window specifies the assay to run, the plate type, thewells to read, the options for the data file, auto export settings, platecycles, and import options for sample names and expected peaks.Figure 90. DNA Assay Start Run WindowThe Start Run window opens when you click the Start button abovethe plate icon. To begin the run, select the desired settings on eachtab and then click the Start button.The Start Run Window contains the following tabs:• Run Tab• Output Tab• Advanced TabThe following buttons are located at the bottom of the Start Runwindow:ButtonStartImportCancelDescriptionStarts the run using the options specified in the tabs on the Start Runwindow.Imports the settings from a run file (*.xml) into the Start Run window.(Use the Run File Editor Window to create a run file.)Closes the Start Run window without saving any changes and withoutstarting the run.P/N 127170 Rev. 00 <strong>LabChip</strong> <strong>GX</strong> <strong>User</strong> <strong>Manual</strong> Caliper Life Sciences, Inc.
Software Reference 204Run TabUse the Run tab in the Start Run Window to specify the assay type,operator name, plate type, barcode option, sample wells, andsipping order for the run. (Protein and Glycan assays are onlysupported on <strong>LabChip</strong> <strong>GX</strong> II instruments.)Figure 91. Start Run Window - Run TabAssay TypeSelect the type of assay to run. The assay types available dependon the type of chip that is loaded in the instrument. The instrumentautomatically identifies the chip type when the chip is loaded in theinstrument.OperatorSpecifies the name of the operator running the assay. The OperatorName is saved in the data file.Plate NameChoose the type of plate that will be used in the run.Use Barcode check boxIf selected, the <strong>LabChip</strong> <strong>GX</strong> will read the customer-applied barcodeon the short (portrait) end of the plate. The barcode will be saved inthe data file and can be used as part of the name of the data file.P/N 127170 Rev. 00 <strong>LabChip</strong> <strong>GX</strong> <strong>User</strong> <strong>Manual</strong> Caliper Life Sciences, Inc.
Software Reference 205Run Tab (Continued)SamplesSelect the wells to be read during the assay. Selected wells areblue, cleared (not read) wells are white.• To select all wells on the plate, click the double-arrow button inthe lower-right corner of the plate.• To select all rows on the plate, click the double-arrow button atthe top left corner of the plate.• To select all columns on the plate, click the double-down-arrowbutton at the top right corner of the plate.• To select a column, click the column number at the top orbottom of the plate.• To select a row, click the row letter on the left or right side of theplate.• Clear specific wells by clicking on the selected well again.Sipping OrderSelect the order in which the wells will be sampled during the assay.• Select Row-wise to sample all wells in each row beforeproceeding to the next row (A1, A2, A3...).• Select Column-wise to sample all wells in each column beforeproceeding to the next column (A1, B1, C1...). Ladders aresipped every 12 wells, so some columns will include a ladder inthe middle of the column.P/N 127170 Rev. 00 <strong>LabChip</strong> <strong>GX</strong> <strong>User</strong> <strong>Manual</strong> Caliper Life Sciences, Inc.
Software Reference 206Output TabThe Output tab on the Start Run Window specifies the location,name, and export settings for plate data files (*.gxd) created duringthe run.The data file name can include a specific prefix, the date, the time,and the plate barcode. For example, including the prefix<strong>LabChip</strong>_<strong>GX</strong>, the barcode, the date, and the time would create filenames such as <strong>LabChip</strong>_<strong>GX</strong>__2008-04-24_10-23-48.NOTEIf you choose not to use the time of the run as part of the data filename, the <strong>LabChip</strong> <strong>GX</strong> software automatically appends _1, _2, etc.,for each subsequent run on the same day.Figure 92. Start Run Window - Output TabData PathSpecifies the location where the data files will be saved.21 CFR Part 11 option not installed: The default location isC:\Program Files\Caliper Life Sciences\<strong>LabChip</strong> <strong>GX</strong>\Data\. Click theBrowse button to choose a different location. Click the Defaultbutton to reset the text box to the default directory.21 CFR Part 11 option installed: The default location isC:\Program Files\Caliper Life Sciences\CDR\. Click the Browsebutton to choose a folder in the CDR. Click the Default button toreset the text box to the default directory.P/N 127170 Rev. 00 <strong>LabChip</strong> <strong>GX</strong> <strong>User</strong> <strong>Manual</strong> Caliper Life Sciences, Inc.
Software Reference 207Output Tab (Continued)NOTEData files should be saved to a local folder on the computer's harddrive. Saving data files to a network drive may cause loss of data ifthe network connection is slow or interrupted.Create Daily Sub-Directory check boxIf selected, a new directory is created each day in the specifiedData Path, and all of the data files from that day are saved in thedirectory. The directory name is the current date, and the format isYYYY-MM-DD, where YYYY is the year, MM is the month, and DDis the day.Copy ToIf selected, the data file is copied to the specified folder after the runis complete.File PrefixSpecifies the text for the first characters of the data file name.Computer NameIf selected, adds the name of the <strong>LabChip</strong> <strong>GX</strong> computer to the datafile names.Project NameThe text is added to the data file names.Barcode check boxIf selected, the instrument reads the customer-supplied barcode onthe short (portrait) edge of the microplate and includes the barcodein the data file name.Date check boxIf selected, the current date is included in the data file name. Thedate format is YYYY-M-DD, where YYYY is the year, M is themonth, and DD is the day. The date is automatically added to thedata file name when the 21 CFR Part 11 option is installed.Time check boxIf selected, the time that the run was started is included in the datafile name. The time format is H-M-S, where H is the hour (0 to 24),M is the minutes, and S is the seconds. The time is automaticallyadded to the data file name when the 21 CFR Part 11 option isinstalled.P/N 127170 Rev. 00 <strong>LabChip</strong> <strong>GX</strong> <strong>User</strong> <strong>Manual</strong> Caliper Life Sciences, Inc.
Software Reference 208Output Tab (Continued)Advanced TabFile Name Example text boxRead-Only text box that displays the selected format for the data filename.Automatic ExportIf selected, data is automatically exported at the end of each run.Select the type of data to export by clicking the Settings button andchoosing the desired settings in the Export Window. For moreinformation, see Exporting Data.Use the Advanced tab on the Start Run Window to select thenumber of plate cycles, the sample saver option, the Sample Filename, and the Expected Peak File name.Figure 93. Start Run Window - Advanced TabThe Advanced tab contains the following options:Plate CyclesSpecifies how many times to repeat the same assay on the plate.Random Selection %If selected, the instrument will randomly sample the specifiedpercent of wells from the selected wells. For example, if 10 wellsare selected, and the Random Selection percent is set to 50%, fivewells, selected at random, will be sampled during the run.P/N 127170 Rev. 00 <strong>LabChip</strong> <strong>GX</strong> <strong>User</strong> <strong>Manual</strong> Caliper Life Sciences, Inc.
Software Reference 209Advanced Tab (Continued)Sample SaverIf selected, the selected wells are run the specified number oftimes. Each well is samples once then the entire run repeats. Thedata from all wells is combined in the same data file.Sample Names FileSpecifies the file that will supply the names of the samples in theassay. Click the Browse button next to Sample Names File, selectthe name of the .CSV file that contains the sample names, and clickthe Open button. The path and name of the file displays in the textbox. (Use the Sample Name Editor Window to create Sample Namefiles.)Expected Peaks FileSpecifies the file that will supply the Expected Peaks for the assay.Click the Browse button next to Expected Peaks File, select thename of the .GEP file that contains the expected peaks, and clickthe Open button. The path and name of the file displays in the textbox. (See “Using Expected Fragments/ Expected Proteins/Expected Glycans” on page 57 for more information. Use theExpected Fragments/Proteins/Glycans Tab on the Assay AnalysisWindow to create the Expected Peaks file.)Excluded Peaks FileSpecifies the file that will supply the Excluded Peaks for the assay.Click the Browse button next to Excluded Peaks File, select thename of the .GEP file that contains the excluded peaks, and clickthe Open button. The path and name of the file displays in the textbox.P/N 127170 Rev. 00 <strong>LabChip</strong> <strong>GX</strong> <strong>User</strong> <strong>Manual</strong> Caliper Life Sciences, Inc.
Software Reference 210System Diagnostics WindowUse the System Diagnostics window to run the diagnostics tests onthe <strong>LabChip</strong> <strong>GX</strong> or <strong>GX</strong> II instrument. All tests should be runperiodically to verify proper operation of the instrument. To verifyproper operation of a particular function, you can select specifictests to run. To open the System Diagnostics window, selectValidation Diagnostics.Figure 94. System Diagnostics WindowThe left side of the window displays the tests to run on theinstrument. Expand each section to view all of the tests in eachsection. Tests selected with a green check mark will run. To skip atest, click on the check box to clear the selection. Click on a sectioncheck box to select or clear all of the tests in the section.P/N 127170 Rev. 00 <strong>LabChip</strong> <strong>GX</strong> <strong>User</strong> <strong>Manual</strong> Caliper Life Sciences, Inc.
Software Reference 211System Diagnostics Window (Continued)The right side of the window displays the results of the tests. Theicon color indicates the status of each test:• Blue - The test is in progress.• Yellow - The test was skipped.• Green - The test passed.• Red - The test failed or was aborted.The bottom of the window displays a progress bar for the entire setof selected tests and a separate progress bar for the test that iscurrently running.After all tests are complete, the Test Report Generation section atthe bottom of the right side of the window displays the date and timewhen the test report was created, the name of the test report (*.log),and the location where the test report was saved. Test report filescan be opened with a text editor such as Windows Notepad.P/N 127170 Rev. 00 <strong>LabChip</strong> <strong>GX</strong> <strong>User</strong> <strong>Manual</strong> Caliper Life Sciences, Inc.
Software Reference 212Unlock Application WindowUse the Unlock Application Window to access the <strong>LabChip</strong> <strong>GX</strong>software after it automatically locks. This window displays on top ofthe <strong>LabChip</strong> <strong>GX</strong> software when the software is locked. Theautomatic lock option is set in the Set Policies tab on the <strong>User</strong>Administration Window. This window only displays if the 21 CFRPart 11 option is installed.Figure 95. Unlock Application WindowThe Unlock Application Window contains:Option/Button<strong>User</strong>namePasswordOK buttonFunctionType the user name of the current user or a <strong>LabChip</strong> <strong>GX</strong>administrator’s user name.Type the password for the specified user name.Verifies the username and password and opens the <strong>LabChip</strong><strong>GX</strong> software if the username and password are correct.P/N 127170 Rev. 00 <strong>LabChip</strong> <strong>GX</strong> <strong>User</strong> <strong>Manual</strong> Caliper Life Sciences, Inc.
Software Reference 213<strong>User</strong> Administration WindowUse the <strong>User</strong> Administration window to create new <strong>LabChip</strong> <strong>GX</strong>users, to edit existing users, to view user information, to activate ordeactivate users, to set rights for each access level, and to set<strong>LabChip</strong> <strong>GX</strong> software policies.To open the <strong>User</strong> Administration window, choose Security <strong>User</strong>and System Administration.Figure 96. <strong>User</strong> Administration windowThe <strong>User</strong> Administration window contains the following tabs:• “Create New <strong>User</strong>” on page 214• “Edit <strong>User</strong>s” on page 215• “Show <strong>User</strong> Info” on page 216• “De/Activate <strong>User</strong>” on page 217• “Define Access” on page 218• “Set Policies” on page 220Close button - Closes the <strong>User</strong> Administration window withoutsaving changes. Save the changes on each tab before closing thewindow.P/N 127170 Rev. 00 <strong>LabChip</strong> <strong>GX</strong> <strong>User</strong> <strong>Manual</strong> Caliper Life Sciences, Inc.
Software Reference 214Create New <strong>User</strong>Use the Create New <strong>User</strong> tab to add a new user name to the<strong>LabChip</strong> <strong>GX</strong> software. This window creates the <strong>LabChip</strong> <strong>GX</strong> useraccount, it does not create a Windows user account.Figure 97. <strong>User</strong> Administration Window - Create New <strong>User</strong>The Create New <strong>User</strong> tab contains:Option/Button<strong>User</strong>nameFirst NameMiddle NameLast NamePositionAccess LevelPasswordConfirm Password<strong>User</strong> Can PerformSignatureFunctionType the user name that the new user will use to log into the<strong>LabChip</strong> <strong>GX</strong> software.Type the first name of the user.Type the middle name or initial of the user.Type the last name of the user.If desired, type the job title of the user.Choose the access level for the user. The access levelcontrols the user’s rights in the <strong>LabChip</strong> <strong>GX</strong> software. Thefollowing access levels are available:• Restricted <strong>User</strong>• Operator• Supervisor• Administrator• ServiceType the desired password for the user. The password mustmeet the password policies selected on the Set Policies tab.Repeat the desired password for the user.If selected, the user can sign data files using the PerformSignature Window.P/N 127170 Rev. 00 <strong>LabChip</strong> <strong>GX</strong> <strong>User</strong> <strong>Manual</strong> Caliper Life Sciences, Inc.
Software Reference 215Edit <strong>User</strong>sUse the Edit <strong>User</strong>s tab to edit an existing user account.Figure 98. <strong>User</strong> Administration Window - Edit <strong>User</strong>sThe Edit <strong>User</strong>s tab contains:Option/ButtonSelect <strong>User</strong> to EditFirst NameMiddle NameLast NamePositionAccess Level<strong>User</strong> Can PerformSignatureEdit <strong>User</strong> PasswordPasswordConfirm PasswordFunctionSelect the <strong>User</strong>name for the account to edit.The first name of the user.The middle name or initial of the user.The last name of the user.If desired, the job title of the user.The Access Level of the user.If selected, the user can sign data files using the PerformSignature Window.If selected, the user’s password can be changed.Type the desired password for the user. The password mustmeet the password policies selected on the Set Policies tab.Repeat the desired password for the user.P/N 127170 Rev. 00 <strong>LabChip</strong> <strong>GX</strong> <strong>User</strong> <strong>Manual</strong> Caliper Life Sciences, Inc.
Software Reference 216Show <strong>User</strong> InfoUse the Show <strong>User</strong> Information tab to view the account informationfor an existing username.Figure 99. <strong>User</strong> Administration Window - Show <strong>User</strong> InfoThe Show <strong>User</strong> Info tab contains:Option/Button<strong>User</strong>nameFull NamePositionAccess LevelCan PerformSignatureAccount CreatedLast ChangedStatusPrint All <strong>User</strong>scheck boxPrint PreviewbuttonPrint buttonFunctionSelect the <strong>User</strong>name for the account to view.The first, middle, and last name of the user.The job title of the user.Displays the Access Level of the user.Displays Yes if the user has rights to perform signatures.Displays No if the user does not have rights.Displays the date and time when the account was created.Displays the date and time when the account was lastchanged.Displays Active if the user account is activated. DisplaysDeactivated if the account has been deactivated.If selected, information for all user accounts will be printed.Displays a preview of the printed report. The report can beexported to a .rpt file from the Print Preview window.Opens the Print window to print the report.P/N 127170 Rev. 00 <strong>LabChip</strong> <strong>GX</strong> <strong>User</strong> <strong>Manual</strong> Caliper Life Sciences, Inc.
Software Reference 217De/Activate <strong>User</strong>Use the De/Activate <strong>User</strong> tab to Deactivate an active user or toActivate a deactivated user. <strong>User</strong>s cannot be deleted from thedatabase. <strong>User</strong> names that will not be used should be deactivatedto prevent unauthorized access to the <strong>LabChip</strong> <strong>GX</strong> software.Figure 100. <strong>User</strong> Administration Window - De/Activate <strong>User</strong>The De/Activate <strong>User</strong> Info tab contains:Option/ButtonSelect <strong>User</strong><strong>User</strong> InfoActivate buttonDeactivate buttonFunctionSelect the username to be activated or deactivated.Displays the information associated with the selectedusername.Click to activate a deactivated username.Click to deactivate an active username.P/N 127170 Rev. 00 <strong>LabChip</strong> <strong>GX</strong> <strong>User</strong> <strong>Manual</strong> Caliper Life Sciences, Inc.
Software Reference 218Define AccessUse the Define Access Tab to assign the desired rights to eachaccess level. These rights control the actions each user is permittedto perform in the <strong>LabChip</strong> <strong>GX</strong> software. The Define Access tab isnot available while an assay is running.Figure 101. <strong>User</strong> Administration Window - Define AccessThe Define Access tab displays a column for each access level(Administrator, Supervisor, Operator, Restricted <strong>User</strong>, and Service).Select Enabled for each right to be allowed for an access level, orselect Disabled for each right not allowed for an access level.The table below describes the function of each Access Right.Access Right<strong>User</strong> AdministrationRun AssaySave Existing DataFileSave WorkspacePlate EditorFunctionIf enabled, allows access to the <strong>User</strong> Administration Windowto add and edit users, set access rights, and set policies.If enabled, allows users to run assays and save the new datafiles that are created by the run. <strong>User</strong>s are not permitted tosave changes to existing data files.If enabled, allows users to save changes to existing datafiles.If enabled, allows users to save new and existingworkspaces. If Save Existing Data Files is not selected,users can only save workspaces where the data files havenot changed.If enabled, allows users to add or edit plate dimensions in thePlate database.P/N 127170 Rev. 00 <strong>LabChip</strong> <strong>GX</strong> <strong>User</strong> <strong>Manual</strong> Caliper Life Sciences, Inc.
Software Reference 219Show/Hide in CDRManage CDRFoldersPerform ValidationPrint/Export AnalysisResultsAudit Trail AccessAssay EditorIf enabled, allows users to hide and show data files in theCDR Manager Window.If enabled, allows users to create, rename, and delete foldersin the CDR Manager window.This permission is not requiredfor automatically creating daily subdirectories or to movedata files in the CDR.If enabled, allows users to perform IQ (InstallationQualifications) and OQ (Operation Qualifications).If enabled, allows users to print or export analysis results.If enabled, allows users to view the Audit Trail in the AuditTrail Window.If enabled, allows users to edit and save assays.P/N 127170 Rev. 00 <strong>LabChip</strong> <strong>GX</strong> <strong>User</strong> <strong>Manual</strong> Caliper Life Sciences, Inc.
Software Reference 220Set PoliciesUse the Set Policies tab to specify password, login, automatic lock,and signature policies for the <strong>LabChip</strong> <strong>GX</strong> software.Figure 102. <strong>User</strong> Administration Window - Set PoliciesThe Set Policies tab contains:Access RightPassword Expires AfterNumber of RetiredPasswords to RememberMinimum PasswordLengthMaximum Login AttemptsMinutes to AutomaticLockRequire Signature on FileUpdateFunctionSpecifies the number of days until each passwordexpires. Range is 1 to 1000 days.<strong>User</strong> cannot reuse the specified number of oldpasswords.Specifies the minimum length of each password.Specifies the maximum number of times the user canattempt to log in before being locked out of the <strong>LabChip</strong><strong>GX</strong> software. Range is from 3 to 20. This option can bedisabled to allow unlimited retries without locking theuser out.Specifies the number of minutes that the software isinactive until the <strong>LabChip</strong> <strong>GX</strong> software locksautomatically. Range is from 5 to 4320 minutes (3 days).To disable this option, clear the check box.If selected, an electronic signature is required to savemodified data files. Signatures can be performed by anyuser who has the Perform Signature option selected inthe Set Policies.P/N 127170 Rev. 00 <strong>LabChip</strong> <strong>GX</strong> <strong>User</strong> <strong>Manual</strong> Caliper Life Sciences, Inc.
<strong>LabChip</strong> <strong>GX</strong> Instrument Description 221Front View<strong>LabChip</strong> <strong>GX</strong> InstrumentDescriptionThis section identifies and describes the hardware components ofthe <strong>LabChip</strong> <strong>GX</strong> and <strong>GX</strong> II instruments. All of the componentsdescribed in this section are the same for the <strong>GX</strong> and <strong>GX</strong> IIinstruments. The <strong>LabChip</strong> <strong>GX</strong> runs DNA and RNA assays. The<strong>LabChip</strong> <strong>GX</strong> II runs DNA, RNA, Protein, and Glycan assays.This section includes the following topics:• Front View• Front Panel• Rear Connectors• Optics• Chip Pressure System• Barcode Reader• DNA, RNA, and Protein Chips• Chip Cartridge• Microplate Carrier• USB Key for 21 CFR Part 11 Option• SpecificationsFigure 103 shows the front view of the <strong>LabChip</strong> <strong>GX</strong> and identifiesthe parts on the front of the instrument.Figure 103. Front ViewFront Panel Buttons and indicator light. See “Front Panel” on page 222.Front Door Opens automatically to provide access to the microplate, chip, buffervial, and ladder vial.P/N 127170 Rev. 00 <strong>LabChip</strong> <strong>GX</strong> <strong>User</strong> <strong>Manual</strong> Caliper Life Sciences, Inc.
<strong>LabChip</strong> <strong>GX</strong> Instrument Description 222Front PanelThe controls on the front panel open the front door, eject the chipcartridge, and indicate the status of the instrument.Figure 104. Front PanelThe front panel contains the following parts:StatusLightChipbuttonEjectbuttonPowerButtonIndicates the state of the instrument:Dark (not lit) - Power is off.Solid green - Power is on and instrument is idle.Flashing green - Running a plate.Red - Power is on, cannot communicate with software.Flashing Red - Error detected.Moves the robot to open the door and releases the chip cartridge toaccess the chip. This button is illuminated when this function isavailable and flashes when movement is in progress.Moves the robot and opens the door to access the plate in themicroplate carrier. This button is illuminated when this function isavailable and flashes when movement is in progress.Turns the <strong>LabChip</strong> <strong>GX</strong> instrument On (Run) or Off (Standby). Note thatpower is still supplied to the power supply fans when the power switchis in the Standby position. Turning the instrument on reloads the systemfirmware and homes the robot.P/N 127170 Rev. 00 <strong>LabChip</strong> <strong>GX</strong> <strong>User</strong> <strong>Manual</strong> Caliper Life Sciences, Inc.
<strong>LabChip</strong> <strong>GX</strong> Instrument Description 223Rear ConnectorsThe rear connectors are used to connect the <strong>LabChip</strong> <strong>GX</strong>instrument to the computer and power supply.Figure 105. Rear ConnectorsThe following connectors are located on the back of the instrument:AC PowerCablePlug the power cord into this connector and a power outlet.WARNINGUSB CableAppliance inlet is disconnecting device. Place device or equipment ina manner so that disconnecting device is accessible at all times.Connects the <strong>LabChip</strong> <strong>GX</strong> instrument to the computer.P/N 127170 Rev. 00 <strong>LabChip</strong> <strong>GX</strong> <strong>User</strong> <strong>Manual</strong> Caliper Life Sciences, Inc.
<strong>LabChip</strong> <strong>GX</strong> Instrument Description 224OpticsThe <strong>LabChip</strong> <strong>GX</strong> optics provide fluorescence detection (redexcitation and red emission) for DNA, RNA, Protein and Glycanchips and assays. (Protein and Glycan assays are only supportedon <strong>LabChip</strong> <strong>GX</strong> II instruments.)Red LaserThe <strong>LabChip</strong> <strong>GX</strong> instrument includes a high intensity, long-life reddiode laser to excite fluorescence on microfluidic chips. It isexpected to have a lifetime of tens of thousands of operating hours.Focusing and AlignmentThe <strong>LabChip</strong> <strong>GX</strong> instruments use back-reflected red diode laserlight for automatic chip focusing.Photodiode DetectorsThe <strong>LabChip</strong> <strong>GX</strong> and <strong>LabChip</strong> <strong>GX</strong> II use two silicon photodiodedetectors for fluorescence detection and autofocus. Fluorescencedata can be acquired and stored at rates from 20 to 120 Hz.Optical TrainThe fluorescence excitation, fluorescence detection, and autofocusoptical trains contain several lenses and high efficiency interferencefilters. The optical trains are factory aligned and do not requireadjustment.Chip Pressure SystemBarcode ReaderThe pressure pump applies pressure or vacuum to the wells on thechip to move liquid through the chip. The Pressure Pump is locatedinside the <strong>LabChip</strong> <strong>GX</strong> instrument. O-Rings on the Chip Cartridgeseal the chip wells and maintain the pressure.The <strong>LabChip</strong> <strong>GX</strong> instrument is equipped with an internal BarcodeReader. The Barcode Reader reads the customer-applied barcodeon the short (portrait) edge of the microplate.Proper selection and placement of barcode labels is critical forsuccessful reading. See “Placing the Barcode on the Plate” onpage 34 for specifications.The barcode reader is internal to the system and cannot be viewedfrom the outside.P/N 127170 Rev. 00 <strong>LabChip</strong> <strong>GX</strong> <strong>User</strong> <strong>Manual</strong> Caliper Life Sciences, Inc.
<strong>LabChip</strong> <strong>GX</strong> Instrument Description 225DNA, RNA, and Protein ChipsThe figures below show the format and parts of the microfluidicchips used in the <strong>LabChip</strong> <strong>GX</strong> instruments to perform DNA, Protein,RNA, and Glycan sizing and quantitation. (Protein and Glycanassays are only supported on <strong>LabChip</strong> <strong>GX</strong> II instruments.)Figure 106. Top of ChipFigure 107. Bottom of ChipP/N 127170 Rev. 00 <strong>LabChip</strong> <strong>GX</strong> <strong>User</strong> <strong>Manual</strong> Caliper Life Sciences, Inc.
<strong>LabChip</strong> <strong>GX</strong> Instrument Description 226Chip CartridgeThe Chip Cartridge holds the chip, provides the voltage to the chipchannels to load, inject, and separate the sample, providespressure to prime the chip with separation gel, and providesvacuum to the chip wells to pull samples from the microplate intothe chip. The Chip Cartridge also contains a heating element tomaintain a constant temperature in the chip’s microfluidic channelsand provides an optically black beam dump to increase sensitivityand aid fluorescence detection.Figure 108. Chip CartridgeFigure 109. Chip Cartridge LidP/N 127170 Rev. 00 <strong>LabChip</strong> <strong>GX</strong> <strong>User</strong> <strong>Manual</strong> Caliper Life Sciences, Inc.
<strong>LabChip</strong> <strong>GX</strong> Instrument Description 227Chip Cartridge (Continued)Figure 110. Lid LatchLidBottom of CartridgeOptical WindowOptical BeamDumpPressure Plate withHeating ElementElectrodesO-RingsPressure PortLid LatchHolds the electrodes and o-rings to supply voltage andpressure to the chip.Holds the chip. The sipper on the chip extends through thesipper slot.Window for laser to illuminate chip.Provides an optically dark background under the chip.Maintains a constant temperature in the chip’s microfluidicchannels.Apply voltage to the chip to move fluid through the chip anddrive electrophoretic separations in the chip channels.Create a seal between the chip cartridge and the chip to applypressure or vacuum to the wells.Supplies pressure (positive or negative) to prime the chip ormove samples through the chip.Locks the chip cartridge closed.High Voltage InterfaceSupplies DC voltage to the separation channels in the chip via inertelectrodes that are immersed in specific wells on the chip. Thereare 6 voltage channels for the <strong>LabChip</strong> <strong>GX</strong> chips. HV channels canbe run in either constant voltage or constant current mode.P/N 127170 Rev. 00 <strong>LabChip</strong> <strong>GX</strong> <strong>User</strong> <strong>Manual</strong> Caliper Life Sciences, Inc.
<strong>LabChip</strong> <strong>GX</strong> Instrument Description 228Microplate CarrierThe <strong>LabChip</strong> <strong>GX</strong> instruments contain a stepper motor driven robotthat moves the microplate to be accessed by the <strong>LabChip</strong>.Figure 111. Microplate Carrier PartsMicroplateCarrierMicroplateLocator SpringBuffer VialLadder VialHolds the microplate.Positions the microplate correctly for access by the sipper on thechip.Contains buffer to be accessed by the sipper on the chip.Contains ladder standards to be accessed by the sipper on thechip.USB Key for 21 CFR Part 11 OptionIf the 21 CFR Part 11 option is installed, the USB Key must beplugged into a USB port on the <strong>LabChip</strong> <strong>GX</strong> computer. If the USBkey is not plugged in, the <strong>LabChip</strong> <strong>GX</strong> software displays an errormessage when starting and then shuts down.Figure 112. USB Key for 21 CFR Part 11 OptionP/N 127170 Rev. 00 <strong>LabChip</strong> <strong>GX</strong> <strong>User</strong> <strong>Manual</strong> Caliper Life Sciences, Inc.
<strong>LabChip</strong> <strong>GX</strong> Instrument Description 229SpecificationsGeneralThis section lists the technical specifications for the <strong>LabChip</strong> <strong>GX</strong>instruments. Technical specifications are subject to change withoutnotice.Size (H x W x D)WeightPlate CapacityVentilation/Cooling18.75 in. (48cm) x 19.25 in. (49cm) x 25.375in.(64cm)88 lbs. (40 kg)one 96-well or 384-well microplate3” (77 mm) minimum space required around instrument forproper air flow.EnvironmentalOperating Temperature 65° to 78°F (18° to 26°C)Operating Humidity 20% to 70% relative humidity, noncondensingStorage Temperature 50° to 104°F (10° to 40°C)Transient Overvoltages Installation Category II OvervoltagePollution Pollution Degree 2AltitudeUp to 2000mIndoor Use OnlyElectricalPower Input 3.0A max at 100-127Vac, 50-60Hz (±10%)1.5A max at 200-240Vac, 50-60Hz (±10%)Line Voltage100-127/200-240V~ nominal90-264V~ maximum operating rangeTotal Heat Emission 800WFusesNo customer-replaceable fuses in system. Contact CaliperTechnical Support (see page 2) if blown fuses aresuspectedGroundingThrough the power cordComputer Interface USB 2.0P/N 127170 Rev. 00 <strong>LabChip</strong> <strong>GX</strong> <strong>User</strong> <strong>Manual</strong> Caliper Life Sciences, Inc.
<strong>LabChip</strong> <strong>GX</strong> Instrument Description 230Assay VoltageMinimum Voltage/CurrentMaximum Voltage/Current-100V (limited by current)-3000V (limited by current)Chip PressurePressure Range+50 to -5 psigChip Temperature ControlTemperature Range Ambient + 5°C to 40°C (no active cooling)Accuracy± 0.5°CThermal limit switch 65°C - 70°CFluorescence DetectionDetection WavelengthData ratesBandpass 670-725 nm20, 30, 40, 50, 60, 80, 100, and 120 HzLight Source (Red laser diode)Warmup TimeWavelengthPower output30 seconds635 nm7.5 mWBarcode ReaderBarcode EngineSupported BarcodeTypesMicroscan MS3CCDCode 39, Code 93, Code 128P/N 127170 Rev. 00 <strong>LabChip</strong> <strong>GX</strong> <strong>User</strong> <strong>Manual</strong> Caliper Life Sciences, Inc.
Maintenance and Service 231Maintenance and ServiceCleaning the O-rings and chip interface prevents pressure leaksand current leaks. The O-rings should be cleaned daily, with a morethorough cleaning of the O-rings and chip interface monthly. SeeCleaning the Chip Cartridge.The <strong>LabChip</strong> <strong>GX</strong>/<strong>GX</strong>II Assay <strong>User</strong> Guides contain <strong>LabChip</strong> KitEssential Practices and instructions for preparing reagents andplates. Make sure to follow the instructions to ensure the optimumperformance of your instrument.The current version of the Assay <strong>User</strong> Guides can be accessed onthe Caliper web site at:http://www.caliperls.com/support/reference-library/datasheets/labchip_systems_data_sheets.htm.The cleaning and maintenance procedures are reviewed during thestandard customer training provided with the initial instrumentinstallation. If you have any questions concerning maintenance orrequire additional training, please contact Caliper Technical Support(see page 2).WARNINGLaser maintenance and service should be performed only by a qualifiedCaliper representative.P/N 127170 Rev. 00 <strong>LabChip</strong> <strong>GX</strong> <strong>User</strong> <strong>Manual</strong> Caliper Life Sciences, Inc.
Maintenance and Service 232Cleaning the Chip CartridgeDaily Cleaning1 Inspect the inside of the chip cartridge and O-rings for debris.2 Use the provided lint free swab dampened with DI water or 70%-isopropanol solution in DI water to clean the O-rings using acircular motion. If the O-rings stick to the chip or a pressure leakis detected, perform the more extensive monthly cleaningprocedure below.Monthly Cleaning1 To reduce pressure leaks at the chip interface, clean the O-ringsfrequently. Remove the O-rings from the top plate of the chipinterface on the <strong>LabChip</strong> <strong>GX</strong> instrument. Soak O-rings in DIwater for a few minutes. Clean the O-ring faces by rubbingbetween two fingers.2 To reduce the occurrence of current leaks, clean the chipinterface frequently. Clean the top plate of the chip interfaceusing the provided lint free swab dampened with DI water.3 Allow the O-rings and chip interface to air dry. Reinsert the O-rings into the chip cartridge.P/N 127170 Rev. 00 <strong>LabChip</strong> <strong>GX</strong> <strong>User</strong> <strong>Manual</strong> Caliper Life Sciences, Inc.
Troubleshooting and Diagnostics 233Troubleshooting and DiagnosticsThis section contains the following topics to help troubleshootproblems with the <strong>LabChip</strong> <strong>GX</strong> software:• “Searching for Events in the Events Tab” on page 233• “Viewing Current Events in the Events Tab” on page 234• “Error Messages” on page 235• “Diagnostics” on page 239• “Troubleshooting Assay Problems” on page 243• “Software Problems” on page 244— “Cannot Save a File” on page 244— “Computer Software Lock-Ups” on page 244Searching for Events in the Events TabEvents and errors that occurred during the screening of previousjobs are displayed in the Past Events tab in the Event ViewerWindow.To search for a specific event:1 On the Event Viewer window, click the Search Result tab.2 In the Events list, select Current, Past, or All.3 In the Search Text box, type a search query and click theSearch button. The Source, Event Code, and Description fieldsare searched. The search results appear in the Search Resultfields.The Search Result tab contains the following fields:Time - The time the event or error occurred.Source - The source of the event or error.Event Code - The event/error ID number used by Caliper totroubleshoot problems.Description - A detailed description of the event or error thatoccurred.P/N 127170 Rev. 00 <strong>LabChip</strong> <strong>GX</strong> <strong>User</strong> <strong>Manual</strong> Caliper Life Sciences, Inc.
Troubleshooting and Diagnostics 234Viewing Current Events in the Events TabWhile a job or batch is running, the events and errors that occurduring the screening display in the Current Events tab in the EventViewer Window.• On the Event Viewer window, click the Current Events tab. TheCurrent Events fields display. (These fields are read only.)The Current Events tab contains the following fields:Time - the time the event or error occurred.Source - The source of the event or error.Event Code - The event/error ID number used by Caliper totroubleshoot problems.Description - A detailed description of the event or error thatoccurred.Viewing Past Events in the Events TabAll events and errors that have occurred during the screening ofprevious jobs or batches display in fields on the Past Events tab inthe Event Viewer Window.• On the Event Viewer window, click the Past Events tab. ThePast Events fields display. (These fields are read only.)The Past Events tab contains the following fields:Time - The time the event or error occurred.Source - The source of the event or error.Event Code - The event/error ID number used by Caliper totroubleshoot problems.Description - A detailed description of the event or error thatoccurred.P/N 127170 Rev. 00 <strong>LabChip</strong> <strong>GX</strong> <strong>User</strong> <strong>Manual</strong> Caliper Life Sciences, Inc.
Troubleshooting and Diagnostics 235Error MessagesBefore a run is started and while an assay is running, theinstrument firmware and software checks for errors (e.g.,disconnected devices, bad parameters, bad data, etc.). If an error isdetected, an error or warning message displays in the Run Status.Depending on the error, the run may continue or be aborted. Theerror or warning message describes the problem and eithercontains information on how to resolve the problem or directs you tocall Caliper Technical Support (see page 2).For specific information about an error or warning message, clickone of the links below.General Errors• Device is Disconnected• Plate Carrier Motion Blocked• Home Timeout• Move Timeout• Pressure Leak Detected• Focus Failed<strong>LabChip</strong> <strong>GX</strong> Warnings• IV Check Failed• Current Leakage Check Failed• Chip Temperature WarningDevice is DisconnectedThis error message indicates that there is no communicationbetween the software and the specified device.Possible Causes1. Cable between computerand instrument unplugged.2. Instrument power loss.3. Computer went intohibernation.Recommended ActionsVerify that the USB communication cable is secure.Verify the power cord is plugged in.Press the Power button on the <strong>LabChip</strong> <strong>GX</strong> instrument.See page 222.Restart the <strong>LabChip</strong> <strong>GX</strong> software.If the problem is not resolved, contact CaliperTechnical Support (see page 2).P/N 127170 Rev. 00 <strong>LabChip</strong> <strong>GX</strong> <strong>User</strong> <strong>Manual</strong> Caliper Life Sciences, Inc.
Troubleshooting and Diagnostics 236Plate Carrier Motion BlockedError Message: “Plate carrier motion blocked. Make sure traymovement is not obstructed.”Possible Causes1. Something is blockingthe door from opening.2. Something may havefallen inside and is blockingthe robot motion.Recommended ActionsRemove the blockage.Restart the instrument.If the problem is not resolved, contact Caliper TechnicalSupport (see page 2).Home TimeoutError Message: “Home Timeout.”Possible Causes1. Something is obstructingthe robot motion.2. Robot Motor has failed.Recommended ActionsCheck for an object blocking the robot motion andremove the blockage.Restart the instrument.If the problem is not resolved, contact Caliper TechnicalSupport (see page 2).Move TimeoutError Message: “Robot Failure.”Possible Causes Recommended Actions1. Robot failure Check for an object blocking the robot motion andremove the blockage.Restart the instrument.If the problem is not resolved, contact Caliper TechnicalSupport (see page 2).P/N 127170 Rev. 00 <strong>LabChip</strong> <strong>GX</strong> <strong>User</strong> <strong>Manual</strong> Caliper Life Sciences, Inc.
Troubleshooting and Diagnostics 237Pressure Leak DetectedError Message: “Pressure leak detected. Check and clean the O-rings at the chip interface.”Possible Causes1. O-Ring missing ordirty.Recommended ActionsClean the O-rings (see page 232).Run the Pressure Diagnostic Tests (see page 239).If the problem is not resolved, contact Caliper TechnicalSupport (see page 2).Focus FailedError Messages:• “Focus failed due to less than 2 peaks found during horizontalscan.”• “Focus failed due to more than 3 peaks found during horizontalscan.”• “Focus failed due to dry focus marks not found.”• “Focus failed due to error in horizontal scan.”Possible Causes1. Focus nominal startingposition is incorrect.2. Laser or detector failure.3. Laser interlock switchfailure.4. Bad or jammed focusmotor.Recommended ActionsRun the Optics Diagnostics tests (see page 239).If the problem is not resolved, contact Caliper TechnicalSupport (see page 2).P/N 127170 Rev. 00 <strong>LabChip</strong> <strong>GX</strong> <strong>User</strong> <strong>Manual</strong> Caliper Life Sciences, Inc.
Troubleshooting and Diagnostics 238IV Check FailedPossible CausesWarning Message: “IV check failed.”Current Leakage Check FailedWarning Message: “Current leakage check failed.”Chip Temperature WarningRecommended Actions1. Dirty electrode block. 1. Run the Current Leak Diagnostics test (see2. Clogged chip.page 239). If test fails, clean o-rings and electrodeblock (see page 232).2. Re-priming can sometimes clear chip clogs. Ejectthe chip drawer, push the drawer back in, and restartthe run. See the <strong>LabChip</strong> <strong>GX</strong>/<strong>GX</strong>II Assay <strong>User</strong> Guidefor troubleshooting.3. If the problem is not resolved, contact CaliperTechnical Support (see page 2).Possible Causes Recommended ActionsDirty electrode block. Clean the O-rings (see page 232).Run the Current Leak Diagnostic Test (see page 239).If the problem is not resolved, contact Caliper TechnicalSupport (see page 2).Warning Message: “Average chip temperature is out of range.”Possible CausesChip heater failed.Recommended ActionsRestart the instrument. If problem persists, contactCaliper Technical Support (see page 2).P/N 127170 Rev. 00 <strong>LabChip</strong> <strong>GX</strong> <strong>User</strong> <strong>Manual</strong> Caliper Life Sciences, Inc.
Troubleshooting and Diagnostics 239DiagnosticsThe <strong>LabChip</strong> <strong>GX</strong> software contains a set of diagnostic tests to verifyproper operation of the <strong>LabChip</strong> <strong>GX</strong> or <strong>GX</strong> II instrument. Thesetests are not dependant on assay chemistry. All tests must pass toensure the instrument is functioning properly. To open the SystemDiagnostics Window, select Validation Diagnostics.The following procedures are included in this section:• Running the Diagnostics Tests• “Description of Diagnostic Tests” on page 240Running the Diagnostics TestsTo begin running the Diagnostics tests, click the Run Tests buttonon the System Diagnostics Window. The tests run from top tobottom, prompting you to load the correct chips or plates asrequired for each test. Follow the prompts. As each test iscompleted, the results display on the right side of the window.Supplies Required to Run Diagnostics Tests:• Test Chip A (Caliper P/N 760453)• Test Chip B (Caliper P/N 760489)• Test Plate with barcode labelTo order Test Chip A or B, contact Caliper Technical Support (seepage 2).P/N 127170 Rev. 00 <strong>LabChip</strong> <strong>GX</strong> <strong>User</strong> <strong>Manual</strong> Caliper Life Sciences, Inc.
Troubleshooting and Diagnostics 240Description of Diagnostic TestsThe table below lists the test names, descriptions, potential failures,and the chip required to run the test.Test NameComputeResourcesSystemComponentsChip InterfaceChiprequired Description Potential FailuresAnyCheck CFR databaseconnectionCheck CDR ServiceCheck Remote CDRConnection (Run onlyif Remote CDR is setup.)Memory CheckDisk Space CheckSQL server not started.Start SQL Server Express.Database has not beeninstalled properly. ContactCaliper Technical Support(see page 2).Service exited unexpectedlyor not started.Remote server is down.Network is down.Available memory below500 MB. System mayfunction with lower memorybut there is risk of failure ifanalyzing many plates.Available disk space below4 GB. Risk of losing data asdisk space is used. Freespace on local hard drive.Any Verify Fan operation Damaged fan. ContactCaliper Technical Support(see page 2).RemoveChipCheck chip cartridgeinterlockChecks Marker,Priming, and Sippingpressure lines forclogs.Chip Drawer is open. Closechip drawer.Interlock Switch isdefective. Contact CaliperTechnical Support (seepage 2).Clog in pressure line.Contact Caliper TechnicalSupport (see page 2).P/N 127170 Rev. 00 <strong>LabChip</strong> <strong>GX</strong> <strong>User</strong> <strong>Manual</strong> Caliper Life Sciences, Inc.
Troubleshooting and Diagnostics 241Test NameRF Tag TestChipA Reads tag on test chip. Bad tag on chip. Tryanother chip with knowngood RF Tag.Pressure Leak TestChipA Verifies Marker,Priming, and Sippingpressures reach setpoints within timelimits. Measures leakrate from set point.Optics TestChipA Tests Optics motionaxes (X, Y, and Z).ChipTemperatureChiprequired Description Potential FailuresTestChipAFocus/Laser/DetectorLaser On/OffSet temp to 30°C, thenraise to 35°C.Problem with RF Tagreader. Contact CaliperTechnical Support (seepage 2).Pressure leak at O-rings.Clean or replace the O-rings (see page 232) andclean the chip cartridge.Problem with pressurelines. Contact CaliperTechnical Support (seepage 2).Optics Motor failure.Contact Caliper TechnicalSupport (see page 2).Incorrect initial startingposition due to crash orcontact of optics block withan object. Laser or detectorfailed. Laser power too low.Contact Caliper TechnicalSupport (see page 2).Signal level differencebetween On and Off statestoo low may indicate laserburned out or detectorfailure. Contact CaliperTechnical Support (seepage 2).Initial chip temperature notachieved in time.Temperature ramp time notwithin spec may indicateheater disconnected orburned out. Contact CaliperTechnical Support (seepage 2).P/N 127170 Rev. 00 <strong>LabChip</strong> <strong>GX</strong> <strong>User</strong> <strong>Manual</strong> Caliper Life Sciences, Inc.
Troubleshooting and Diagnostics 242Test NameCurrentLeakageVoltageCalibrationCurrentCalibrationTestChipATestChipBTestChipBFor each pin, apply-3000V to pin and-100 to all others. Sumup currents.For each pin, apply-1000V while settingother nodes to 0.0 uA.Ensure each nodereaches appliedvoltage.For each pin, source10 uA into sink at-1000V. Ensure allcurrent goes to sink.Plate Sensor TestChipA Check the plate sensorcorrectly detectspresence and absenceof a plate.Punch Test TestChipA Check that plate robothas been trainedproperly.BarcodeChiprequired Description Potential FailuresAny Chip.(RequiresTest Plate)Read barcode on testplate.Source current too high orsum of sink currents toohigh. Clean or replace theO-rings (see page 232) andclean the chip cartridge.Voltage out of calibration.Pin not connected to powersupply.Current out of calibration.Pin not connected to powersupply. Contact CaliperTechnical Support (seepage 2).Faulty sensor. ContactCaliper Technical Support(see page 2).Misaligned punchesindicate poor robot training.Teach plate position.Contact Caliper TechnicalSupport (see page 2).Plate missing barcode.Place barcode on plate incorrect position (seepage 34).Barcode is not readcorrectly. Barcode readerdisconnected or misaligned.Contact Caliper TechnicalSupport (see page 2).P/N 127170 Rev. 00 <strong>LabChip</strong> <strong>GX</strong> <strong>User</strong> <strong>Manual</strong> Caliper Life Sciences, Inc.
Troubleshooting and Diagnostics 243Troubleshooting Assay ProblemsFor problems with assays, see the Assay <strong>User</strong> Guide for thespecific assay you are running. The Assay Guides contain commonproblems that may occur for each type of assay, and suggestedsolutions to resolve the problems.The current version of the Assay <strong>User</strong> Guides can be accessed onthe Caliper web site at:http://www.caliperls.com/support/reference-library/datasheets/labchip_systems_data_sheets.htm.If the problem is not resolved by following the suggestions in theAssay <strong>User</strong> Guide, Contact Caliper Technical Support (see page 2).P/N 127170 Rev. 00 <strong>LabChip</strong> <strong>GX</strong> <strong>User</strong> <strong>Manual</strong> Caliper Life Sciences, Inc.
Troubleshooting and Diagnostics 244Software ProblemsCannot Save a FileIf any of the following software problems occur, follow thesuggestions to correct the problem:• Cannot Save a File• Computer Software Lock-UpsFile has been saved as a Read Only file.If you editing an existing file, verify the file is not Read Only. If it is,the title bar shows Read Only after the file name. Read-only filescan be edited and saved with a new name or in a new location withthe same name, but cannot be saved over the original file.Hard drive is full.Verify there is sufficient free space on the drive to save the file. Ifnot, clear some space on the hard drive. On non-21 CFR Part 11systems, you can archive files that you are not using to anotherlocation.If you do have sufficient space, try closing all open applications andthen turning off the power to the computer. After a few seconds,restart the computer, open another file, and try resaving it to verifythe Save function is working properly.<strong>LabChip</strong> <strong>GX</strong> software is corrupted.Reinstall the software. If the problem persists, contact CaliperTechnical Support (see page 2).Computer Software Lock-UpsIf a computer or software lock-up occurs:1 Try to exit and then re-launch the <strong>LabChip</strong> <strong>GX</strong> software.2 If this is not successful, exit the application using the TaskManager:abcRight-click in the desktop menu bar and select TaskManager.Click on the Applications tab.While holding down the Shift key, select all runningapplications.P/N 127170 Rev. 00 <strong>LabChip</strong> <strong>GX</strong> <strong>User</strong> <strong>Manual</strong> Caliper Life Sciences, Inc.
Troubleshooting and Diagnostics 245Computer Software Lock-Ups (Continued)dHold the Ctrl key and click End Task.3 If the Task Manager cannot be accessed, try one or all of thefollowing:• Press the Ctrl, Alt, and Delete keys on the keyboardsimultaneously.• Perform a hard reboot by turning off the computer and thenrestarting it.• Power cycle the <strong>LabChip</strong> <strong>GX</strong> instrument.4 Contact Caliper Technical Support (see page 2).P/N 127170 Rev. 00 <strong>LabChip</strong> <strong>GX</strong> <strong>User</strong> <strong>Manual</strong> Caliper Life Sciences, Inc.
Tips and Shortcuts 246Tips and ShortcutsThis section describes the shortcuts and actions that can beperformed in the <strong>LabChip</strong> <strong>GX</strong> software by clicking, right-clicking,etc.Single Click• In Plate View - Selects or de-selects a well.• In Gel View - Selects a well and displays the graph in the Graphview.• In Well Table View - Selects a well, displays the graph in theGraph view, and selects the well in the Gel view.• In Peak Table View - Selects a peak, displays the graph in theGraph view, and selects the well in the Gel view.Ctrl + Click• In Gel View - Overlays second and subsequent well data overoriginal well data in the Graph view (for each Ctrl + click on alane in the gel). Each well in the graph is shown in a differentcolor.• In Well Table view - Overlays second and subsequent well dataover original well data in the Graph view (for each Ctrl + click ona row in the Well Table). Each well in the graph is shown in adifferent color.Ctrl + Shift + Click• In Gel View - Highlights corresponding well data trace inOverlay Electropherogram view (adds trace to overlay if notalready included). This trace becomes the foreground trace forpeak selection. Repeat click to undo highlighting.Right-Click• Right-click in any view to display a shortcut menu with availableoptions. In the Graph View, different shortcut menus displaydepending on whether the cursor is near a peak or not near apeak.P/N 127170 Rev. 00 <strong>LabChip</strong> <strong>GX</strong> <strong>User</strong> <strong>Manual</strong> Caliper Life Sciences, Inc.
Glossary of Terms 247Glossary of TermsApexAssay FileAfter locating a start point, the peak find algorithm looks for the firstnegative slope value and saves the previous point as the apex. Ifthe value of the apex is less than the minimum peak height limit, thealgorithm starts looking for a new peak.File created by the <strong>LabChip</strong> <strong>GX</strong> software to specify assay andanalysis settings, such as Ladder and marker sizes andconcentrations, peak find settings, expected peaks, and excludedpeaks.P/N 127170 Rev. 00 <strong>LabChip</strong> <strong>GX</strong> <strong>User</strong> <strong>Manual</strong> Caliper Life Sciences, Inc.
Glossary of Terms 248BaselineA baseline is established just after the start time setting. (For DNAand RNA assays, you can change the Baseline Start time on theAnalysis Tab.) After the overall baseline is established, a localbaseline is calculated for each peak to compensate for baselinedrift.For isolated peaks, the local peak baseline is a straight lineconnecting the start point of the peak with the end point. For peaksthat are very close together, an average baseline is used when thevalue between the peaks does not drop to the actual baseline.To select the desired baseline algorithm for all of the samples in theplate, choose the desired option on the Peak Find Tab: No baseline,Zero Baseline, or Baseline subtraction.Figure 113 shows baselines established for DNA assay peaks(based on the settings in the Peak Find Tab). DNA peaks aredetermined on a peak-by-peak basis (the overall baseline isshown).Figure 113. BaselinesBubbleIf the tip of a pipette is not positioned below the liquid level in thewell, bubbles can result. If a large bubble forms at the bottom of awell, remove the sample from the well, pipette the sample back intothe well, and continue with the loading procedure.P/N 127170 Rev. 00 <strong>LabChip</strong> <strong>GX</strong> <strong>User</strong> <strong>Manual</strong> Caliper Life Sciences, Inc.
Glossary of Terms 249CLAThe file extension for data files created by the <strong>LabChip</strong> HTsoftware. CLA files can be opened in the <strong>LabChip</strong> <strong>GX</strong> software.Opening a .CLA file (see page 51) creates a .<strong>GX</strong>D file with thesame name.ClipboardCollectionA temporary storage area that contains information you have cut orcopied. You can paste the contents of the clipboard into otherprograms (provided that program supports that type of information).Information remains on the clipboard until you replace it with theinformation from another cut or copy command.Use a collection to view the plate data. A workspace can containmultiple collections to supply different views of the same data.Each collection specifies:• the wells selected for view in each plate data file,• the layout of each Collection tab, and• the display properties for each view in each collection.Collection TemplateA collection template saves the display options for a collection andany defined filters in the collection. Collection templates are used tocreate new collections using the saved display settings and filters.Collection templates do not save the list of plates or the wellsselected in the plates.To save a collection template based on the settings in the opencollection, select Collection Save Template on the main MenuBar.To apply a collection template to a new collection, select theTemplate option in the New Collection Window.To apply a collection template to an existing collection, select thetab for the desired collection and then select Collection ApplyTemplate on the main Menu Bar.P/N 127170 Rev. 00 <strong>LabChip</strong> <strong>GX</strong> <strong>User</strong> <strong>Manual</strong> Caliper Life Sciences, Inc.
Glossary of Terms 250Data FilesData PointsWhile running an assay, the raw data received from the instrumentis automatically saved to the plate data file (*.gxd). As the data fromeach single well is received, it is saved to the data file. The name ofthe data file is specified in the Start Run Window. If a run is stoppedbefore the run is complete, the data file contains the data for thecompleted wells.After a run is complete, the data is analyzed using the analysissettings in the assay. The analysis settings are saved in the data file(.gxd).After the run, you can change the analysis settings using the AssayAnalysis Window. When the new settings are applied, the data isreanalyzed and the updated results are displayed. Changes to theanalysis settings are not saved until the workspace is saved. Tosave analysis settings without saving the workspace, selectWorkspace Save Plate or right-click on the plate name abovethe plate diagram on the left side of the window and choose SavePlate.Changes to the analysis settings are saved at the end of the platedata file without overwriting previous settings in the file. TheRestore Plate option can be used to return to previous analysissettings.Data points are determined by the data collection rate set in theassay properties.Show Data Points is an option in the Graph View Properties thatdisplays the data points used to generate the graph.P/N 127170 Rev. 00 <strong>LabChip</strong> <strong>GX</strong> <strong>User</strong> <strong>Manual</strong> Caliper Life Sciences, Inc.
Glossary of Terms 251Data FilteringBefore identification of peaks in the fluorescence data can proceed,the raw data must be smoothed to prevent the detection of signalnoise as peaks.To smooth the data, the <strong>LabChip</strong> <strong>GX</strong> software:1 Eliminates any narrow spikes from the data and replaces thespike with a local average of surrounding points.2 Applies baseline correction (if selected in the Assay Analysiswindow) to the data.• For the “Zero Baseline” option, a single value of baselineshift is determined by averaging over a 1 second region justbefore the Data Range Baseline time. This shift is subtractedfrom all of the data.• The “Baseline Subtraction” option uses a spline fit to thedata to determine a smooth baseline that is subtracted fromthe data. The percentage of data points used in the spline fitis specified by the Threshold value in the Assay Analysiswindow. The collection of points with the lowest variance upto this percentage is used for the spline fit.3 Smooths the data using a Savitzky-Golay filter using the FilterWidth and Polynomial Order specified in the Peak Find Tab ofthe Assay Analysis Window.DNA Assay AnalysisDNA samples contain two marker peaks outside the limits of theDNA fragment sizes the assay is designed to detect. The ladderscontain the same two marker peaks. The sample data is aligned tothe ladder data by matching the peak times of the two markers inthe sample data with the same two markers in the ladder data. Thesize of each sample peak is calculated by linear interpolationbetween the known ladder peak migration time and size using thepeak aligned migration time. The analysis settings can be changedto perform the interpolation using a local third order polynomial fit tothe time instead of the size relationship provided by the ladder.The concentration of the sample peaks is calculated using theknown area and concentration of the ladder peaks. The molarity ofeach sample peak is calculated using the sample concentration, theDNA fragment size (in base pairs) attributed to the peak, and theknown molecular weight of the DNA base pair.P/N 127170 Rev. 00 <strong>LabChip</strong> <strong>GX</strong> <strong>User</strong> <strong>Manual</strong> Caliper Life Sciences, Inc.
Glossary of Terms 252Electrode CleanerThe electrode cleaner looks like a chip except that it is clear. Usethe electrode cleaner in place of a chip when cleaning electrodes.Electrokinetic ForcesElectrokinetic forces are used to move, switch, mix, and separatethe nucleic acid samples. Active control over voltage gradientsdirects the movement of materials using the phenomenon ofelectroosmotic flow or electromigration.Electroosmotic FlowElectrophoresisEnd PointEnd TimeFilter WidthA phenomenon that results from an electrical double layer formedby ions in the fluid and surface electrical charges immobilized onthe capillary walls. When an electric field is applied, the bulksolution moves towards one of the electrodes. This phenomenoncan be used to move fluids through microfabricated channelsA technique of separating molecules on the basis of their mobility.An electrical potential is applied across a capillary containing asample in a fluid medium. Positive molecules migrate towards thecathode and negative molecules migrate towards the anode atdifferent speeds depending on their electrophoretic mobility.The peak find algorithm looks for a leveling off when the value ofthe slope is less than the value set for the slope threshold. This ismarked as the end point of the peak.This setting determines the time after the start of a run before whichthe last peak or fragment will be located (any peaks appearing afterthis time are ignored).This setting on the Peak Find Tab determines the width of thepolynomial (in seconds) to be applied to the data for filtering (noisereduction). The default depends on the assay selected.P/N 127170 Rev. 00 <strong>LabChip</strong> <strong>GX</strong> <strong>User</strong> <strong>Manual</strong> Caliper Life Sciences, Inc.
Glossary of Terms 253<strong>GX</strong>D FilesThe file extension for data files created in the <strong>LabChip</strong> <strong>GX</strong> software.The data file contains the data from the read, assay information,analysis settings, and Run Information for the run.Data is saved to the file as each well is read. If a run is stoppedbefore the run is complete, the data for any completed wells issaved in the data file.The file name is specified in the Start Run Window.Hardware DiagnosticsWhenever a run begins, the instrument checks for errors (e.g.,defective high-voltage supplies, missing conductivity between wells,etc.). If an error is detected, a message box displays and the runstops. The message box describes the problem and either containsinformation on how to resolve the problem or directs you to callCaliper Technical Support (see page 2).P/N 127170 Rev. 00 <strong>LabChip</strong> <strong>GX</strong> <strong>User</strong> <strong>Manual</strong> Caliper Life Sciences, Inc.
Glossary of Terms 254Inflection Threshold ExamplePeaks that are very close together will be identified as a single peakif the peaks do not have a clear valley between them. The Inflectionthreshold property allows splitting of peaks evidenced by a region oflower slope. The figures below illustrate the operation of theInflection threshold.The green line in the figures below shows the signal slope. Theshoulder peaks have a slope minuma (inflection point) but the slopedoesn't change sign so they are not split into multiple peaks via theslope threshold.Figure 114. Slope Threshold 0The inflection threshold defines the value that the slope minimummust be below to trigger a splitting of the peak. As the threshold isincreased, more peak splitting occurs. The figures below show thesame data with the slope threshold set to 80 and 200.P/N 127170 Rev. 00 <strong>LabChip</strong> <strong>GX</strong> <strong>User</strong> <strong>Manual</strong> Caliper Life Sciences, Inc.
Glossary of Terms 255Figure 115. Slope Threshold 80Figure 116. Slope Threshold 200P/N 127170 Rev. 00 <strong>LabChip</strong> <strong>GX</strong> <strong>User</strong> <strong>Manual</strong> Caliper Life Sciences, Inc.
Glossary of Terms 256Lab-on-a-ChipLadderThe generic term for a microfluidic product, signifying a chemicalprocess or material movement taking place on a microchip. Incontrast to analysis in a standard laboratory that relies on humanintervention at several stages to manipulate or observe samplesand record results, the self-contained lab-on-a-chip represents analmost hands-free technology.A ladder well is located at the bottom right of the chip (after theladder has been loaded, this well also functions as a waste well).The ladder is analyzed first before sample analysis starts.The peak sizes and markers defined for the ladder in the assay areassigned consecutively, starting with the first peak detected in theladder. If too few peaks are detected in the ladder well, analysisstops and an error is generated. Peaks appearing above the uppermarker do not have to be detected. The Peak Table View for theladder well shows the peak size and concentration set in the AssayAnalysis Window.Figure 117. Ladder GraphP/N 127170 Rev. 00 <strong>LabChip</strong> <strong>GX</strong> <strong>User</strong> <strong>Manual</strong> Caliper Life Sciences, Inc.
Glossary of Terms 257Ladder AnalysisLower MarkerLog FilesMicrofluidicsA ladder is a mix of compounds of known sizes that is used tocreate a size ruler for the samples. Ladder data is used to convertthe migration time of each sample peak into a size for thecompound responsible for that peak. The known sizes of the laddercompounds are supplied in the assay file and can be viewed in theAnalysis Tab on the Assay Analysis Window.The initial step in ladder analysis is to identify the most prominentpeaks in the ladder well and associate each peak with the knownladder sizes. The analyzed ladders provide a table of valuesrelating size to migration time. Typically the migration time uses thecenter of the peak in the ladder and the sample.Failure to find the correct number of ladder peaks prevents furtheranalysis of the sample wells using the faulty ladder. The analysisautomatically attempts to use another successfully analyzed nearbyladder on the plate before generating an analysis error. Theanalysis settings can specify which ladder is used to size anyparticular sample row. If more accurate sizing can be obtained bymeasuring migration times at the start of each peak, this option canbe selected in the Assay Analysis Window.An internal standard that is added to a sample in a well to assist indetermining size and concentration of the sample. For DNA assays,the marker is the same as the first peak in the DNA ladder. DNAladders and samples also contain an Upper Marker. For Protein andRNA assays, the marker is the same as the first peak in the ladder.The <strong>LabChip</strong> <strong>GX</strong> software log file displays in the Event ViewerWindow. The log file maintains a running record of all events thatoccur with the instrument while it is online with the software andrecords all events that occur in the software. Each event specifiesthe date and time of the event, source of the event, the event code,and a description of the event.The miniaturization of chemical processes generally pertaining tosystems involved in the control of fluid flow. This includes pumps,valves, jets, and microchannels.P/N 127170 Rev. 00 <strong>LabChip</strong> <strong>GX</strong> <strong>User</strong> <strong>Manual</strong> Caliper Life Sciences, Inc.
Glossary of Terms 258Minimum Peak HeightThe Minimum Peak Height value determines the height limit belowwhich a peak will not be detected. For each peak, the differencebetween the peak start time and the peak apex must be greaterthan the Minimum Peak Height value.The Minimum Peak Height is specified on the Peak Find Tab of theAssay Analysis Window.Minimum Peak WidthMolarityThe Min Peak Width value determines the width (in seconds) underwhich a peak will not be detected. For each peak, the differencebetween the peak start time and the peak end time must be greaterthan the Minimum Peak Width value.The Minimum Peak Width is specified on the Peak Find Tab of theAssay Analysis Window.Molarity = (Concentration * 10 6 )/(660 * Size)[nmol/l]where molarity is measured in nanomoles per liter (nmol/l)Concentration is measured in nanograms per microliter (ng/µL)Size is measured in base pairs (bp)660 * [g/(mol * bp)] is the molecular weight of a single base pairMolecular Separation TechniquesProcesses such as gel electrophoresis, liquid chromatography, andcapillary electrophoresis, which can separate biomolecular organicsubstances from other compounds.P/N 127170 Rev. 00 <strong>LabChip</strong> <strong>GX</strong> <strong>User</strong> <strong>Manual</strong> Caliper Life Sciences, Inc.
Glossary of Terms 259Peak BaselineA local peak baseline is calculated for each peak. For isolatedpeaks, the local peak baseline is a straight line connecting the startpoint with the end point. For peaks that are very close together, anaverage baseline is used when the value between the peaks doesnot drop to the actual baseline. The peak baseline for each peak inFigure 118 is shown in a different color.Peak HeightFigure 118. Peak BaselinesThe baseline algorithm starts at the earliest peak and checkswhether the end point is within a certain distance from the start ofthe next peak. When a cluster of peaks is detected, the baseline isthe line joining the first peak's start to the last peak's end. The startand end points of adjacent peaks in the cluster are averaged to thesame point so that no gaps exist between peaks.The peak baseline Start Point and End Point can be moved in theOverlay Electropherograms Tab if Show Peak Baselines isselected in the Graph View Properties.The value at the apex of the peak minus the local baseline startvalue.P/N 127170 Rev. 00 <strong>LabChip</strong> <strong>GX</strong> <strong>User</strong> <strong>Manual</strong> Caliper Life Sciences, Inc.
Glossary of Terms 260Peak IdentificationPoint-to-Point FitPolynomial FilterFrom the smoothed data, peaks are identified using a hill-climbingalgorithm running along the smoothed data and its first derivative.The slope threshold determines peak start point and end point:• The first point with local derivative above the slope thresholdindicates the start point peak.• The first point where the negative slope on the falling edge ofthe peak drops below the slope threshold indicates the end pointof a peak.The peak baseline is stitched across the peak bottom by takinglocal averages just outside the peak start and end points. The peakheight, measured from the apex down to the peak baseline, mustexceed the minimum peak height specified in the Assay AnalysisWindow to have a bump tagged as a peak.The peak start, end, and baseline can be viewed in the Graph Viewby selecting the Show Peak Baselines option in the Graph ViewProperties. The area of each peak is determined by trapezoidalintegration of the peak signal between peak boundaries and abovethe peak baseline.This curve fit is composed of line segments between each pair ofdata points that are used to interpolate data between the points.The first step the software takes in analyzing the raw data is toapply Data Filtering. Data filtering is performed by means of apolynomial “filter” that is applied to the raw data. The figure belowapproximates the shape of the filter and shows what peaks mayresemble if the filter application is too strong.P/N 127170 Rev. 00 <strong>LabChip</strong> <strong>GX</strong> <strong>User</strong> <strong>Manual</strong> Caliper Life Sciences, Inc.
Glossary of Terms 261Polynomial OrderThis setting on the Peak Find Tab determines the order of thepolynomial filter used to convolve with the data. A polynomial filteris used to filter the data to increase the signal-to-noise ratio andcalculate filter slope information for peak detection. The defaultsetting is 6 (for 6th order). A setting of 4 produces a straighterbaseline, preventing quick changes in the signal.Pressurization SyringeA plastic syringe, which is attached to the chip priming station. Thissyringe can be used to force the buffer solution into all the channelsin the chip prior to running the chip in the instrument.Protein Assay AnalysisProtein assays utilize a chemistry that generates an extra set ofpeaks (system peaks) just above the lower marker that should notbe included in the analysis. These system peaks must be identifiedand excluded from further quantitative analysis. For ladder analysis,peaks occurring after the lower marker less than the “Ladder Ratio”analysis setting, are tagged system peaks to avoid confusion withlegitimate ladder peaks.Protein samples contain a single lower marker. Alignment to asingle marker does not provide enough constraints to align largeproteins, so data is aligned to two ladders, one sipped just beforethe sample wells and another sipped just after the sample wells.The second ladder is called the bracket ladder. Samples are scaledso the sample’s lower marker is nearly aligned with both ladderlower markers. The scaling is weighted by the proximity in sip timeto each ladder. The sample sipped closest to the primary ladder isscaled to align more closely to the primary ladder and the samplesipped just before the bracket ladder is scaled to align most closelyto the bracket ladder. Then each sample is shifted in time so thesample's lower marker aligns exactly with the primary ladder lowermarker.After alignment, the size of the protein producing each peak iscalculated from the aligned peak time using a log (size) versus1/(Time-T0) fit to the primarily ladder peaks of known size andmeasured migration time. T0 is determined empirically as the timeoffset which delivers the best straight line fit to the ladder data, Thevalue of T0 used for the fit can be viewed in the Well Table View.P/N 127170 Rev. 00 <strong>LabChip</strong> <strong>GX</strong> <strong>User</strong> <strong>Manual</strong> Caliper Life Sciences, Inc.
Glossary of Terms 262This fit to the ladder peak data can be viewed by selecting StandardCurve from the Analysis menu. After sample peaks have beensized, the system peaks are identified and excluded based on theirsize. Any peak of size greater than the lower marker but less thanthe Min. Sample Size specified in the Assay Analysis Window islabeled a system peak and excluded from concentration and purityanalysis.To determine sample peak concentration, the peak areas are firstcorrected to compensate for the fact that the fluorescenceintensities are sampled at a constant time interval so slower movingproteins spend more time under the detector than fast movingproteins. The peak concentration is then calculated using the ladderpeak areas and concentration for the ladder supplied in the AssayAnalysis Window. The concentration is adjusted for the differingdilution ratios of sample and ladder.To quantitize the sample peak concentration based on a differentstandard, the new standard must be added into each sample well ata known concentration. The analysis settings provide a SamplePeak Quantitation option using the peak area and concentration ofthe <strong>User</strong> Standard instead of the ladder concentrations.RNA Assay AnalysisRNA analysis initially progresses similarly to DNA analysis exceptthat the baseline for RNA peaks is calculated using a spline-fit,much like the baseline used for the Baseline Subtraction option.However, this computed fit is not subtracted from the data; instead itis used to determine the peak height and to limit the peak extends.The RNA ladder is similar to the DNA ladder but does not containan upper marker. RNA sample data is aligned with the lower makerand then the sample peaks are sized using point-to-pointinterpolation between ladder peaks. The most prominent peaksfound within predefined size windows are identified as ribosomalrRNA genes 5S, 18S and 28S (for eukaryote RNA), 16S and 23S(for prokaryote RNA).P/N 127170 Rev. 00 <strong>LabChip</strong> <strong>GX</strong> <strong>User</strong> <strong>Manual</strong> Caliper Life Sciences, Inc.
Glossary of Terms 263For the purpose of quantitizing the full RNA content in the sample, astraight-line baseline is drawn across the bottom of the sample byfinding the local averages about its endpoint. The area baselineendpoints can be moved on the Graph View after the “Show PeakBaselines” option is selected in the Graph View Properties.Trapezoidal integration from the straight-line baseline to the datasignal is used to calculate the total RNA area. Integration isperformed from the end of the lower marker to the endpoint of thearea baseline. The range from the end of the 5S to the start of the18S peak is termed the Fast Area. This area is calculated in thesame way as the total RNA area.For the purpose of quantitizing the rRNA peaks, a two-pointbaseline is drawn across the bottom of each peak identified asrRNA and the area is computed. These areas and rRNA peakheights and some relevant ratios are made available for display inthe Well Table View. A combination of the quantities is used toassess the quality of the RNA sample.RNA Degrade FactorThis value quantifies the degradation of the ribosomal peaks, whichtypically leads to an increase in the fast area region between the 5Sand the 16S (prokaryote) or 18S (eukaryote) ribosomal peaks. Thequantity is computed as follows:For prokaryote:200 * Fast Area / (Fast Area Time Span) / (Height of 16S +Height of 23S)For eukaryote:200 * Fast Area / (Fast Area Time Span) / (Height of 18S +Height of 28S)As the sample RNA degradation increases, this factor will increase.A value below 10 is obtained with high quality RNA but the usershould determine their own threshold for discriminating betweengood and bad RNA. This quantity can be viewed and reported in theWell Table View.P/N 127170 Rev. 00 <strong>LabChip</strong> <strong>GX</strong> <strong>User</strong> <strong>Manual</strong> Caliper Life Sciences, Inc.
Glossary of Terms 264Run ButtonTo begin running an assay, click the Run button located at the topleft of the <strong>LabChip</strong> <strong>GX</strong> Main Window:The Start Run Window opens to select the assay, wells, data filename, etc.After the run has begun, this button changes to Stop. See “Stoppinga Run” on page 28.NOTESlope ThresholdThe Run button does not display if the software was installed inReviewer mode.The Slope Threshold setting represents the amount of change inresponse over time required to differentiate between an elutingpeak and baseline noise. Changing this setting may cause certainpeaks that were previously detected to be ignored or to interpretnoise as peaks.The Slope Threshold setting is one of the user-definableparameters in the Peak Find Tab.P/N 127170 Rev. 00 <strong>LabChip</strong> <strong>GX</strong> <strong>User</strong> <strong>Manual</strong> Caliper Life Sciences, Inc.
Glossary of Terms 265SmearSpecifies a size range in which to detect the region of thefluorescence signal instead of specifying a specific size for a peak.Use a smear to detect a broad mix of molecules of similar butdistinct sizes in a sample. The concentration or fractional presencewithin a specified range of molecule sizes is measured. Specify theStart Size and End Size of a smear in the Assay Analysis Windowon the Smear Analysis Tab.The Smear Properties can be viewed in table form in the Well TableView. To view the Smear Properties in the table, add the desiredproperty to the Well Table View. The properties extracted from thesmear match those of a peak, having extends, area, concentration,etc. % Purity is the ratio of smear concentration to total samplepeak concentration, exclusive of markers, system peaks, andexcluded peaks. Excluded peaks are not excluded from analysiscalculations such as concentration or area within the smear region,so the limits must avoid excluded peaks. An additional Peak Countproperty is available for smears. Peak Count is the number of nonexcludedsample peaks in the region, where the center of the peakis inside the smear limits.In the Graph View, the smear regions display with the integrationextends drawn at the base of the smear in the chosen color and thetrace highlighted with the smear color. Override the smear base bydragging with the mouse in the Graph view. Only the verticalposition of the base corners can be adjusted in the graph, since thesize limits are specified and should not be altered.In the Gel View, the smear region is shown on the gel as a colorizedregion. The color is a transparent version of the color selected forthe region, so the fluorescence intensity still shows through.P/N 127170 Rev. 00 <strong>LabChip</strong> <strong>GX</strong> <strong>User</strong> <strong>Manual</strong> Caliper Life Sciences, Inc.
Glossary of Terms 266Standard Curve WindowThe Standard curve window shows the Standard curve used for theselected plate data.DNA AssaysWhen you choose Standard Curve from the View menu for a DNAassay, a window similar to Figure 119 opens. The standard curve isdrawn from the values obtained for the DNA ladder. It is a plot of thesize of the ladder peaks vs. time with a point-to-point fit. For eachsample peak, the apex is interpolated from the Standard Curve todetermine the peak size in base pairs (BP).Figure 119. DNA Assay Standard CurveFor more information about the use of the standard curve duringanalysis, see “How the Software Analyzes DNA Data” on page 36.Protein AssaysWhen you choose Standard Curve from the View menu for aprotein assay, a window similar to Figure 120 opens. The standardcurve is drawn from the values obtained for the protein ladder. It is aplot of the size of the ladder peaks vs. time with a Log fit. For eachsample peak, the apex is interpolated from the Standard Curve todetermine the peak size in kDa.P/N 127170 Rev. 00 <strong>LabChip</strong> <strong>GX</strong> <strong>User</strong> <strong>Manual</strong> Caliper Life Sciences, Inc.
Glossary of Terms 267Figure 120. Protein Assay Standard CurveFor more information about the use of the standard curve duringanalysis, see “How the Software Analyzes Protein Data” onpage 38.RNA AssaysWhen you choose Standard Curve from the View menu for an RNAassay, a window similar to Figure 121 opens. The standard curve isdrawn from the values obtained for the RNA ladder. It is a plot of thesize of the ladder peaks vs. time with a point-to-point fit. For eachsample peak, the apex is interpolated from the Standard Curve todetermine the peak size in nt.Figure 121. RNA Assay Standard CurveFor more information about the use of the standard curve duringanalysis, see “How the Software Analyzes RNA Data” on page 42.P/N 127170 Rev. 00 <strong>LabChip</strong> <strong>GX</strong> <strong>User</strong> <strong>Manual</strong> Caliper Life Sciences, Inc.
Glossary of Terms 268Start PointStart TimeTiterTool TipUpper MarkerThe peak find algorithm analyzes the data from time zero lookingfor a slope greater than the Slope Threshold. The point where theslope is greater than the slope threshold specified in the Peak FindTab is marked as the start point of a peak.This setting determines the time after the start of a run when peakswill be detected. Any peaks appearing before this time are ignored.Allows the use of a standard with a known concentration to be usedas a calibration standard instead of using a ladder. The well locationand known concentrations of the standard are specified in theAssay Analysis Window on the Titer Tab.The Titer Standard Curve used for calibration is normalized againstthe lower marker (protein and RNA) or upper marker (DNA) toadjust for slight variations in each well. A normalization standardcan be added to each well to be used only for normalization.(Normalization standards must be the same concentration in eachwell.) You choose the normalization Standard in the Assay AnalysisWindow on the Advanced Tab. Titers can also be imported fromanother plate if the selected Normalization Standard is the same. IfSample Peak is selected, the Sample Peaks must be the samesize.The Concentration to Favor in Fit adjustment on the Titer tabenables you to choose whether to weight either the higher or lowerconcentrations more heavily when calculating the Titer StandardCurve.A small box containing text that describes the item indicated by themouse pointer. To view a Tool Tip, position the cursor over an itemon the window. Leave the cursor stationary for a moment and aTool Tip (if one exists for that item) displays.An internal standard that is added to a DNA sample in a well toassist in determining size and concentration of the sample. Themarker is the same as the last peak in the DNA ladder.P/N 127170 Rev. 00 <strong>LabChip</strong> <strong>GX</strong> <strong>User</strong> <strong>Manual</strong> Caliper Life Sciences, Inc.
Glossary of Terms 269WorkspaceZero BaselineUse a workspace file to view the plate data from a run. Multipleplate data files can be opened in the same workspace to enablecomparison between data from different plates or different runs.Each workspace can contain multiple Collections for viewing thesame data in different layouts.A Workspace file includes:• the links to the plate data files in each collection,• the selected wells and arrangement of the wells in the views,and• the layout selected for each collection.Selecting this setting in the Peak Find Tab offsets the graphs shownfor the individual wells but does not affect analysis. The mean of100 points before the baseline time (derived when calculating wellnoise) is used as the zero baseline value.All electropherograms produced with the instrument show someamount of background fluorescence. By default, the <strong>LabChip</strong> <strong>GX</strong>software enables the Zero Baseline function. To change theBaseline Algorithm, select None, Zero Baseline, or BaselineSubtraction on the Peak Find Tab.Figure 122. Zero Baseline OnP/N 127170 Rev. 00 <strong>LabChip</strong> <strong>GX</strong> <strong>User</strong> <strong>Manual</strong> Caliper Life Sciences, Inc.
Glossary of Terms 270Figure 123. Zero Baseline OffP/N 127170 Rev. 00 <strong>LabChip</strong> <strong>GX</strong> <strong>User</strong> <strong>Manual</strong> Caliper Life Sciences, Inc.
Caliper Life Sciences, Inc. Product Warranty 271I. INSTRUMENTSCaliper Life Sciences, Inc. Product WarrantyCaliper Life Sciences, Inc. (“Caliper”) warrants your Caliper-manufactured instrument’s hardware and firmware against defects in materialand workmanship for a period of one (1) year from the date of installation, but not later than 14 months from shipment, subject to theexclusions set forth below and: (i) the warranty for TurboVap products shall be ninety (90) days from the date of shipment, (ii) the warranty forLimited-Life Parts (as defined below) shall be thirty (30) days from the date of installation, and (iii) the warranty for cosmetic surfaces shall bethirty (30) days from the date of installation (each, a “Warranty Period”). Ongoing service support after the Warranty Period may be available atan additional expense.A. What is Included during the Warranty Period• unlimited emergency on-site repair services 1 , parts and software updates that affect original functional design specifications, theirassociated labor and travel expenses.• unlimited access to Caliper’s Technical Support Center, which provides troubleshooting, repair instruction, service dispatching (other thanfor TurboVap and Twister I), replacement part information and shipment.• A completed Caliper Field Service Report provides thorough documentation of all maintenance and service work performed by the CaliperField Service Engineer during an on-site visit. Documentation is not provided when Caliper provides service via telephone, fax or email.Any failure of a product to conform to this Warranty shall be corrected by replacing or repairing the affected product or refunding the purchaseprice (as described below), in each case at Caliper’s option. Parts replaced during the Warranty Period will be covered for the remaining termof the original Warranty Period, or for thirty (30) days from time of replacement, whichever is longer. Such replacement parts may, at Caliper’soption, be new or remanufactured. All parts removed from warranted equipment become the property of Caliper. Caliper reserves the right tosatisfy its warranty obligations in full by refunding the purchase price of any non-conforming product, minus any service, validation, or travelcharges.B. Customer ResponsibilitiesIn order for a product to be covered under this Warranty, Customer must comply with the following terms:• The equipment must be used under normal installation and application conditions as described in the product’s <strong>User</strong> <strong>Manual</strong>.• The equipment must be maintained as described in the <strong>User</strong> <strong>Manual</strong>.• Only water or DMSO at a maximum concentration of 65% may be used as a system fluid in the Sciclone inL10. Any other system fluid mustbe approved by Caliper before use in the inL10.• When Caliper provides telephone, fax, or email support, Customer is responsible for completing any necessary documentation of theservice.• If Customer maintains a change control/validation logbook as a permanent record, then Customer is responsible for entering all servicedocumentation into such logbook.• Customer must perform the appropriate level of revalidation required as a result of the maintenance or service provided.C. Exclusions• Failure to comply with any of the Customer Responsibilities listed above will void this Warranty.• Any alteration of hardware or software on products covered under this Warranty that are not performed by Caliper or an approved Calipervendor will void this Warranty.• A product that has been subject to misuse, accident, negligence or improper transportation, handling, installation, storage, use, ormaintenance is not covered under this Warranty.• Many Caliper products require the use of Caliper Automation Certified Disposables for proper operation. These may include, but are notlimited to: pipet tips, seals, labels and filters. Use of a Caliper product with any disposables other than the specified Caliper AutomationCertified Disposables will void this Warranty.• This Warranty covers equipment manufactured by Caliper. Equipment purchased from other vendors is not covered by this Warranty.• Damage to Limited-Life Parts caused by insufficient maintenance or cleaning practices or unauthorized applications are not covered underthis Warranty.• This Warranty applies only to the original buyer and delivery location. It is not transferable to other buyers or locations without Caliper’s priorwritten approval.• The Sciclone 384-channel low-volume head is warranted for one (1) year or 750,000 aspirate or dispense movements, whichever comesfirst.• The Sciclone 100nL head is warranted for one (1) year or 600,000 aspirate or dispense movements, whichever comes first.• The laser component of the <strong>LabChip</strong> 3000 is warranted for the earlier of one (1) year from the date of installation or 8,000 hours of use.• The use in a Sciclone inL10 of DMSO above 65% concentration, or any other system fluid not sanctioned for use by Caliper, will invalidatethis warranty as it relates to the pipetting head assembly.1. TurboVap and Twister are not eligible for on-site service, and must be returned to Caliper’s Repair Depot for warranty servicepursuant to the process set forth in Section E below.P/N 113642 Rev. 2 Caliper Life Sciences, Inc.
Caliper Life Sciences, Inc. Product Warranty 272If Caliper performs service on equipment and determines that any of the exclusions set forth in this Warranty apply, then Caliper shall chargeCustomer its then-current current list prices for parts, labor and travel.D. Limited-Life PartsLimited-Life Parts are any parts that are exposed to solvents, reagents, or samples. Such parts include, but are not limited to syringes, valves,seals and fittings. A pre-defined list of Limited-Life Parts are routinely replaced by Caliper Field Service Engineers during an ExtendedWarranty or Service Contract Preventative Maintenance visit or during Caliper Repair Depot servicing. Otherwise, these parts are availablefrom Caliper at current list prices and are designed for replacement by Customer.E. Equipment Return PolicyIn servicing situations requiring the return of equipment to Caliper, equipment must be returned to Hopkinton, MA, USA, or another facilitydesignated by Caliper. Customer shall prepay shipping charges for equipment returned to Caliper, and Caliper will pay for return shipment toCustomer.A Returned Material Authorization (RMA) must be obtained for any equipment being returned to Caliper. Contact the Caliper Technical SupportCenter by telephone at (508)-435-9761, or via the Internet at techsupport@caliperls.com or by fax at (508)-435-0950 before returning anyequipment to Caliper. Customer must complete a Caliper Chemical Questionnaire prior to the issuance of an RMA. All equipment returned toCaliper must first be decontaminated to meet Caliper and United States Department of Transportation procedures and standards for the safetyof Caliper personnel.F. Hazardous Limitation StatementAt no time will Caliper personnel perform service on unsafe equipment, perform service in unsafe environments or decontaminateequipment to make it safe.Prior to performing any service work, Caliper personnel will evaluate the condition of the equipment and the environment in which theequipment is located. If Caliper determines that the equipment and/or the environment could be hazardous to Caliper personnel, Caliperreserves the right to refuse to service the equipment.II. MICROFLUIDIC CHIPSCaliper warrants that microfluidic chips (each, a “Chip”) purchased from Caliper by Customer will be free from defects in material andworkmanship for a period of sixty (60) days from the date of shipment (the “Warranty Period”). A “defect” for purposes of this Warranty isdefined as any failure that occurs during analysis of the first one hundred (100) samples being run on a Chip. During the Warranty Period, ifthe Chip fails to comply with this Warranty, Caliper will repair or replace the Chip at its option and expense. If a Chip becomes damaged or itsperformance otherwise deteriorates due to solvents and or reagents other than those supplied or expressly recommended by Caliper, Caliperwill replace the Chip at Customer’s request and expense. No such replacement will extend the original Warranty Period. This Warranty doesnot extend to any Chip which has been (a) the subject of an accident, misuse, or neglect, (b) modified by a party other than Caliper, (c) used ina manner not in accordance with the instructions contained in the product <strong>User</strong>’s <strong>Manual</strong>, or (d) used for an assay or application which has notbeen approved by Caliper. All claims under this Warranty must be made within thirty (30) days of the discovery of the defect. Caliper’sobligations under this Warranty are limited to replacement as Caliper deems necessary to correct those failures of the Chip to comply with thisWarranty of which Caliper is notified prior to expiration of the Warranty Period.III. GENERALCALIPER SPECIFICALLY DISCLAIMS ANY AND ALL OTHER PROMISES, REPRESENTATIONS, AND WARRANTIES, EXPRESSED ORIMPLIED. THIS INCLUDES, BUT IS NOT LIMITED TO, THE PRODUCT’S CONDITION, ITS CONFORMITY TO ANY DESCRIPTION ORREPRESENTATION, THE EXISTENCE OF ANY LATENT OR PATENT DEFECTS, AND IMPLIED WARRANTIES OF MERCHANTABILITYAND FITNESS FOR A PARTICULAR PURPOSE. IN NO EVENT WILL CALIPER BE LIABLE, WHETHER ARISING IN CONTRACT, TORT(INCLUDING NEGLIGENCE), STRICT LIABILITY OR OTHERWISE, FOR ANY LOSS OF PROFIT OR ANY OTHER COMMERCIALDAMAGES, INCLUDING, BUT NOT LIMITED TO, SPECIAL, INCIDENTAL, CONSEQUENTIAL, OR OTHER AND IN NO EVENT SHALLCALIPER’S LIABILITY EXCEED THE PURCHASE PRICE OF THE PRODUCT. THERE ARE NO ORAL STATEMENTS, PROMISES,REPRESENTATIONS OR OTHER WARRANTIES COLLATERAL TO OR AFFECTING THIS WARRANTY. THIS WARRANTY EXTENDS TOBUYER ONLY AND NOT TO PURCHASERS OR USERS OF BUYER’S PRODUCTS.No agent, employee, or representative of Caliper has any authority to bind Caliper to any affirmation, representation, or warranty concerning aCaliper product that is not contained in Caliper’s printed product literature or this Warranty. Any such affirmation, representation, or warrantymade by any agent, employee, or representative of Caliper will not be binding on Caliper.P/N 113642 Rev. 2 Caliper Life Sciences, Inc.
Caliper Life Sciences, Inc. Software License Agreement 273Caliper Life Sciences, Inc. Software License AgreementThank you for purchasing our products. PLEASE READ THE TERMS AND CONDITIONS OF THIS LICENSE AGREEMENT CAREFULLYBEFORE OPENING THE PACKAGE CONTAINING THE SOFTWARE MEDIA, THE COMPUTER SOFTWARE CONTAINED THEREIN, ANDTHE ACCOMPANYING USER DOCUMENTATION (COLLECTIVELY REFERRED TO HEREIN AS THE “PROGRAM”). THE PROGRAM ISCOPYRIGHTED AND LICENSED, NOT SOLD. BY OPENING THE PACKAGE CONTAINING THE PROGRAM, YOU ARE ACCEPTING ANDAGREEING TO THE TERMS OF THIS LICENSE AGREEMENT. IF YOU ARE NOT WILLING TO BE BOUND BY THE TERMS OF THISLICENSE AGREEMENT, YOU SHOULD PROMPTLY RETURN THE PROGRAM IN UNOPENED FORM, AND YOU WILL RECEIVE AREFUND. THIS LICENSE AGREEMENT REPRESENTS THE ENTIRE AGREEMENT CONCERNING THE PROGRAM BETWEEN YOU ANDCALIPER LIFE SCIENCES, INC. (REFERRED TO AS “LICENSOR”), AND IT SUPERSEDES ANY PRIOR PROPOSAL,REPRESENTATION, OR UNDERSTANDING BETWEEN YOU AND LICENSOR.1 License Grant.Licensor hereby grants to you, and you accept, a nonexclusive license to use the Program only as authorized in this License Agreement.The software included in the Program (the “Software”) may be used only on a single computer owned, leased, or otherwise controlled byyou; or, in the event of the inoperability of that computer, on a backup computer selected by you. If the Software is an applicationspackage, you may use it on a single, local system controller. Neither concurrent use on two or more computers nor use in a local areanetwork or other network is permitted without written authorization from licensor and the payment of additional license fees. You agreethat you will not assign, sublicense, transfer, pledge, lease, rent, or share your rights under this License Agreement, except that you maypermanently transfer all of your rights under this License Agreement, provided that you retain no copies, you transfer all of the Program,and the transferee agrees to the terms of this License Agreement. You agree that you may not reverse assemble, reverse compile, orotherwise translate the Software.Upon loading the Software into your computer, you may retain the Software media for backup purposes. In addition, you may make onecopy of the Software on a second medium for the purpose of backup in the event the Software media is damaged or destroyed. Any suchcopies of the Software shall include Licensor's copyright and other proprietary notices. Except as authorized under this paragraph, nocopies of the Program or any portions thereof may be made by you or any person under your authority or control.2 Licensor’s Rights.Licensor has invested significant time and money in developing the products purchased with the Program. The Program containsLicensor's trade secrets, which must be used in confidence. You acknowledge and agree that the program is proprietary to Licensor andprotected under U.S. copyright law. You further acknowledge and agree that all right, title, and interest in and to the Program, includingassociated intellectual property rights, are and shall remain with Licensor. This License Agreement does not convey to you an interest inor to the Program, but only a limited right to use it, revocable in accordance with the terms of this License Agreement. In the event of abreach, the Licensor reserves the right to seek equitable relief.3 License Fees.The license fees paid by you in connection with the purchase of the associated product(s) are paid in consideration of the licensesgranted under this License Agreement.4 Term.This License Agreement is effective upon your opening of this package and shall continue until terminated. You may terminate thisLicense Agreement at any time by returning the Program, and all copies thereof and extracts therefrom to Licensor. Licensor mayterminate this License Agreement upon the breach by you of any term hereof. Upon such termination by Licensor, you agree to return toLicensor the Program and all copies and portions thereof.5 Limited Warranty.Licensor warrants, for your benefit alone, for a period of 90 days from the date of the commencement of this License Agreement (referredto as the “Warranty Period”) that the Software Media in which the Software is contained are free from defects in material andworkmanship. If, during the Warranty Period, a defect in the Software Media arises, you may return the Program to Licensor for eitherreplacement or, if so elected by Licensor, refund of amounts paid by you under this License Agreement. You agree that the foregoingconstitutes your sole and exclusive remedy for breach by Licensor of any warranties made under this License Agreement. EXCEPT FORTHE WARRANTIES SET FORTH ABOVE, THE PROGRAM IS LICENSED “AS IS,” AND THE LICENSOR DISCLAIMS ANY AND ALLOTHER WARRANTIES, WHETHER EXPRESS OR IMPLIED, INCLUDING, WITHOUT LIMITATION, ANY IMPLIED WARRANTIES OFMERCHANTABILITY OR FITNESS FOR A PARTICULAR PURPOSE.6 Limitation of Liability.Licensor's cumulative liability to you or any other party for any loss or damages resulting from any claims, demands, or actions arising outof or relating to this License Agreement shall not exceed the license fee paid to Licensor for the use of the Program. In no event shallLicensor be liable for any indirect, incidental, consequential, special, or exemplary damages or lost profits, even if Licensor has beenadvised of the possibility of such damages. SOME STATES DO NOT ALLOW THE LIMITATION OR EXCLUSION OF LIABILITY FORINCIDENTAL OR CONSEQUENTIAL DAMAGES, SO THE ABOVE LIMITATION OR EXCLUSION MAY NOT APPLY TO YOU.P/N 104954 Rev. 3 Caliper Life Sciences, Inc.
Caliper Life Sciences, Inc. Software License Agreement 2747 Software Updates.Licensor periodically creates Software updates which will be made available to you at no charge. Thereafter, Licensor shall not beresponsible for your use of, and shall not warrant or repair, superseded or outdated versions of Software.8 Governing Law.This License Agreement shall be construed and governed in accordance with the laws of the Commonwealth of Massachusetts. Anydispute will be resolved in the state and federal courts of the Commonwealth of Massachusetts.9 Severability.Should any term of this License Agreement be declared void or unenforceable by any court of competent jurisdiction, such declarationshall have no effect on the remaining terms hereof.10 No Waiver.The failure of either party to enforce any rights granted hereunder or to take action against the other party in the event of any breachhereunder shall not be deemed a waiver by that party as to subsequent enforcement of rights or subsequent actions in the event of futurebreaches.P/N 104954 Rev. 3 Caliper Life Sciences, Inc.
Index 275IndexNumerics21 CFR Part 11 option . . . . . . . . . . . 90AAborting a run . . . . . . . . . . . . . . . . . . 28About <strong>LabChip</strong> <strong>GX</strong> Window. . . . . . . 150AC power cable . . . . . . . . . . . . . . . 223Access Rights, changing. . . . . . . . . . 97Account policies . . . . . . . . . . . . . . . . 99Activating username . . . . . . . . . . . . . 96Active Data Tab. . . . . . . . . . . . . . . . 131Add New Expected Peak Window . . 151Add Plate Window. . . . . . . . . . . . . . 152Adding a New Plate . . . . . . . . . . . . . 32Adding a new username . . . . . . . . . . 94Adding a peak. . . . . . . . . . . . . . . . . . 64Advanced Tab . . . . . . . . . . . . . . 171, 208Assay Analysis Window. . . . . . . 171Start Run Window . . . . . . . . . . . 208AIA format . . . . . . . . . . . . . . . . . . 87, 89Algorithm, Baseline. . . . . . . . . . . . . 158Align marker peaks . . . . . . . . . . . . . . 68Alignmentoptics . . . . . . . . . . . . . . . . . . . . 224turning on/off . . . . . . . . . . . . . . . . 68using default ladder. . . . . . . . . . . 67Alignment Tab. . . . . . . . . . . . . . . . . 155Altitude . . . . . . . . . . . . . . . . . . . . . . 229Analysis .62, 117, 251, 257, 260, 261, 262Analysis menu. . . . . . . . . . . . . . .117Analysis On/Off . . . . . . . . . . . . . .117Analysis parameters . . . . . . . . . . 62Assay Analysis window . . . . . . . 153DNA assays . . . . . . . . . . . . . . . 251How the Software Analyzes DNAData . . . . . . . . . . . . . . . . . . . . . . 36How the Software Analyzes GlycanData . . . . . . . . . . . . . . . . . . . . . . 47How the Software Analyzes ProteinData . . . . . . . . . . . . . . . . . . . . . . 38How the Software Analyzes RNAData . . . . . . . . . . . . . . . . . . . . . . 42identifying peaks . . . . . . . . . . . . 260ladder . . . . . . . . . . . . . . . . . . . . 257Protein assays . . . . . . . . . . . . . . 261RNA assays . . . . . . . . . . . . . . . . 262turning on/off . . . . . . . . . . . . . . . . 68Analysis Tab. . . . . . . . . . . . . . . . . . . 156AnnotationAnnotate expected peaks . . . . . . 134text . . . . . . . . . . . . . . . . . . . . . . . 134Apex . . . . . . . . . . . . . . . . . . . . . 36, 247Assay. . . . . . . . . . . . . . . . . . . 18, 21, 72Assay Analysis window. . . . . . . . 153Assay file . . . . . . . . . . . . . . . . . . 247Assay Information Tab . . . . . . . . 154Assay <strong>User</strong> Guides . . . . . . . . . . . . 21Assay Voltage. . . . . . . . . . . . . . . 229Class . . . . . . . . . . . . . . . . . . . . . 154Comments . . . . . . . . . . . . . . . . . 154Exporting an assay . . . . . . . . . . . . 72Name . . . . . . . . . . . . . . . . . . . . . 154Principles . . . . . . . . . . . . . . . . . . . 18Saving an assay . . . . . . . . . . . . . . 72Starting a Run. . . . . . . . . . . . . . . . 21Title . . . . . . . . . . . . . . . . . . . . . . 154Assay Analysis Window . . . . . . . . . . 153Audit Trail. . . . . . . . . . . . . . . . . . . . . 103export . . . . . . . . . . . . . . . . . . . . . 105viewing . . . . . . . . . . . . . . . . . . . . 104Audit Trail Export Window . . . . . . . . 174Audit Trail Manage Columns Window175Audit Trail Window . . . . . . . . . . . . . . 173Auto Export . . . . . . . . . . . . . . . . . . . . 26Auto Export window . . . . . . . . . . . . . 184BBacking up data files . . . . . . . . . . . . . 50Backup Server . . . . . . . . . . . . . . . . . 109backing up to remote folder . . . . 111setting up . . . . . . . . . . . . . . . . . . 109Barcode . . . . . . . . . . . . . . . . . . . . . . 229Barcode Engine . . . . . . . . . . . . . 229Barcode reader. . . . . . . . . . . . . . 224Barcode Test . . . . . . . . . . . . . . . 242Label position . . . . . . . . . . . . . . . . 34Supported Barcode Types . . . . . 229Baseline. . . 36, 38, 42, 156, 158, 248, 259Algorithm . . . . . . . . . . . . . . . . . . 158Analysis Tab . . . . . . . . . . . . . . . . 156Plateau . . . . . . . . . . . . . . . . . 36, 158P/N 127170 Rev. 00 <strong>LabChip</strong> <strong>GX</strong> <strong>User</strong> <strong>Manual</strong> Caliper Life Sciences, Inc.
Index 276Bracketed ladder. . . . . . . . . . . . . . . 155Bubble . . . . . . . . . . . . . . . . . . . . . . 248Buffer vial . . . . . . . . . . . . . . . . . . . . 228CCables . . . . . . . . . . . . . . . . . . . . . . 223Calibration Point . . . . . . . . . . . . . . . 171Calibration standard . . . . . . . . . . . . 168Caliper Center for Training andDevelopment. . . . . . . . . . . . . . . . . . . . 3Cannot save a file . . . . . . . . . . . . . . 244Cartridge. . . . . . . . . . . . . . . . . . . . . 226CDR . . . . . . . . . . . . . . . . . . . . . . . . 106security suggestions . . . . . . . . . 106CDR Folder. . . . . . . . . . . . . . . . . . . 179CDR Manager Window . . . . . . . . . . 176CDR Server Utility Window . . . . . . . 178CDR Utility Window. . . . . . . . . . . . . 179Center Calibration Point . . . . . . . . . 171Center point . . . . . . . . . . . . . . . . . . 247Change Password Window . . . . . . . 181Changing access rights. . . . . . . . . . . 97Changing sample name . . . . . . . . 23, 54Changing the View of the Results . . . 72Changing user information . . . . . . . . 95Chemical Safety . . . . . . . . . . . . . . . . . 8Chip . . . . . . . . . . . . . . . . . . . . . . . . 225Chip button . . . . . . . . . . . . . . . . . . . 222Chip cartridge . . . . . . . . . . . . . . . . . 226cleaning the chip cartridge. . . . . 232Chip Expiration . . . . . . . . . . . . . . . . 121Chip focusing . . . . . . . . . . . . . . . . . 224Chip Interface Test . . . . . . . . . . . . . 240Chip Pressure system. . . . . . . . . . . 224Chip Status . . . . . . . . . . . . . . . . . . . 121Chip Temperature Test . . . . . . . . . . 241Chip Temperature Warning . . . . . . . 238Chromatography Data InterchangeFormat . . . . . . . . . . . . . . . . . . . . . 87, 89CLA file. . . . . . . . . . . . . . . . . . . . . . 249opening . . . . . . . . . . . . . . . . . . . . 51Cleaning the Chip Cartridge . . . 232, 243Clear Default Ladder button . . . . . . 156Clearing the default ladder . . . . . . . . 67Clipboard . . . . . . . . . . . . . . . . . . . . 249Collection . . . . . . . . . . .52, 117, 127, 249adding to workspace . . . . . . . . . . 52Collection Menu . . . . . . . . . . . . . 117Collection pane. . . . . . . . . . . . . . 127Selecting the Wells in a Collection 53template . . . . . . . . . . . . . . . . . . . 249Color, gel . . . . . . . . . . . . . . . . . . . . . 136Compare results. . . . . . . . . . . . . . . . . 72Compatible plates . . . . . . . . . . . . . . . 32Compute Resources Test . . . . . . . . . 240Computer Software Lock-Ups. . . . . . 244Concentration. . . . . . . . . . . . . . . 18, 156Concentration size correction. . . . . . 171Continuing a Run . . . . . . . . . . . . . . . . 29Contrast . . . . . . . . . . . . . . . . . . . . . . 136Copy . . . . . . . . . . . . . . . . . . . . . . . . . 80Copy Gel . . . . . . . . . . . . . . . . . . . 80Copy Graph . . . . . . . . . . . . . . . . . 80Copy Lane . . . . . . . . . . . . . . . . . . 80Correction, concentration size . . . . . 171Create daily subdirectories. . . . . . . . . 50Create New <strong>User</strong> Tab . . . . . . . . . . . . 214Current Calibration Test . . . . . . . . . . 242Current Leakage Check Failed Warning238Current Leakage Test. . . . . . . . . . . . 242Curve fit . . . . . . . . . . . . . . . . . . 156, 260Customer Support plans. . . . . . . . . . . . 3DData Analysis . . . . . . . . 35, 36, 38, 42, 47How the Software Analyzes DNAData . . . . . . . . . . . . . . . . . . . . . . . 36How the Software Analyzes GlycanData . . . . . . . . . . . . . . . . . . . . . . . 47How the Software Analyzes ProteinData . . . . . . . . . . . . . . . . . . . . . . . 38How the Software Analyzes RNAData . . . . . . . . . . . . . . . . . . . . . . . 42Data File . . . . . . . . 51, 72, 249, 250, 253automatically exporting . . . . . . . . 102backing up . . . . . . . . . . . . . . . . . 111evaluation. . . . . . . . . . . . . . . . . . . 72hiding . . . . . . . . . . . . . . . . . . . . . 108moving . . . . . . . . . . . . . . . . . . . . 107opening . . . . . . . . . . . . . . . . . . . . 51reanalyzing. . . . . . . . . . . . . . . . . . 81remote backup . . . . . . . . . . . . . . 109reverting to revision . . . . . . . . . . 102P/N 127170 Rev. 00 <strong>LabChip</strong> <strong>GX</strong> <strong>User</strong> <strong>Manual</strong> Caliper Life Sciences, Inc.
Index 277showing. . . . . . . . . . . . . . . . . . . 108signing . . . . . . . . . . . . . . . . . . . 101Data FIle Version Window. . . . . . . . 182Data filtering . . . . . . . . . . . . . . . . 36, 251Data Folder. . . . . . . . . . . . . . . . . . . 106creating . . . . . . . . . . . . . . . . . . . 107deleting . . . . . . . . . . . . . . . . . . . 107Data points . . . . . . . . . . . . . . . . . . . 250Data Range . . . . . . . . . . . . . . . . . . 156De/Activate <strong>User</strong> Tab . . . . . . . . . . . 217Deactivating username . . . . . . . . . . . 96Default Ladder . . . . . . . . . . . . . . . . . 65Define Access Tab . . . . . . . . . . . . . 218Degrade factor, RNA. . . . . . . . . . . . 263Detection Wavelength . . . . . . . . . . . 229Detector . . . . . . . . . . . . . . . . . . . . . 224Device Disconnected Error . . . . . . . 235Diagnostics . . . . . . . . . . . . . . . . . . . 239running tests . . . . . . . . . . . . . . . 239Dilution Ratio . . . . . . . . . . . . . . . . . 156Disconnected Device Error . . . . . . . 235DNA Assay Analysis . . . . . . . . . . . . 251Door . . . . . . . . . . . . . . . . . . . . . . . . 221EEdit <strong>User</strong>s Tab . . . . . . . . . . . . . . . . 215Eject button . . . . . . . . . . . . . . . . . . 222Electrical safety . . . . . . . . . . . . . . . . 10Electrode Cleaner . . . . . . . . . . . . . . 252Electrode wells . . . . . . . . . . . . . . . . 225Electrodes . . . . . . . . . . . . . . . . . . . 226Electrokinetic Forces . . . . . . . . . . . 252Electronic signatures . . . . . . . . . . . 101Electroosmotic Flow . . . . . . . . . . . . 252ElectropherogramGraph View Properties . . . . . . . 134printing . . . . . . . . . . . . . . . . . . . . 83Electropherograms tab . . . . . . . . 78, 133Electrophoresis. . . . . . . . . . . . . . 18, 252Enable Remote CDR Backup . . . . . 179End Point . . . . . . . . . . . . . . . . . . . . 252End Time . . . . . . . . . . . . . . 36, 158, 252changing . . . . . . . . . . . . . . . . . . . 68Entire collection . . . . . . . . . . . . . . . 146Error Messages . . . . 235, 236, 237, 238Chip Temperature Warning . . . . 238Current Leakage Check FailedWarning . . . . . . . . . . . . . . . . . . . 238Device Disconnected Error . . . . . 235Error Message Area . . . . . . . . . . 123Focus Failed Error . . . . . . . 236, 237IV Check Failed Warning . . . . . . 238Move Timeout Error . . . . . . . . . . 236Plate Carrier Motion Blocked Error . .236Pressure Leak Detected Error. . . 237Event Viewer Window . . . . . . . . . . . 183Searching for Events in the EventsTab . . . . . . . . . . . . . . . . . . . . . . . 233Viewing Current Events in the EventsTab . . . . . . . . . . . . . . . . . . . . . . . 234Viewing Past Events in the EventsTab . . . . . . . . . . . . . . . . . . . . . . . 234Excluded fragments . . . . . . . . . . . . . 164Excluded peaks . . . . . . . . . . . . . . . . 164Excluded Peaks Tab. . . . . . . . . . . . . 164Excluded proteins . . . . . . . . . . . . . . 164Excluding a peak . . . . . . . . . . . . . 36, 64Expected fragments . . . . . . . . . . . . . . 57Expected Fragments Tab . . . . . . . . . 162Expected glycans . . . . . . . . . . . . . . . . 57Expected Glycans Tab . . . . . . . . . . . 162Expected Peakscreating . . . . . . . . . . . . . . . . . . . . 57exporting . . . . . . . . . . . . . . . . . . . 58forcing . . . . . . . . . . . . . . . . . . . . . 59importing . . . . . . . . . . . . . . . . . . . 58viewing in Gel View . . . . . . . . . . . 60viewing in Peak Table View. . . . . . 61viewing in Well Table View . . . . . . 61Expected Peaks only . . . . . . . . . . . . 146Expected Peaks Tab . . . . . . . . . . . . 162Expected proteins . . . . . . . . . . . . . . . 57Expected Proteins Tab . . . . . . . . . . . 162Export54, 86, 162, 164, 166, 168, 174, 184Audit Trail Export Window. . . . . . 174Auto Export window . . . . . . . . . . 184Automatically . . . . . . . . . . . . . . . . 26default ladder . . . . . . . . . . . . . . . . 67Excluded Peaks button . . . . . . . . 164Expected fragments . . . . . . . . . . 162Expected peaks . . . . . . . . . . . . . 162Expected Peaks button. . . . . . . . 162P/N 127170 Rev. 00 <strong>LabChip</strong> <strong>GX</strong> <strong>User</strong> <strong>Manual</strong> Caliper Life Sciences, Inc.
Index 278Expected proteins . . . . . . . . . . . 162Export window. . . . . . . . . . . . . . 184<strong>Manual</strong>ly . . . . . . . . . . . . . . . . . 86, 89Sample names . . . . . . . . . . . . . . 54Select the Auto Export Settings . . 26Smear button. . . . . . . . . . . . . . . 166Titer. . . . . . . . . . . . . . . . . . . . . . 168Export As Assay button. . . . . . . . . . 153Exporting an assay . . . . . . . . . . . . . . 72FFile menu . . . . . . . . . . . . . . . . . . . . .116Filter View. . . . . . . . . . . . . . . . . . . . 147Filter Width . . . . . . . . . . . . . 36, 158, 252Filtered Peaks only . . . . . . . . . . . . . 146Filtering parameters . . . . . . . . . . . . . 62Finding peaks . . . . . . . . . . . . . . . . . 260First Peak Time. . . . . . . . . . . . . . . . 268Focus Failed Error . . . . . . . . . . 236, 237Focusing. . . . . . . . . . . . . . . . . . . . . 224Font . . . . . . . . . . . . . . . . . . . . . . . . 134Forcing expected peaks . . . . . . . . . . 59Front panel . . . . . . . . . . . . . . . . . . . 222Front view. . . . . . . . . . . . . . . . . . . . 221Fuses . . . . . . . . . . . . . . . . . . . . . 11, 229GGel . . . . . . . . . . . . . . . . . . . . . . . 80, 136copying . . . . . . . . . . . . . . . . . . . . 80exporting . . . . . . . . . . . . . . . . . . . 88Gel color . . . . . . . . . . . . . . . . . . . 72Gel View . . . . . . . . . . . . . . . . . . 136Gel View Properties. . . . . . . . . . 139printing . . . . . . . . . . . . . . . . . . . . 82Gel Color . . . . . . . . . . . . . . . . . . . . 139Gel Contrast Range . . . . . . . . . . . . 139Gel View Properties . . . . . . . . . . . . 139Global Analysis settings . . . . . . . . . 153Global Peak Find . . . . . . . . . . . . . . . 36Graph . . . . . . . . . . . . . . . 36, 72, 80, 266Active Data tab . . . . . . . . . . . . . 131copying . . . . . . . . . . . . . . . . . . . . 80Electropherograms tab . . . . . . . 133Graph View Properties . . . . . . . 134max per page . . . . . . . . . . . . . . 134overlay . . . . . . . . . . . . . . . . . . . . 77Overlay Electropherograms Tab 132printing . . . . . . . . . . . . . . . . . . . . . 83selected gels only. . . . . . . . . . . . 134Standard curve . . . . . . . . . . . 36, 266Graph selected gels only . . . . . . . . . 134Graph View . . . . . . . . . . . . . . . . . . . 128Grounding . . . . . . . . . . . . . . . . . . . . 229<strong>GX</strong>D file . . . . . . . . . . . . . . . . . . . . . . . 51HHardware Diagnostics . . . . . . . . . . . 253Heat Emission . . . . . . . . . . . . . . . . . 229Help menu . . . . . . . . . . . . . . . . . . . . 120Hide excluded peaks . . . . . . . . . . . . 146Hiding views. . . . . . . . . . . . . . . . . . . . 75High Voltage safety . . . . . . . . . . . . . . 10Home Timeout . . . . . . . . . . . . . . . . . 236How the Software Analyzes DNA Data36How the Software Analyzes Glycan Data47How the Software Analyzes Protein Data38How the Software Analyzes RNA Data42IIdentifying peaks . . . . . . . . . . . . . . . 260Import . . . . . . 51, 54, 162, 164, 166, 168data file . . . . . . . . . . . . . . . . . . . . 51Excluded Peaks button . . . . . . . . 164Expected Peaks button. . . . . . . . 162sample names . . . . . . . . . . . . . . . 54Smear button . . . . . . . . . . . . . . . 166Titer . . . . . . . . . . . . . . . . . . . . . . 168Inflection Threshold . . . . . . . . . 158, 254Installation Qualification Window . . . 187Instrument description . . . . . . . . . . . 221Instrument menu . . . . . . . . . . . . . . . 118Instrument safety . . . . . . . . . . . . . . . . . 7IQ, running . . . . . . . . . . . . . . . . . . . . 112IV Check Failed Warning . . . . . . . . . 238L<strong>LabChip</strong> <strong>GX</strong> main window . . . . . . . . 114<strong>LabChip</strong> Kit assay description . . . . . . 18Label position. . . . . . . . . . . . . . . . . . . 34Lab-on-a-Chip . . . . . . . . . . . . . . . . . 256Ladder . . . . . . . . . . . . . 36, 156, 256, 257Alignment tab . . . . . . . . . . . . . . . 155P/N 127170 Rev. 00 <strong>LabChip</strong> <strong>GX</strong> <strong>User</strong> <strong>Manual</strong> Caliper Life Sciences, Inc.
Index 279clearing default ladder . . . . . . . . . 67concentration . . . . . . . . . . . . . . 156exporting default ladder. . . . . . . . 67Ladder Analysis. . . . . . . . . . . . . 257ratio. . . . . . . . . . . . . . . . . . . . . . 156selecting default . . . . . . . . . . . . . 65using default . . . . . . . . . . . . . . . . 67Ladder vial . . . . . . . . . . . . . . . . . . . 228Lane Width . . . . . . . . . . . . . . . . . . . 139Laser . . . . . . . . . . . . . . . . . . . . . . . 224Laser Safety . . . . . . . . . . . . . . . . . 9Last Peak Time. . . . . . . . . . . . . . . . 252Layout Options Window . . . . . . . . . 188Leading Edge . . . . . . . . . . . . . . . . . 171Line Voltage . . . . . . . . . . . . . . . . . . 229Linear Fit . . . . . . . . . . . . . . . . . . . . 168Location, barcode label. . . . . . . . . . . 34Locking the software . . . . . . . . . . . . . 92Log file . . . . . . . . . . . . . . . . . . . . . . 257Log fit . . . . . . . . . . . . . . . . . . . . . . . 156Login Window . . . . . . . . . . . . . . . . . 189Lower marker . . . . . . . . . . . . . . . . . 257MMain window. . . . . . . . . . . . . . . . . . .114Maintenance and Service . . . . . . . . 231Cleaning the Chip Cartridge 232, 243<strong>Manual</strong> export. . . . . . . . . . . . . . . . . . 89<strong>Manual</strong> peak . . . . . . . . . . . . . . . . . . . 64<strong>Manual</strong>ly exporting data . . . . . . . . . . 89Marker . . . . . . . . . . . . . . . . . 36, 42, 156aligning . . . . . . . . . . . . . . . . . . . . 68Assigning . . . . . . . . . . . . . . . . . . 36Assignments . . . . . . . . . . . . . . . 156concentration . . . . . . . . . . . . . . 156LM for Glycan . . . . . . . . . . . . . . . 71LM for Protein and RNA . . . . . . . 70Marker well . . . . . . . . . . . . . . . . 225Not detected . . . . . . . . . . . . . . . . 36UM and LM for DNA . . . . . . . . . . 69Maximum Graphs per Page . . . . . . 134Mechanical safety . . . . . . . . . . . . . . . .11Menu . . . . . . 115, 116, 117, 118, 119, 120Analysis menu. . . . . . . . . . . . . . .117Collection Menu . . . . . . . . . . . . .117File menu . . . . . . . . . . . . . . . . . .116Help menu. . . . . . . . . . . . . . . . . 120Instrument menu. . . . . . . . . . . . . 118Menu Bar . . . . . . . . . . . . . . . . . . 115Security menu . . . . . . . . . . . . . . 119Tools menu . . . . . . . . . . . . . . . . . 118Validation menu . . . . . . . . . . . . . 119View menu . . . . . . . . . . . . . . . . . 119Window menu. . . . . . . . . . . . . . . 120Workspace Menu . . . . . . . . . . . . 116Merging two peaks . . . . . . . . . . . . . . . 65Microfluidics . . . . . . . . . . . . . . . . . . . 257Microplate . . . . . . . . . . . . . . . . . 32, 228Microplate carrier . . . . . . . . . . . . . . . 228Migration Time . . . . . . . . . . . . . . . . . . 36Min Peak Width . . . . . . . . . . . . . 36, 258Minimum peak height . . . . . . . . 158, 258Minimum Peak Width . . . . . . . . . . . . 158Minimum Sip Height . . . . . . . . . . . . . . 32Modifying Analysis Parameters . . . . . 62Molarity . . . . . . . . . . . . . . . . . . . 36, 258Molecular Separation Techniques. . . 258Monitoring the Run. . . . . . . . . . . . . . . 27Mouse shortcuts. . . . . . . . . . . . . . . . 246Move Timeout Error . . . . . . . . . . . . . 236MSDS . . . . . . . . . . . . . . . . . . . . . . . . . 8NName, adding a new user. . . . . . . . . . 94New assay . . . . . . . . . . . . . . . . . . . . . 72New Collection Window . . . . . . . . . . 190New plate. . . . . . . . . . . . . . . . . . . . . . 32New username. . . . . . . . . . . . . . . . . . 94New workspace . . . . . . . . . . . . . . . . . 50Normalization Standard . . . . . . . . . . 268OOnly Annotate Expected Peaks . . . . 134Opening a Data File . . . . . . . . . . . . . . 51Opening a New Workspace . . . . . . . . 50Operating Humidity . . . . . . . . . . . . . 229Operating Temperature . . . . . . . . . . 229Optics . . . . . . . . . . . . . . . . . . . . . . . 224Optics Test . . . . . . . . . . . . . . . . . . . . 241OQ, running . . . . . . . . . . . . . . . . . . . 112Orientation . . . . . . . . . . . . . . . . . . . . 134O-rings. . . . . . . . . . . . . . . . . . . . . . . 226Output Tab, Start Run Window . . . . . 206Overlay Electropherogram, printing . . 83P/N 127170 Rev. 00 <strong>LabChip</strong> <strong>GX</strong> <strong>User</strong> <strong>Manual</strong> Caliper Life Sciences, Inc.
Index 280Overlay Electropherograms Tab . . . 132Overlaying well graphs . . . . . . . . . . . 72PPane width, adjusting . . . . . . . . . . . . 75Password . . . . . . . . . . . . . . . . . . 94, 181Change Password Window . . . . 181requirements . . . . . . . . . . . . . . . . 94Peak36, 38, 42, 64, 171, 258, 259, 260, 261adding . . . . . . . . . . . . . . . . . . . . . 64Area . . . . . . . . . . . . . . . 38, 141, 261Baseline . . . 36, 38, 42, 158, 171, 259changing Peak Find parameters . 63count for smears . . . . . . . . . . . . 265excluding. . . . . . . . . . . . . . . . . . . 64Height . . . . . . . . . . . . . . . . . 258, 259identifying peaks . . . . . . . . . . . . 260merging peaks. . . . . . . . . . . . . . . 65Peak Find Settings . . . . . . . . . . 158Peak Find Tab . . . . . . . . . . . . . . 158Peak integration mode, Protein . 171Peak Size Calibration Point . . . . 171Peak Table View . . . . . . . . . . . . 141Show Peak Baseline . . . . . . . . . 134Valley to Valley Baseline . . . . . . 171Peak Find Tab. . . . . . . . . . . . . . . . . 158Peak Table . . . . . . . . . . . . . . . . . . . 141exporting . . . . . . . . . . . . . . . . . . . 86printing . . . . . . . . . . . . . . . . . . . . 85Properties . . . . . . . . . . . . . . . . . 146Perform Signature Window . . . . . . . 191Plate Capacity . . . . . . . . . . . . . . . . 229Plate Carrier Motion Blocked Error . 236Plate compatibility. . . . . . . . . . . . . . . 32Plate Height . . . . . . . . . . . . . . . . 32, 152Plate Information Window . . . . . . . . 192Plate Name. . . . . . . . . . . . . . . . . . . 152Plate Orientation . . . . . . . . . . . . . . . 229Plate Sensor Test . . . . . . . . . . . . . . 242Plate Type . . . . . . . . . . . . . . . . . . . 152Plate View or Plate List . . . . . . . . . . 124Plate, adding new . . . . . . . . . . . . . . . 32Plot Titer Curve button . . . . . . . . . . 168Point-to-point fit . . . . . . . . . . . . 156, 260Policies, user accounts . . . . . . . . . . . 99Pollution Degree . . . . . . . . . . . . . . . 229Polynomial . . . . . . 36, 158, 251, 260, 261Filter . . . . . . . . . . . . . . . . . . . . . . 260Fit. . . . . . . . . . . . . . . . . . . . . . . . 156Order . . . . . . . . . . . . . 158, 251, 261Position, barcode label. . . . . . . . . . . . 34Power button . . . . . . . . . . . . . . . . . . 222Power cable . . . . . . . . . . . . . . . . . . . 223Power cord selection . . . . . . . . . . . . . 11Power Input Specification . . . . . . . . . 229Preparing and Running An Assay. . . . 23Pressure . . . . . . . . . . . . . . . . . . . . . 224Pressure Leak Detected Error . . . . . 237Pressure Leak Test . . . . . . . . . . . . . 241Pressure Range . . . . . . . . . . . . . . . . 229Pressurization syringe . . . . . . . . . . . 261Print All . . . . . . . . . . . . . . . . . . . . . . . 82Print Validation Reports Window . . . 195Print Window . . . . . . . . . . . . . . . . . . 193Printing . . . . . . . . . . . . . . . . . . . . . . . 82access rights . . . . . . . . . . . . . . . . 98electropherogram . . . . . . . . . . . . . 83gel . . . . . . . . . . . . . . . . . . . . . . . . 82peak table. . . . . . . . . . . . . . . . . . . 85user information . . . . . . . . . . . . . . 96user policies . . . . . . . . . . . . . . . . 100well table . . . . . . . . . . . . . . . . . . . 84Workspace information . . . . . . . . . 82PropertiesGel View. . . . . . . . . . . . . . . . . . . 139Graph view . . . . . . . . . . . . . . . . . 134Peak Table . . . . . . . . . . . . . . . . . 146Protein . . . . . . . . . . . . . . . . . . . . . . . 171Concentration size correction . . . 171Peak Integration mode . . . . . . . . 171Protein Assay Analysis. . . . . . . . . . . 261Punch Test . . . . . . . . . . . . . . . . . . . . 242Punch test . . . . . . . . . . . . . . . . . . . . . 32Puncture test . . . . . . . . . . . . . . . . . . . 32QQuadratic Fit . . . . . . . . . . . . . . . . . . 168Quantitation . . . . . . . . . . . . . 18, 36, 171RRaw Data, exporting. . . . . . . . . . . . . . 87Reagent Expiration. . . . . . . . . . . . . . 121Reanalyzing data . . . . . . . . . . . . . . . . 81Red Laser . . . . . . . . . . . . . . . . . . . . 224P/N 127170 Rev. 00 <strong>LabChip</strong> <strong>GX</strong> <strong>User</strong> <strong>Manual</strong> Caliper Life Sciences, Inc.
Index 281Remote CDR Server . . . . . . . . . . . . 109backing up to. . . . . . . . . . . . . . . .111setting up . . . . . . . . . . . . . . . . . 109Rename Collection Window . . . . . . 196Reports, printing . . . . . . . . . . . . . . . . 82Restore Plate button . . . . . . . . . . . . 153Revision, data file . . . . . . . . . . . . . . 102RF ID Tag . . . . . . . . . . . . . . . . . . . . 225RF Tag Test . . . . . . . . . . . . . . . . . . 241Rights, changing access . . . . . . . . . . 97RNA Assay Analysis . . . . . . . . . . . . 262RNA Degrade factor . . . . . . . . . . . . 263Run. . . . . . . . . . . . . . .21, 23, 28, 29, 257aborting. . . . . . . . . . . . . . . . . . . . 28assay principles. . . . . . . . . . . . . . 18continuing . . . . . . . . . . . . . . . . . . 29log. . . . . . . . . . . . . . . . . . . . . . . 257monitoring the run . . . . . . . . . . . . 27running an assay. . . . . . . . . . . . . 23starting a run . . . . . . . . . . . . . . . . 21Run button . . . . . . . . . . . . . . . . 121, 264Run File Editor Window . . . . . . . . . 197Run Info Window . . . . . . . . . . . . . . 198Run Status . . . . . . . . . . . . . . . . . . . 121Run Tab, Start Run Window . . . . . . 204SSafety . . . . . . . . . . . . . . . . .7, 8, 9, 10, 11chemical . . . . . . . . . . . . . . . . . . . . 8electrical . . . . . . . . . . . . . . . . . . . 10fuses . . . . . . . . . . . . . . . . . . . . . . .11instrument . . . . . . . . . . . . . . . . . . . 7laser . . . . . . . . . . . . . . . . . . . . . . . 9mechanical . . . . . . . . . . . . . . . . . .11power cord . . . . . . . . . . . . . . . . . .11training required . . . . . . . . . . . . . . 7Sample . . . . . . . . . . .23, 36, 54, 134, 171Area . . . . . . . . . . . . . . . . . . . . . . 36Calculating size . . . . . . . . . . . . . . 36Ladder. . . . . . . . . . . . . . . . . . . . . 36Name . . . . . . . . . . . . . . . . . . . . 134Name template . . . . . . . . . . . . . . 54Sample Color . . . . . . . . . . . . . . 134Sample Peak Quantitation . . . . . 171Sample Saver . . . . . . . . . . . . . . . 23Sample Name Editor Window . . . . . 199Save . . . . . . . . . . . . . . . . . . . . . . . . . 30Saving and Exporting Assays . . . . 72Saving Plate Data Files . . . . . . . . 30Saving Workspace Files . . . . . . . . 31Save Workspace As Window . . . . . . 201Scale Gel Contrast . . . . . . . . . . . . . . 136Searching for Events in the Events Tab .233Security . . . . . . . . . . . . . . . . . . . . . . . 90Security menu . . . . . . . . . . . . . . . . . 119Select a Data File Window . . . . . . . . 202Selected in Gel. . . . . . . . . . . . . . . . . 146Selecting a Default Ladder . . . . . . . . . 65Selecting the Wells in a Collection . . . 53Service. . . . . . . . . . . . . . . . . . . . . . . 231Service plans . . . . . . . . . . . . . . . . . . . . 3Set Policies Tab . . . . . . . . . . . . . . . . 220Shortcuts . . . . . . . . . . . . . . . . . . . . . 246Show all peaks. . . . . . . . . . . . . . . . . 146Show Data Points. . . . . . . . . . . . . . . 134Show EP Legend . . . . . . . . . . . . . . . 139Show Expected Peaks . . . . . . . . . . . 139Show Legend in Gel. . . . . . . . . . . . . 139Show Peak Baselines. . . . . . . . . . . . 134Show <strong>User</strong> Info Tab . . . . . . . . . . . . . 216Showing views . . . . . . . . . . . . . . . . . . 75Signatures, electronic. . . . . . . . . . . . 101Signing a data file . . . . . . . . . . . . . . 101Sip Height . . . . . . . . . . . . . . . . . 32, 152Sipper location . . . . . . . . . . . . . . . . . 225Size . . . . . . . . . . . . . . . . . . . . . . . . . 229Size correction, Protein . . . . . . . . . . 171Slope Threshold. . . . . . . . . . . . . . . . 158Slope threshold . . . . . . . . . . . . . . . . 264Smear . . . . . . . . . . . . . . . . . . . . . . . 265Smear Analysis Tab . . . . . . . . . . . . . 166Smear color . . . . . . . . . . . . . . . . . . . 166Smear Name . . . . . . . . . . . . . . . . . . 166Smear Size . . . . . . . . . . . . . . . . . . . 166Software IQ Window. . . . . . . . . . . . . 187Software Reference . . . . . . . . . . . . . 113Sort within each well . . . . . . . . . . . . 146Specifications. . . . . . . . . . . . . . . 32, 229instrument . . . . . . . . . . . . . . . . . 229plate . . . . . . . . . . . . . . . . . . . . . . . 32Standard curve. . . . . . . . . . 36, 156, 266Start . . . . . . . . . . . . . . . . . . . 21, 23, 268Monitoring the Run . . . . . . . . . . . . 27P/N 127170 Rev. 00 <strong>LabChip</strong> <strong>GX</strong> <strong>User</strong> <strong>Manual</strong> Caliper Life Sciences, Inc.
Index 282Running the assay. . . . . . . . . . . . 23Start button . . . . . . . . . . . . . . . . . 23Start Point . . . . . . . . . . . . . . . . . 268Starting a Run . . . . . . . . . . . . . . . 23Start Run Window . . . . . . . . . . . . . . 203Start Time . . . . . . . . . . . . . . . . . . . . 158changing . . . . . . . . . . . . . . . . . . . 68Status light . . . . . . . . . . . . . . . . . . . 222Stop Button. . . . . . . . . . . . . . 23, 28, 121Storage Temperature . . . . . . . . . . . 229Support plans . . . . . . . . . . . . . . . . . . . 3Supported Barcode Types. . . . . . . . 229System Components Test . . . . . . . . 240System Diagnostics Window . . . . . . 210System log . . . . . . . . . . . . . . . . . . . 257System Peak Exclusion. . . . . . . . . . 156System Status. . . . . . . . . . . . . . . . . 121TTemperature Range . . . . . . . . . . . . 229Templates . . . . . . . . . . . . . . . . . . . . . 54Text orientation . . . . . . . . . . . . . . . . 134Thermal Limit Switch. . . . . . . . . . . . 229Time, changing analysis time . . . . . . 68Titer . . . . . . . . . . . . . . . . . . . . . . . . 268Titer Concentration to Favor in Fit. . 168Titer Size . . . . . . . . . . . . . . . . . . . . 168Titer Tab . . . . . . . . . . . . . . . . . . . . . 168Tool tip . . . . . . . . . . . . . . . . . . . . . . 268Tools menu . . . . . . . . . . . . . . . . . . . .118Training required. . . . . . . . . . . . . . . . . 7Transient Overvoltages . . . . . . . . . . 229Troubleshooting . . . . . . . . . 28, 233, 243Aborting a run . . . . . . . . . . . . . . . 28Chip Temperature Warning . . . . 238Cleaning the Chip Cartridge 232, 243Current Leakage Check Failed . 238Device Name is Disconnected . . 235Excluding a peak. . . . . . . . . . . . . 36Focus Failed . . . . . . . . . . . . . . . 237Home Timeout. . . . . . . . . . . . . . 236IV Check Failed. . . . . . . . . . . . . 238Move Timeout . . . . . . . . . . . . . . 236Plate Carrier Motion Blocked . . . 236Pressure Leak Detected . . . . . . 237Troubleshooting. . . . . . . . . . . . . 233Troubleshooting Assay Problems 243UUnlock Application Window . . . . . . . 212Unlocking the software. . . . . . . . . . . . 92Upper marker . . . . . . . . . . . . . . . . . . 268USB cable . . . . . . . . . . . . . . . . . . . . 223USB Key . . . . . . . . . . . . . . . . . . . . . 228<strong>User</strong> Administration Window . . . . . . 213<strong>User</strong> Standard . . . . . . . . . . . . . . . . . 171<strong>User</strong>nameactivating . . . . . . . . . . . . . . . . . . . 96adding new . . . . . . . . . . . . . . . . . . 94changing. . . . . . . . . . . . . . . . . . . . 95deactivating . . . . . . . . . . . . . . . . . 96printing user info. . . . . . . . . . . . . . 96VValidation menu . . . . . . . . . . . . . . . . 119Valley to Valley. . . . . . . . . . . . . . . . . 171Ventilation . . . . . . . . . . . . . . . . . . . . 229Verify Plate. . . . . . . . . . . . . . . . . . . . . 32Version, assay . . . . . . . . . . . . . . . . . 154View menu . . . . . . . . . . . . . . . . . . . . 119Viewing Current Events in the Events Tab234Viewing Graphs in theElectropherograms Tab . . . . . . . . . . . 78Viewing Past Events in the Events Tab .234Views . . . . . . . . . . . . . . . . . . . . . . . . 128Filter View . . . . . . . . . . . . . . . . . 147Gel View. . . . . . . . . . . . . . . . . . . 136Graph View. . . . . . . . . . . . . . . . . 128hiding views . . . . . . . . . . . . . . . . . 75Peak Table View . . . . . . . . . . . . . 141showing and hiding. . . . . . . . . . . . 75Well Table View . . . . . . . . . . . . . 140Voltage Calibration Test . . . . . . . . . . 242Voltage safety . . . . . . . . . . . . . . . . . . 10WWarnings . . . . . . . . . . . . . . . . . . . . . 238Chip Temperature Warning . . . . . 238Current Leakage Check FailedWarning . . . . . . . . . . . . . . . . . . . 238IV Check Failed Warning . . . . . . 238Wash button. . . . . . . . . . . . . . . . . . . 121Waste disposal. . . . . . . . . . . . . . . . . . . 8P/N 127170 Rev. 00 <strong>LabChip</strong> <strong>GX</strong> <strong>User</strong> <strong>Manual</strong> Caliper Life Sciences, Inc.
Index 283Waste wells . . . . . . . . . . . . . . . . . . 225Wavelength. . . . . . . . . . . . . . . . . . . 229Weight . . . . . . . . . . . . . . . . . . . . . . 229Well Depth . . . . . . . . . . . . . . . . . 32, 152Well Groups, aligning . . . . . . . . . . . 155Well Peak Find Settings . . . . . . . . . 158Well Table View . . . . . . . . . . . . . . . 140adding columns . . . . . . . . . . . . . . 79printing . . . . . . . . . . . . . . . . . . . . 84Wells, selecting. . . . . . . . . . . . . . . . . 53Window menu . . . . . . . . . . . . . . . . . 120Workspace . . . . . . . . . . . . . 52, 116, 269adding collection . . . . . . . . . . . . . 52opening a new workspace . . . . . . 50printing . . . . . . . . . . . . . . . . . . . . 82Saving Workspace Files . . . . . . . 31Workspace Menu. . . . . . . . . . . . .116XX Margin . . . . . . . . . . . . . . . . . . . 32, 152YY Margin . . . . . . . . . . . . . . . . . . . 32, 152ZZero baseline . . . . . . . . . . . . 36, 72, 269Zoom In . . . . . . . . . . . . . . . . . . . . . . 76Zoom Out . . . . . . . . . . . . . . . . . . . . . 76P/N 127170 Rev. 00 <strong>LabChip</strong> <strong>GX</strong> <strong>User</strong> <strong>Manual</strong> Caliper Life Sciences, Inc.
Caliper Life Sciences, Inc.68 Elm StreetHopkinton, Massachusetts 01748TEL 508-435-9500FAX 508-435-3439http://www.caliperLS.com