Long-term effects of riparian clear-cutting -richer land snail ...
Long-term effects of riparian clear-cutting -richer land snail ...
Long-term effects of riparian clear-cutting -richer land snail ...
You also want an ePaper? Increase the reach of your titles
YUMPU automatically turns print PDFs into web optimized ePapers that Google loves.
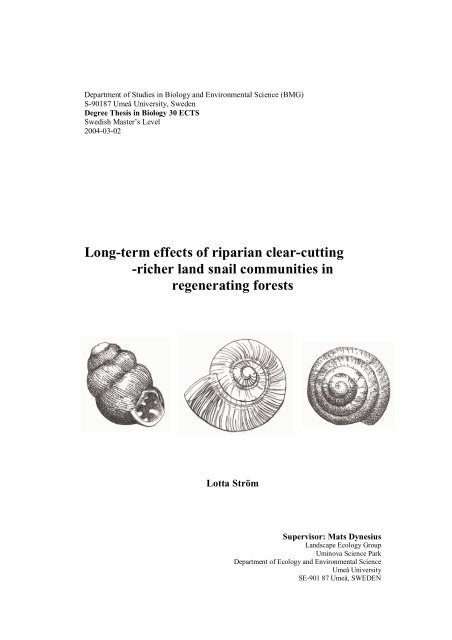
Department <strong>of</strong> Studies in Biology and Environmental Science (BMG)S-90187 Umeå University, SwedenDegree Thesis in Biology 30 ECTSSwedish Master’s Level2004-03-02<strong>Long</strong>-<strong>term</strong> <strong>effects</strong> <strong>of</strong> <strong>riparian</strong> <strong>clear</strong>-<strong>cutting</strong>-<strong>richer</strong> <strong>land</strong> <strong>snail</strong> communities inregenerating forestsLotta StrömSupervisor: Mats DynesiusLandscape Ecology GroupUminova Science ParkDepartment <strong>of</strong> Ecology and Environmental ScienceUmeå UniversitySE-901 87 Umeå, SWEDEN
IntroductionSince more than half <strong>of</strong> Sweden’s forests have been <strong>clear</strong>-cut after 1950, the interestin what happens to those ecosystems has increased. To maintain biological diversityand preserve threatened species it’s important to find out more about the ecologicalconsequences <strong>of</strong> <strong>clear</strong>-<strong>cutting</strong>. In Fennoscandia, the amount <strong>of</strong> information about<strong>effects</strong> <strong>of</strong> forestry on invertebrates have accumulated (Niemelä 1997), but few studieshave been published on litter-dwelling <strong>land</strong> <strong>snail</strong>s.All <strong>snail</strong>s belong to the phylum Mollusca and class Gastropoda which contains 60 000species. Primitively Gastropoda are marine animals (Barker 2001) but two subclassescontain groups that have independently invaded <strong>land</strong>, Pulmonata and Prosobranchia,together containing about 30 000 species (Abbot 1989, Kerney 1979). Pulmonates arefreshwater <strong>snail</strong>s and <strong>land</strong> <strong>snail</strong>s with a lung, four tentacles and a set <strong>of</strong> male andfemale sex organs in each individual (Abbot 1989). They represent the vast majority<strong>of</strong> <strong>land</strong> <strong>snail</strong>s and are the subclass that all <strong>land</strong> <strong>snail</strong>s in Sweden belong to. Theterrestrial <strong>snail</strong>s evolved from clades with coiled shells, but in some groups the shellshave been reduced (Barker 2001). Species lacking a shell are called slugs and are notincluded in this study. Most prosobranch <strong>snail</strong>s are marine, but some <strong>of</strong> them live on<strong>land</strong> (with main occurrence in Central America and the is<strong>land</strong>s <strong>of</strong> the Caribbean). Themost noticeable difference to the pulmonates is the operculum, a “door” on the tail,which they can close the shell with (Kerney 1979). They don’t have a lung, only twotentacles and usually separate sexes (Abbot 1989). A total <strong>of</strong> 113 <strong>land</strong> mollusc species(<strong>of</strong> which 21 are slugs) have been recorded in Sweden (Falkner et al. 2001). Themollusc fauna is poorer further north in the country. In the county <strong>of</strong> Jämt<strong>land</strong>, whichis situated in the middle <strong>of</strong> Sweden, 45 <strong>land</strong> <strong>snail</strong> species have been recorded duringan inventory <strong>of</strong> different habitats (Andersson 1996). In the <strong>riparian</strong> forests along smallstreams, partly in the same area, Göthner (2002) found 21 species. The county <strong>of</strong>Jämt<strong>land</strong> has calcareous areas, so the number <strong>of</strong> species is probably higher than forother areas at this latitude.In boreal forests <strong>land</strong> <strong>snail</strong> habitats include litter as well as trees. Most small specieslive permanently near the soil surface, but some <strong>of</strong> them sometimes climb up in thevegetation (Kerney et al. 1979). The litter dwelling species are decomposers,predominantly eating higher plant material but they are also specialised on asecondary substrate e.g. living plants, fungi or animal material (Mason 1970a). Therole <strong>of</strong> <strong>snail</strong>s as decomposers in a beech forest has been evaluated by Mason (1970b).The <strong>snail</strong>s only ingested a small part <strong>of</strong> the annual litter production, suggesting themto be <strong>of</strong> little direct importance in litter decomposition. However, they physically andchemically alter the litter, with a low assimilation and high faeces production, andhence promote fungal and microbial growth and decomposition. (Mason 1970b,Dallinger et al. 2001). The feeding fragments left <strong>of</strong> coarse plant material also providemore rapid access by microorganisms (Dallinger et al. 2001). Calcium is vital to the<strong>snail</strong>s for the shell construction. They are not dependent on lime in mineral form, butuse calcium present in organic compounds in vegetation and litter (Wäreborn 1969).Calcium is also important for the egg production; more calcium in combination withhigher pH can increase the <strong>snail</strong>’s reproductive output (Wäreborn 1979). Howeverdifferent species have varied requirements on calcium content in the food (Wäreborn1982). Several studies show that density and species richness correlates with amount<strong>of</strong> calcium and with the pH in the litter samples (Burch 1955, Waldén 1981,3
Gärdenfors 1992, Hotopp 2002). Close positive correlations have also been foundbetween the calcium content, pH and base saturation <strong>of</strong> the litter (Waldén et al. 1991),which makes it difficult to sort out which <strong>of</strong> the variables that are effecting the <strong>snail</strong>abundance most (Gärdenfors et al. 1996). Because <strong>of</strong> the requirement <strong>of</strong> calcium, soilacidification has a negative effect on <strong>snail</strong>s. The calcium is leached from the litter byacid rain, which causes a decrease in <strong>snail</strong> density (Waldén et al. 1991, Wäreborn1992, von Proschwitz 2001). This is a problem especially in nutrient poor coniferousforests and in the southern part <strong>of</strong> Sweden where the deposition is high. This problemhas also given rise to a new one. Most passerines depend on an intake <strong>of</strong> calcium inaddition to the normal food for eggshell production and skeletal growth and they use<strong>snail</strong> shells as the main calcium source. A large proportion <strong>of</strong> Great tits (Parusmajor), in forests with nutrient-poor soils in the Nether<strong>land</strong>s, produce eggs withdefective shells as a result <strong>of</strong> calcium deficiency (Grave<strong>land</strong> 1996 and Grav<strong>land</strong> andvanderWal 1996). Similar increases in eggshell defects have also been observed inGermany and Sweden (Grav<strong>land</strong> and vanderWal 1996). Considering the gastropodscentral position in terrestrial food chains they probably have a strong impact also onthe turnover <strong>of</strong> trace elements (Dallinger et al. 2001). The gastropods possess anexceptional affinity for certain trace elements such as copper, zinc, cadmium and lead.They may accelerate the metal cycling in the soil ecosystem, but also act asbiomineralization sinks and “buffers” for certain metals (Dallinger et al. 2001).Clear-<strong>cutting</strong> causes large changes in forest ecosystems affecting both abiotic andbiotic processes. The most evident changes occur at the ground surface, which bothobtain more light, larger temperature fluctuations and changed wind and moistureconditions. The ground water level elevates, but the top layer (a few cm thick) <strong>of</strong> thesoil dries out. The ground also gets compacted by heavy logging equipment(Lundmark 88, Fisher and Binkley 2000). After <strong>clear</strong>-<strong>cutting</strong> the pH <strong>of</strong> the humusincreases due to the ceased ion exchange that follows tree removal. On a longer timescale,the decomposition <strong>of</strong> logging residues also increases the pH (Lundmark 88,Fisher and Binkley 2000). A change in plant community structure with moredeciduous trees and herbs influences the litter quality.Snails are a group <strong>of</strong> invertebrates well known for their poor mobility, so they shouldnot be able to easily escape the changed local environment. Environmental factors,such as moisture, sun exposure, vegetation, litter calcium content and pH influencethe occurrence <strong>of</strong> <strong>land</strong> <strong>snail</strong>s (Wäreborn 1969, 1982). Their wet skin and method <strong>of</strong>moving, with loss <strong>of</strong> water through mucus, makes <strong>snail</strong>s restricted in their habitat bythe need to avoid drying up (Kerney et al. 1979). Except to finde moist places, theonly defence they have against dry conditions is to become inactive and retreat insidethe shell. Due to moisture conditions and partly also temperature, at least small <strong>snail</strong>sare more active at night than during the day (Boag 1985). Many species showaggregation behaviours (Mason 1970b, Baur and Baur 1988). Those might beexplained by an attraction <strong>of</strong> moist and local concentrations <strong>of</strong> food or by signals fromother <strong>snail</strong>s, such as pheromones in mucus trails (Baur and Baur 1988).A common view is that the poor dispersal ability <strong>of</strong> <strong>land</strong> <strong>snail</strong>s (Baur and Baur 1990),together with their dependence <strong>of</strong> stable microclimate, makes them sensitive tologging (Waldén 1998). von Proschwits (1998) argues that the need <strong>of</strong> a stabileenvironment makes many species good indicators <strong>of</strong> forest continuity.4
To test these hypotheses I compared the <strong>snail</strong> fauna in matched pairs <strong>of</strong> old forestsand young forests, regenerating after <strong>clear</strong>-<strong>cutting</strong> about 40-60 years ago. The studyplots were situated in the boreal region, in <strong>riparian</strong> forests along small streams.Materials and methodsStudy areaThe study was performed in ten localities in the northern part <strong>of</strong> Sweden, in thecounties <strong>of</strong> Västernorr<strong>land</strong>, Västerbotten and Norrbotten from 63° 42′to 65° 67′N(Fig. 1). The <strong>land</strong>scape has a bedrock that is mostly composed <strong>of</strong> acidic gneisses andgranites and the vegetation is dominated <strong>of</strong> Vaccinium myrtillus–type. The matureforest consists mainly <strong>of</strong> Norway spruce (Picea abies) and Scots pine (Pinussylvestris) with some deciduous elements such as birch (Betula pubescens and B.pendula), aspen (Populus tremula) and rowan (Sorbus aucuparia). In the <strong>riparian</strong>zones deciduous trees are more common and also include grey alder (Alnus incana)and willow (Salix sp.). The field layer has more deciduous shrubs, herbs andgraminoids than the up<strong>land</strong> areas.1. Herrbergsliden2. Långrumpskogen3. Blaikfjället södra4. Stenbitshöjden5. Brånaberget6. Lillberget7. Blaikfjället norra8. Buberget9. Hällbergsträsk10. SpjutbergetFigure 1. The ten localities in northern Sweden.6
ProductiveTheCompletelyA▪NoSimilar▪▪ ▪ ▪ ▪1mforest <strong>land</strong>, i.e. 3 trunk volume (above stump height) potentiallyproduced per ha and year, including the bark.stream must not have been directly affected by draining operations.≥In the surrounding <strong>land</strong>scape <strong>of</strong> each old forest plot a matched young forest plot werechosen by the criteria:<strong>clear</strong>-cut 40-60 years ago (no trees left).stream similar in size (catchment area) and slope to the old forest stream.drainage operationsto the old forest plot in topography, amount <strong>of</strong> rocks and boulders andproductivity.In the middle <strong>of</strong> each study plot a transect <strong>of</strong> 20 x 5-m was established across thestream (Figure 3). The transect was used in the <strong>snail</strong> sampling method, but also toestimate some <strong>of</strong> the environmental variables.5 m= sample20 mFigure 3. Transect across thestream with examples <strong>of</strong> how thelitter samples were collected.Environmental variablesThe slope from the stream to the edge <strong>of</strong> the transect was measured on both sidesusing a clinometer. The basal area <strong>of</strong> trees was measured from the middle <strong>of</strong> thetransect, using a relascope, for Norway spruce, Scots pine and deciduous treesrespectively. The following variables were estimated by eye, as percent cover <strong>of</strong> thetransect area (100 m 2 ): wet, moist, mesic and dry ground (Hägglund and Lundmark1981), boulders, deciduous and conifer shrubs less than 2 m high, herbs, graminoids,dwarf shrubs, peat mosses (Sphagnum spp), and other bryophytes. The aspect <strong>of</strong> slopewas taken from maps. The other environmental variables were collected by Dynesiuset al (2001). Altitude (m. a. s. l.) taken from maps, longitudinal slope (m/50m)measured using level and rod and a measuring tape and average channel width (m)measured at five places along a 50-m stretch. The transect used in this study wasplaced in the middle <strong>of</strong> each 50-m stretch.Snail samplingThe sampling method used to collect <strong>land</strong> <strong>snail</strong>s, was a modified version <strong>of</strong> the onedescribed by Valovirta (1996). It is a litter based semiquantitative method, where <strong>land</strong><strong>snail</strong>s are picked out from sieved litter. The litter was collected between July 14 th andAug 6 th 2002. The two plots <strong>of</strong> a pair were always sampled on the same day, theyoung forest plot first and the old about 3 hours later. Each sampling took less thenone hour. The 20 x 5-m transect was established across the stream in the middle <strong>of</strong>each study plot. Each transect was divided into 20 sample squares <strong>of</strong> 2 x 2.5 m (Fig8
3). From every other square four litter samples, each <strong>of</strong> 1.25 dm 2 , were collectedtotalling 0.5 m 2 from the entire transect. The samples were subjectively chosen amongmoister places, e.g. close to boulders, tree trunks or in cavities, to get as large number<strong>of</strong> <strong>snail</strong>s as possible. The litter from each 2 x 2.5 square was then sieved in 50 secondstrough a 4-mm mesh and mixed with the other 9 samples from the whole transect.Snail extractionAfter drying the litter in newspaper boxes at room temperature, the volume wasmeasured. From each site 1,5 l <strong>of</strong> the dried litter was passed trough a set <strong>of</strong> sieves(0.5, 1.0, 2.0, 4.0 mm), dividing it into four fractions. The <strong>snail</strong>s were extracted fromeach fraction by hand under a magnifying glass (2x) and then identified to speciesunder a dissecting microscope. The empty shells (i.e. those that had no living <strong>snail</strong>s atthe field sampling) were included in the study. The nomenclature follows Falkner etal. (2001). All young specimens <strong>of</strong> Coclicopa and Discus were treated as C. lubricaand D. ruderatus respectively, since they were the only adult species recorded <strong>of</strong> thesegenera. The three young specimens <strong>of</strong> Collumella were treated as C. aspera, as it wasthe only adult species <strong>of</strong> the genus in that site. The other young specimens that couldnot be satisfactorily identified (Vertiginidae, Vertigo and Euconulus) were notincluded in the analyses <strong>of</strong> the abundance <strong>of</strong> individual species. In analyses <strong>of</strong> number<strong>of</strong> species, they were included as a species when there were no other individual in thegroup that could be identified to species. Euconulus praticola is grouped together withE. trochiformis under the name E. praticola.Litter pHThe litter pH was de<strong>term</strong>ined using the method <strong>of</strong> Karltun (Internet publication).From each plot, the dried litter fractions, from which the <strong>snail</strong>s had been extracted,were mixed together. Two samples <strong>of</strong> 2g litter each where taken from each plot. Thesamples were put in 50-ml tubes and distilled water was added up to the 25-ml mark.After shaking the closed tubes, they were left over night. Next morning the sampleswere analysed with a calibrated pH-meter, Mettler toledo MX300. The samples weremeasured two times each to detect possible electrode drift. The average pH values <strong>of</strong>the two measurements <strong>of</strong> the two samples were calculated and used in the analyses.Data analysisMost analyses were performed using the statistical package SPSS (Norušis 1999).Abundance and species richnessIn the sampling method a specific litter amount from each plot is generally used, butin this study the total volume <strong>of</strong> sieved litter was higher in the old forests <strong>of</strong> all plotpairs. If the reason for this were that the litter from the old forest plots passed thesieve more easily due to the litter composition, it would be better to use an area-basedmethod. Therefore, besides the 1.5-l sub-samples, abundance and species richnesswere calculated for the total sample <strong>of</strong> each plot. The calculated abundance <strong>of</strong> theentire sample was calculated by multiplying the sub-sample <strong>snail</strong> density with totalvolume litter. To estimate species richness I started with a computer re-samplingprocedure in a spreadsheet. Individuals were randomly drawn from the distribution <strong>of</strong>species in the 1.5-l sub-sample. The number <strong>of</strong> species after sampling e.g. 10, 20, 50and 80 individuals were noted and average values from 200 simulations werecalculated. With the logarithmic values <strong>of</strong> individuals as independent and average9
number <strong>of</strong> species as dependent variable in an extrapolated linear regression, thespecies richness <strong>of</strong> the total sample could be calculated.To detect significant differences between the forest types in <strong>snail</strong> abundance andspecies richness t-tests were performed. Logarithmic values <strong>of</strong> abundance were usedin the analysis to meet the assumptions <strong>of</strong> a normal distribution.Environmental variablesThe environmental variables that are potentially affected by <strong>clear</strong>-<strong>cutting</strong> werecompared between stand age with a non-parametric test; Wilcoxon paired test. Meanvalues and standard deviation were calculated for all variables. For pH, two pairs <strong>of</strong>plots were excluded from this analysis. The young forest plot in Långrumpskogen hadmineral soil in the litter sample, which probably affected the pH value and would alsoaffect this result. Hällbergsträsk was excluded because <strong>of</strong> the bad pair matchregarding pH conditions. The old forest plot was placed on a more calcareous groundthan the young forest plot and would in a comparison between plots bias the result. Tosee if <strong>snail</strong> abundance or species richness correlated with any <strong>of</strong> the environmentalvariables, Spearman’s rank correlation tests were performed. The pH value from theyoung forest plot in Långrumpskogen was excluded in this analysis <strong>of</strong> the samereason as in the paired test. The old forest plot in Hällbergsträsk was used, as pH wascompared with <strong>snail</strong> variables and not other pH values.Species compositionThe change in species composition between old and young forests was analysed withpartial Redundancy Analysis (pRDA) in the statistical package CANOCO (ter Braakand Prentice 1988). This ordination method assumes linear relationships over theordination axes. Old or young forest was used as the constraining environmentalvariable assuming either a positive or negative species response to the variable. Thestudy design with paired plots made it possible to set the plot identities as covariables.This eliminates the variance between pairs and was done by making adummy variable for each plot. To test if species composition was significantlydifferent between old and young forests a permutation test was made in the pRDA.The null hypothesis <strong>of</strong> no influence <strong>of</strong> the constrained axes on the speciescomposition was evaluated with 2000 permutations. The test was performed both withspecimens found in 1.5l and the calculated number <strong>of</strong> specimens in the total samples.SpeciesThe difference in abundance <strong>of</strong> individual species between old and young plots wastested using Wilcoxon´s non-parametric paired test. The mean values and standarddeviations <strong>of</strong> each species were calculated. In these analyses number <strong>of</strong> replicatesvaried among species. Only localities where the specific species had been recorded inat least one <strong>of</strong> the plots were included in the analyses.With the pRDA analysis it is possible to see for each species the bias in occurrencetowards old or young forests. Each species get a position along the axis <strong>of</strong> theconstraining environmental variable, where a strong positive or negative valuerepresents a combination <strong>of</strong> abundance and frequency that is higher in one <strong>of</strong> theforest types and a value around zero indicates no larger difference.10
ResultsCommunity levelIn total 1 896 shells belonging to 16 <strong>snail</strong> species were found in the 20 1.5l littersamples. The number <strong>of</strong> species per sample ranged from 2 to 14 and the abundanceranged from 6 to 344 individuals. The old forest plots had a total number <strong>of</strong> 556 shells<strong>of</strong> 14 species in 1,5-l litter, with a range <strong>of</strong> 6 to 139 shells and 2 to 10 species. Theyoung plots had 1 340 shells <strong>of</strong> 15 species. The number <strong>of</strong> shells ranged from 25 to344 and the number <strong>of</strong> species from 3 to14 (Table 2).AbundanceIn the 1.5-l litter samples young forest plots had more individuals in 9 <strong>of</strong> 10 pairs(Table 2). The average abundance was more then twice as high in the young plots,134 shells in the young plots and 55.6 in the old plots. The total volumes <strong>of</strong> sievedlitter from each transect varied a lot. The largest difference in a pair was 1.2 l and itwas always the old forests that had the larger volume. Still the use <strong>of</strong> calculatednumbers <strong>of</strong> individuals in the total sample did not change the qualitative result much.The exception was Herrbergsliden that obtained a slightly higher abundance in the oldforest plot than in the young, compared to the number in 1.5 l that was higher in theyoung forest plot. In the paired tests <strong>of</strong> difference between old and young forest plots,significantly higher <strong>snail</strong> abundance was found in the young forests, both for the 1.5-lsub-sample and for the calculated abundance in the total sample (Table 3).Table 2. Litter volume <strong>of</strong> the total sample, <strong>snail</strong> abundance and number <strong>of</strong> species in each <strong>of</strong> the plots.O = old forest plots, Y = young forest plots.Volume littertotal sample(l)Abundance1.5 lAbundancetotal sample aNo. <strong>of</strong>species1.5 lNo. <strong>of</strong>speciestotal sample aLocalities O Y O Y O Y O Y O YHerrbergsliden 3.60 2.85 119 149 286 283 10 9 11.2 9.39Långrumpskogen 3.20 2.90 6 25 12.8 48.3 3 3 3.28 3.00Blaikfjället södra 2.75 1.55 25 104 45.8 107 5 11 5.33 10.8Stenbitshöjden 2.20 1.95 21 157 30.8 204 4 11 4.46 11.7Brånaberget 3.05 2.40 96 225 195 360 9 11 11.0 12.4Lillberget 2.90 2.05 139 61 269 83.4 10 7 11.1 7.79Blaikfjället norra 2.65 1.75 31 344 54.8 401 6 14 5.62 15.1Buberget 3.75 2.60 28 56 70.0 97.1 7 8 7.75 8.22Hällbergsträsk 3.90 3.80 79 107 205 271 8 11 9.38 13.3Spjutberget 3.85 2.95 12 112 30.8 220 2 11 2.30 12.1a Calculated from the data from 1.5 l and the total amount <strong>of</strong> litter in the sample.Species richnessA significant difference between old and young forest plots was found in the speciesrichness in 1.5 l, while the calculated number <strong>of</strong> species in the entire sample was closeto significant, p = 0.055 (Table 3). In 7 out <strong>of</strong> the 10 pairs, higher species richnesswas found in the young plots (1.5-l samples, table 2). Of the other three pairs, one hadthe same number <strong>of</strong> species and two pairs had higher richness in the old forest plots.In the calculated species richness the pair with three species each, Långrumpskogen,got a slightly higher number <strong>of</strong> species in the old forest plot than in the young. Inaverage there was about 3 more species in the young forest plots, 9.6 species in theyoung plots and 6.4 species in the old plots.11
Environmental variablesSome <strong>of</strong> the measured environmental variables that may be affected by <strong>clear</strong>-<strong>cutting</strong>differed significantly between old and young forests (Table 3). Basal area <strong>of</strong> spruce,total basal area <strong>of</strong> all trees and coverage <strong>of</strong> Sphagnum were all higher in the old plots.Both pH and coverage <strong>of</strong> graminoids were significantly higher in the young plots.Table 3. Means and standard deviation <strong>of</strong> <strong>snail</strong> abundance, species richness and environmentalvariables (potentially affected by <strong>clear</strong>-cut) in old and young plots. Bold text indicates statisticallysignificant difference between forest types (Snail abundance and species richness paired t-test,environmental variables Wilcoxon´s paired test). N = 10 except for pH where N = 8.Snail and environmental bOld forest plots Young forest plotsvariables Mean S. D. Mean S. D. PAbundance 1.5 l 55.6 48.3 134 93.4 0.009Ab. Calculated a 120 107 208 122 0.033Species number 1.5 l 6.40 2.88 9.60 3.03 0.036Sp. number Calculated a 7.14 3.39 10.4 3.44 0.055Litter pH 4.71 0.21 4.99 0.23 0.025Dry ground (%) 1.00 3.16 1.00 3.16 1.000Mesic ground (%) 55.0 30.2 60.0 27.6 0.511Moist ground (%) 22.0 24.7 24.0 16.1 0.812Wet ground (%) 22.0 23.9 15.0 22.1 0.446Spruce (m 2 /ha) 14.5 7.85 5.20 3.05 0.007Pine (m 2 /ha) 2.00 2.84 1.15 1.75 0.598Deciduous trees (m 2 /ha) 3.40 2.90 4.15 3.87 0.767Trees total (m 2 /ha) 19.9 7.52 10.5 4.93 0.005Conifer shrubs (%) 2.70 3.43 4.00 5.68 0.750Deciduous shrubs (%) 10.0 8.50 17.0 21.4 0.478Herbs (%) 24.0 15.8 32.0 20.4 0.113Graminoids (%) 23.0 18.7 38.0 20.3 0.050Dwarf shrubs (%) 31.5 21.1 26.5 19.6 0.258Sphagnum spp. (%) 33.0 25.9 12.5 15.9 0.046Other bryophytes (%) 27.5 26.6 40.0 22.1 0.140a Calculated from the data from 1.5 l and the total amount <strong>of</strong> litter in the sample.b Percentages are cover <strong>of</strong> the 100 m 2 transect and the trees are given in basal area.Correlations between environmental variables and the <strong>snail</strong> variables showed a fewstatistically significant results but these had high correlation coefficients (Table 4,figure 4). In the old forest <strong>snail</strong> parameters had positive correlations with percentagemoist ground. Calculated abundance also correlated with pH in the old plots but not asstrongly. The <strong>snail</strong> abundance in 1.5 l were almost significantly correlated with pH, p= 0.0537. The young forest plots had significant positive correlations between all four<strong>snail</strong> parameters and pH. The abundance variables were strongest correlated with pH.The calculated number <strong>of</strong> species was negatively correlated with basal area <strong>of</strong> spruce.Species compositionThe partial redundancy analysis (pRDA) revealed a significant (p = 0.027) differencein species composition between old and young forests. When the specimens found inthe 1.5-l sub-sample was used the forest types could account for 20.4 % <strong>of</strong> thedifference in the data. When the calculated number <strong>of</strong> specimens in the total sampleswas used the stand age could explain 11.2 % <strong>of</strong> the difference (p = 0.044).12
Table 4. Spearman’s rank correlation coefficients between environmental variables and the <strong>snail</strong>parameters. Figures in bold indicate statistically significant correlations, ** p < 0.01 and * 0.01 < p >0.05. O = old forest plots, Y = young forest plots. N = 10 except for pH in young forests where N = 9.Abundance1.5 lAbundancetotal sample aNo. <strong>of</strong> Species1.5 lNo. <strong>of</strong> Speciestotal sample aEnvironmental b variables O Y O Y O Y O YLitter pH 0.62 0.95** 0.65* 0.93** 0.57 0.68* 0.58 0.70*Lateral slope (degrees) -0.61 0.27 -0.51 0.10 -0.54 0.10 -0.52 -0.02Boulders (%) -0.17 0.16 -0.05 0.33 -0.17 0.01 -0.15 0.15Dry ground (%) -0.06 -0.41 0.06 -0.29 0.06 -0.31 0.06 -0.29Mesic ground (%) -0.30 0.26 -0.21 0.24 -0.35 0.12 -0.35 0.16Moist ground (%) 0.94** -0.47 0.91** -0.47 0.89** -0.39 0.89** -0.43Wet ground (%) -0.35 0.14 -0.44 0.05 -0.31 0.04 -0.31 -0.01Spruce (m 2 /ha) 0.13 -0.34 0.05 -0.46 0.20 -0.48 0.24 -0.64*Pine (m 2 /ha) -0.53 -0.32 -0.37 -0.29 -0.45 -0.35 -0.45 -0.26Deciduous trees (m 2 /ha) -0.12 0.16 -0.07 0.19 -0.09 -0.12 -0.12 -0.05Trees total (m 2 /ha) 0.03 -0.19 0.02 -0.27 0.11 -0.54 0.14 -0.55Conifer shrubs (%) -0.09 0.25 0.03 0.05 0.00 0.15 -0.03 0.12Deciduous shrubs (%) 0.08 0.25 0.15 0.28 0.11 0.62 0.11 0.58Herbs (%) 0.27 0.42 0.21 0.31 0.28 0.08 0.31 -0.01Graminoids (%) 0.06 -0.42 0.01 -0.48 -0.03 -0.18 -0.08 -0.12Dwarf shrubs (%) -0.02 0.17 0.05 0.33 -0.04 0.43 -0.02 0.46Sphagnum spp. (%) -0.05 -0.01 -0.25 0.01 -0.08 0.18 -0.13 0.16Other bryophytes (%) -0.04 -0.31 0.09 -0.42 -0.05 -0.12 -0.04 -0.24a Calculated from the data from 1.5 l and the total amount <strong>of</strong> litter in the sample.b Percentages are cover <strong>of</strong> the 100 m 2 transect and the trees are given in basal area.20.015.010.05.00.04 4.5 5 5.5Litter pH50040030020010004 4.5 5 5.5Litter pHOldYoungReg. OldReg. Young20.015.010.05.00.00 20 40 60 80Moist ground cover %50040030020010000 20 40 60 80Moist ground cover %20.015.010.05.00.00 10 20 30Basal area <strong>of</strong> spruceFigure 4. Selected correlations between <strong>snail</strong> andenvironmental variables. Only data calculated for thetotal sample was used. Statistically significantcorrelations are shown with a linear regression (excel).Left plots: correlations between calculated speciesrichness and pH (R 2 = 0.56 young), percentage moistground (R 2 = 0.53 old) and with basal area <strong>of</strong> spruce (R 2 =0.50 young). Right plots: correlations between calculatedabundance and pH (R 2 = 0.22 old, 0.90 young) and withpercentage moist ground (R 2 = 0.73 old).13
Species levelOf the 16 species found, 14 species had a higher abundance in the young forest plotsin the 1.5-l sub-samples. There were 6 species with statistically significant differencesin abundance between old and young forest plots, all <strong>of</strong> them were more abundant inthe young plots: Cochlicopa lubrica, Euconulus fulvus, Nesovitrea hammonis,Punctum pygmaeum, Vitrina pellucida and Zoogenetes harpa (Table 5). Mostsignificant (p = 0.007) was the difference <strong>of</strong> E. fulvus, which were found in all 20plots and was also the most abundant species in both old and young forests(13.6/33.8). In the same test <strong>of</strong> E. fulvus, but with abundance calculated for the totalsample, the difference was still significant but not as strongly (p = 0.028). Mostevident was the difference <strong>of</strong> C. lubrica, which had a ratio <strong>of</strong> 31.5 (Table 5). P.pygmaeum had almost three times higher mean abundance in the young forest plots(ratio 2.78) but the standard deviation was very large. Four species were found in atleast one <strong>of</strong> the pairs in all ten localities; Discus ruderatus, Euconulus fulvus,Nesovitrea hammonis and Punctum pygmaeum. Two species were only found in theyoung forests, Vertigo lilljeborgi and Zoogenetes harpa, and one species Clauciliacruciata were only found in two old forests. Vertigo ronnebyensis was also foundwith more individuals in the old plots.Table 5. The mean species abundance in 1.5-l litter samples from old and young plots. F = frequency,number <strong>of</strong> plots where the different species were encountered. Bold names and letters indicate specieswith statistically significant differences (Wilcoxon´s test).Old forest plotsYoung forest plotsSpeciesMean aMean aRatioF (Range) S. D. F (Range) S. D. Y/O p bClausilia cruciata 2 2.00 (1-3) 1.41 0 0 (0-0) 0 0Cochlicopa lubrica 2 0.22 (0-1) 0.44 7 7.00 (0-28) 11.1 31.5 0.036Columella aspera 4 2.38 (0-12) 4.24 6 4.13 (0-12) 5.00 1.74 0.206Columella edentula 4 3.57 (0-16) 5.88 5 8.14 (0-36) 12.6 2.28 0.735Discus ruderatus 5 3.10 (0-12) 4.65 8 7.80 (0-23) 6.55 2.52 0.113Euconulus praticola 2 0.71 (0-4) 1.50 7 1.86 (1-4) 1.21 2.60 0.084Euconulus fulvus 10 13.6 (3-36) 10.3 10 33.8 (11-52) 14.0 2.49 0.007Nesovitrea hammonis 9 6.10 (0-20) 6.14 10 13.0 (1-22) 6.09 2.13 0.032Nesovitrea petronella 7 8.44 (0-28) 9.29 9 12.0 (2-28) 8.73 1.42 0.407Punctum pygmaeum 6 10.3 (0-33) 12.7 10 28.6 (1-68) 26.8 2.78 0.047Vertigo lilljeborgi 0 0 (0-0) 1 3.00 (3-3)Vertigo modesta arctica 1 0.50 (0-1) 0.71 2 6.50 (3-10) 4.95 13.0Vertigo ronnebyensis 7 5.00 (0-13) 4.87 4 2.75 (0-13) 4.53 0.55 0.325Vertigo substriata 1 3.60 (0-18) 8.05 5 7.80 (1-22) 8.35 2.17 0.345Vitrina pellucida 4 1.00 (0-3) 1.10 6 6.50 (3-11) 2.66 6.50 0.026Zoogenetes harpa 0 0 (0-0) 0 6 4.50 (2-8) 2.59 0.027a Means are calculated from the pairs where the species have been recorded in at least one <strong>of</strong> the plots.b The p values <strong>of</strong> species found in fewer than 3 plot pairs are not displayed. Remaining values have Nbetween 5 and 10.Species scores from the pRDA confirmed that the two species, Vertigo ronnebyensisand Claucilia cruciata, were the only species on the negative side <strong>of</strong> the axis (higherabundance combined with frequency in old forests) while the rest were on the positive(higher values in young forests). The species with scores around zero had about thesame presence in both forest types (Figure 5). Most favoured by young forests werethe same species that had significant differences in the paired test, but also Discusruderatus had high scores.14
0.800.600.400.200.00-0.20* * * * * *1.5lTotal sample-0.40E. fulvusZ. harpaV. pellucidaC. lubricaD. ruderatusP. pygmaeumN. hammonisV. modestaE. praticolaV. lilljeborgiC. edentulaV. substriataC. asperaN. petronellaV. ronnebyensisC. cruciataFigure 5. Species scores from the partial redundancy analysis (pRDA). The scores are calculated bothfrom specimens found in the 1.5-l sub-samples and from the calculated number <strong>of</strong> specimens in thetotal sample. Species that have significant differences in abundance between the stand ages(Wilcoxon´s paired test, table 5) are denoted *.DiscussionThe results showed a difference in abundance, species numbers and speciescomposition <strong>of</strong> litter dwelling <strong>land</strong> <strong>snail</strong>s between old and regenerating small streamforests. According to my hypothesis most species had higher abundance in youngforests, which indicates that populations do grow after the initial reduction after <strong>clear</strong><strong>cutting</strong>.However, different species reacted differently. Why are <strong>land</strong> <strong>snail</strong>s moreabundant and species rich in young forests?Community levelAbundanceMoisture, sun exposure, vegetation, calcium content and pH influence the occurrence<strong>of</strong> <strong>land</strong> <strong>snail</strong>s (Wäreborn 1969, 1982). The abundance in the young plots correlatedvery well with litter pH (r = 0.93, calculated abundance in the total sample), whichshows that pH is important for the abundance in these areas (Table 4, figure 4).However, it is not <strong>clear</strong> to what extent pH has a positive effect on <strong>snail</strong>s. Severalstudies show that density and species richness correlates both with amount <strong>of</strong> calciumand with the litter pH (Burch 1955, Waldén 1981, Gärdenfors 1992, Hotopp 2002).Close positive correlations have also been found between the calcium content, pH andbase saturation <strong>of</strong> the litter (Waldén et al. 1991), which makes it difficult to sort outwhich <strong>of</strong> the variables that are effecting the <strong>snail</strong> abundance most (Gärdenfors et al.1996). In some studies pH have been used as a substitute for the complex <strong>of</strong> calcium,pH and base saturation (Waldén 1981). Wäreborn (1979) has studied pH and calcium15
<strong>effects</strong> on the reproduction separately. An increase <strong>of</strong> pH increased the <strong>snail</strong>reproduction, but addition <strong>of</strong> calcium had a larger positive influence.The old plots also had a significant correlation between calculated abundance in totalsample and pH (r = 0.65), but a stronger correlation with cover <strong>of</strong> moist ground (r =0.91). As the <strong>snail</strong> abundance is dependent <strong>of</strong> litter pH (Figure 4), and pH (but notcover <strong>of</strong> moist ground) significantly differs between the stand ages (Table 3), it islikely that this difference is the main cause for the difference in <strong>snail</strong> abundancebetween old and young forests. A more accurate measuring method is used <strong>of</strong> litterpH compared to the visual estimations <strong>of</strong> ground moisture, but it is <strong>clear</strong> that both <strong>of</strong>these variables are very important in boreal regionsSpecies richnessThe results for species richness were very similar to those for abundance patterns.Species richness in young forest plots correlated significantly with litter pH (r = 0.7)and in the old forest plots with moist ground (r = 0.89). Species richness in the oldforests did not correlate significantly with pH but the trend was positive (Table 4,figure 4). Young forests have in general high pH due to decomposition <strong>of</strong> loggingresidues, more herbs and deciduous trees and shrubs, which also is good food for most<strong>snail</strong>s. They also have fewer trees, especially spruce, which decrease the soil pH withion exchange as they grow and the litter pH with the dropped needles. In this study theold forests had both significantly higher basal area <strong>of</strong> trees in total and <strong>of</strong> spruce(Table 3). The calculated species richness in young forests had a significant negativecorrelation with the basal area <strong>of</strong> spruce (r = -0.64). In a regression the basal area <strong>of</strong>spruce accounted for 50 % <strong>of</strong> the variation in species richness in young forests.Other environmental variablesAnother significant difference between the forest ages was cover <strong>of</strong> graminoids. Theyincrease in disturbed areas and produce a lot <strong>of</strong> root-litter that aerates the top soil layer(Lundmark 1986:1) and this might create a better habitat for the <strong>snail</strong>s. However, thisis not supported by my results. Even though there was variations in graminoid cover,there were no correlations to the <strong>snail</strong> variables. Litter from deciduous trees isimportant to gastropods. In the boreal forest <strong>land</strong>scape correlations between <strong>snail</strong>s anddeciduous trees have been recorded (Göthner 2002) and aspen is especially importantto <strong>snail</strong> species richness and diversity (Suominen 2002). I did not find any significantdifferences or correlations in deciduous trees, probably because <strong>of</strong> the low numbers inall plots. It may also be difficult to assess the amount <strong>of</strong> deciduous leaves in the litterfrom the measurements <strong>of</strong> basal area and estimates <strong>of</strong> cover <strong>of</strong> shrubs.Species levelThe species Columella aspera and Vertigo ronnebyensis are described in the literatureas preferring old spruce or mixed forests and comparatively low litter pH (VonProschwitz 1993). They are both associated with Vaccinium spp., on which they are<strong>of</strong>ten found feeding. Hy<strong>land</strong>er et al. (in press) found a significant decrease <strong>of</strong> C.aspera initially after <strong>clear</strong> <strong>cutting</strong>, but I found more specimens <strong>of</strong> C. aspera in theyoung plots (19/33). In this study the only species with higher abundance in old forestplots was Vertigo ronnebyensis and Claucilia cruciata.C. cruciata was only recorded in two old forests and only with four specimens, whichmakes it impossible to evaluate the long <strong>term</strong> <strong>clear</strong>-<strong>cutting</strong> <strong>effects</strong> on that species.16
պ*պ*պ*andHy<strong>land</strong>er et al. (in press) found a significant decrease initially after <strong>clear</strong>-cut (Table 6)as they found it on 5 sites before but not on any sites after. In Sweden C. cruciata isconfined to the northern part and is <strong>of</strong>ten found in old, moist and shady spruce ormixed forests (Ehnström and Waldén 1986). V. ronnebyensis was found in more oldforest plots (7/4) and with almost twice as many specimens in the old forest plots(40/22). However no significant difference in abundance was detected, because two <strong>of</strong>the eight pairs had the opposite result. From the pRDA V. ronnebyensis got a negativevalue, which shows that the combination <strong>of</strong> abundance and frequency indicates apreference <strong>of</strong> the old forests (Figure 5). According to the Swedish Red List,(Gärdenfors 2002) Vertigo ronnebyensis is classified as nearly threatened (NT) due toits habitat choice <strong>of</strong> old spruce-forests and possible sensitivity to <strong>clear</strong>-<strong>cutting</strong>.Hy<strong>land</strong>er et al. (in press) did not find any significant difference in abundance <strong>of</strong> V.ronnebyensis before and initially after <strong>clear</strong>-<strong>cutting</strong> (Table 6) but a significantdecrease in number <strong>of</strong> sites where it was encountered, from 13 to 5.Zoogenetes harpa is another species that <strong>of</strong>ten is found climbing in Vaccinium-shrubs(Gärdenfors et al. 1988). Waldén (1998) argued that forest management probablyreduces Z. harpa abundance but he did not find enough specimens to support that. Inthis study, Z. harpa instead showed a significant difference in abundance as 27individuals were found in 6 young forest plots and no one in the old. This result alsogave a <strong>clear</strong> positive score in the pRDA, indicating young forests as a quality habitatto Z. harpa. Although most <strong>of</strong> the individuals could have been climbing in theVaccinium-shrubs, there was no significant difference in dwarf shrub-cover betweenthe old and young forest plots. Hy<strong>land</strong>er et al. (in press) did not find enoughspecimens to evaluate Z. harpa.SpeciesInitialresponse<strong>Long</strong>-<strong>term</strong>responseClausilia cruciata ռ*Vertigo ronnebyensisEuconulus praticolaPunctum pygmaeumVertigo lilljeborgiVertigo substriataVitrina pellucidaCochlicopa lubricaColumella aspera ռ*Columella edentula ռ**Discus ruderatus ռ**Euconulus fulvus ռ* պ**Nesovitrea hammonis ռ* պ*Nesovitrea petronella ռ**Zoogenetes harpaVertigo modesta arctica Not foundպ ռTable 6. Summary <strong>of</strong> species abundancedifferences. From Hy<strong>land</strong>er et al. (in press)an increased abundance initially after<strong>clear</strong>-<strong>cutting</strong> is denoted պ, a decreasedand no difference պռ. Higher abundance inthe young forest plots compared to the oldis denoted lower abundance (long<strong>term</strong>response). The tests <strong>of</strong> differenceswas performed with Wilcoxon singed ranktest and the levels <strong>of</strong> significance are ** p< 0.01 and * 0.01 < p > 0.05. N =10, inHy<strong>land</strong>er et al. N =15.ռ պ ռCochlicopa lubrica had the highest ratio <strong>of</strong> all species (31.5, table 5) with thesignificant higher abundance in the young plots. It was found in 2 old forest plots andin 7 young forest plots. Two years after <strong>clear</strong>-<strong>cutting</strong> it had decreased, but notsignificantly (Table 6) and was found in one site less (7/8). Vitrina pellucida had alsoa high ratio (6.50). It both increased in abundance two years after <strong>clear</strong>-cut and had asignificantly higher abundance in the young plots. The initial <strong>effects</strong> on Euconulusfulvus and Nesovitrea hammonis were significant decreases (Hy<strong>land</strong>er et al. in press),but they also showed a significantly higher abundance in my young plots (Table 6).17ռ պ*
They had both high frequencies, E. fulvus was found in all plots in both studies. Someother species that showed a significant initial decrease was e.g. Columella edentula,Discus ruderatus and Nesovitrea petronella. In this study they all had higherabundance in the young forest plots, but they did not differ significantly. Punctumpygmaeum also had significantly higher abundance in my young plots but it wasrather indifferent initially after <strong>clear</strong>-<strong>cutting</strong> as it showed an increase in abundance butwas encountered in 2 sites less then before (14 to 12).Many <strong>of</strong> the <strong>snail</strong>-species decreased in abundance initially after <strong>clear</strong>-cuts (Hy<strong>land</strong>eret al. in press). If this is a general pattern it seems like most <strong>of</strong> them survive or recoloniseand later increase their populations compared to before the <strong>clear</strong>-<strong>cutting</strong>. Sodespite the problem with surviving the first environment change <strong>of</strong> <strong>clear</strong> cut, myresult show that <strong>snail</strong>s are more abundant in the regenerating forest, with theexceptions <strong>of</strong> V. ronnebyensis and probably C. cruciata.Scale issuesIn a review article about invertebrates and boreal forest management, Niemelä (1997)concluded that on a small scale, managed forests are not necessarily less species richthan old growth forests but that certain specialist species <strong>of</strong> old growth forests still donot survive in the managed forests. Intensive large-scale forestry seems to decreasediversity at <strong>land</strong>scape and bio-geographical scales. More species were found in theyoung plots in 7 <strong>of</strong> 10 pairs, which shows that on the scale <strong>of</strong> this study, young<strong>riparian</strong> forests are more species rich than old forests. This result is not possible toextrapolate to a larger <strong>land</strong>scape scale due to the small samples. Even though a certainspecies was not found in the sample it can be present at the site, especially when thenumbers are low.In boreal <strong>riparian</strong> forests there are <strong>of</strong>ten large differences in abundance <strong>of</strong> individual<strong>land</strong> <strong>snail</strong> species and the variations are positively correlated with severalenvironmental variables, such as pH, deciduous trees and moist ground (Hy<strong>land</strong>er etal. unpublished). Thus, most species are favoured by a good quality habitat, and insuch sites even the most specialised species can build up a viable population(Hy<strong>land</strong>er et al. unpublished). In my study number <strong>of</strong> species seems to depend on thenumber <strong>of</strong> specimens (Figure 6) and the curves <strong>of</strong> old and young plots are similar. Ifall <strong>snail</strong>s from the different forest types are summarised there are totally only onespecies more found in the young forest plots (14/15). Still for species like Vertigoronnebyensis (Hy<strong>land</strong>er et al. unpublished, Waldén 1998) it may be important thatareas <strong>of</strong> old spruce forests remains, even though it was found in some regeneratingforests.20.0Species15.010.05.00.00 200 400 600SpecimensOldYoungLog. OldLog. YoungFigure 6. The relation betweennumber <strong>of</strong> species and number <strong>of</strong>specimens in all 20 plots.18
Survival, dispersal and population reboundAccording to Hy<strong>land</strong>er et al. (in press) abundance and number <strong>of</strong> <strong>snail</strong> species wereunaffected in wet <strong>clear</strong>-cut sites where the bryophytes survived in a high proportionand protected the underlying litter from direct sunlight. The wet forests acted asrefugia. The <strong>land</strong> <strong>snail</strong>s have aggregation behaviours to e.g. moisture and temperature(Mason 1970, Baur and Baur 1988) and <strong>riparian</strong> forests should have a higher number<strong>of</strong> moist micro-refugia compared with non-<strong>riparian</strong> forests, increasing the survival <strong>of</strong>the <strong>snail</strong>s. Another factor that increases the survival <strong>of</strong> <strong>land</strong> <strong>snail</strong>s is buffer stripsalong the streams at <strong>clear</strong>-cut sites. Buffers <strong>of</strong> 10-m help the survival, but are toonarrow to retain an unaffected <strong>snail</strong> community (Hy<strong>land</strong>er et al. in press). Thedifference in moisture may be one <strong>of</strong> the reasons for different opinions about if <strong>land</strong><strong>snail</strong>s in general are sensitive to <strong>clear</strong>-<strong>cutting</strong>.Shikov (1984) also argues that micro refugia permits survival <strong>of</strong> small isolatedpopulations while a secondary deciduous forest with more favourable conditions forthe <strong>land</strong> molluscs establishes. Shikov (1984) suggests that <strong>clear</strong>-<strong>cutting</strong> <strong>of</strong> primaryconiferous forests have little effect on the diversity <strong>of</strong> the mollusc-fauna. The density<strong>of</strong> most molluscan species increases, but a few species adapted to life in the litterlayers <strong>of</strong> coniferous forests are reduced in abundance. Unfortunately no data ispresented in the paperStrayer et al. (1986) claims that distance to older forests is important. They suggestedthat in their study the gastropod communities rapidly recovered from forestdisturbance because <strong>of</strong> the small areas <strong>of</strong> disturbed sites and a rapid recovery <strong>of</strong> thevegetation, which would help a re-colonisation. They found no <strong>clear</strong> relationshipbetween time elapsed since disturbance (2->60 years) and <strong>snail</strong> density, speciesrichness or composition <strong>of</strong> gastropod community, only depressed densities andspecies richness in stands
OnTheTheMostThey▪ ▪ ▪Vertigo▪ ▪ ▪since the samples in a pair where collected the same day. When the litter quality is <strong>of</strong>various kinds and an area based method is wanted, number <strong>of</strong> species and specimensshould be extracted from the total amount <strong>of</strong> sieved litter. I used 1,5-l litter from eachplot, so the number <strong>of</strong> <strong>snail</strong>s from the old forest plots may be underestimated. Tryingto avoid this problem the abundance and species richness was extrapolated to the totalsample for each plot. However, there was no qualitative difference between the results<strong>of</strong> extracted and extrapolated values.The abundance <strong>of</strong> all species in the total sample was calculated by multiplying thesub-sample <strong>snail</strong> density with total volume litter. The same method was used tocalculate abundance <strong>of</strong> each species in the total samples, and these values were usedin the pRDA (Figure 5). The results from the 1.5-l sub-samples tend to indicate a toohigh abundance in young forests compared to old forests, as the total litter sample inold forests was higher. When the calculated values <strong>of</strong> the total samples are used allspecies show a lower abundance in young forests, which should be a more area basedresult. However, it is not completely correct. Only Euconulus fulvus was found in allplots. When a species was not found in a sub-sample, the number <strong>of</strong> specimensremained zero in the total sample and the abundance was underestimated. Since thereare more zeroes from old forest plots than from young (96/64), the result may stillhave a slight bias towards higher abundances in the young forest. Summarising thecalculated abundance <strong>of</strong> each individual species in the old forest plots and comparingit with calculated total abundance <strong>of</strong> all <strong>land</strong> <strong>snail</strong>s in the old forest plots, 6.0 % (68.3specimens) are missing due to the zeroes. In the young forest plots 6.2 % (120.5specimens) are missing. The pRDA scores are based on both abundance andfrequency and with more individuals included some species would also appear inmore plots. If mean species richness is compared between the 1.5-l sub-samples andthe calculated total samples, old forest plots would increase with 11.6 % (0.74species) and young plots with 8.3 % (0.8 species). Thus, the error is probably notaffecting the species scores much, especially not the more abundant species.Conclusionsthe scale <strong>of</strong> this study regenerating <strong>riparian</strong> forests, 40 to 60 years after <strong>clear</strong><strong>cutting</strong>,have a higher abundance <strong>of</strong> <strong>land</strong> nails and are more species rich than oldforests <strong>of</strong> at least 150 years.higher abundance and species richness are mainly associated with the higherlitter pH in young forests.species composition is different between the old and young forests.species are favoured by the habitat quality in regenerating <strong>riparian</strong> forests.have a higher abundance in the regenerating forests than in the old, eventhough many <strong>of</strong> them decrease initially after <strong>clear</strong>-<strong>cutting</strong> <strong>of</strong> <strong>riparian</strong> forests(Hy<strong>land</strong>er et al. in press).ronnebyensis is more abundant in old <strong>riparian</strong> forests, but not with asignificant difference.Future studiesWith a higher number <strong>of</strong> pairs the result would probably give more straight answersabout how the different species react to <strong>clear</strong>-<strong>cutting</strong>. More species would showsignificant differences between stand ages, but it would also be <strong>clear</strong> which speciesthat are indifferent. To understand the mechanisms that create the results experiments20
have to be performed. How is pH and calcium affecting <strong>snail</strong>s separately, and how isground moisture affecting the <strong>snail</strong> community?It would be interesting to do a similar study in non-<strong>riparian</strong> areas, to find out to whatextent <strong>land</strong> <strong>snail</strong>s re-establish after <strong>clear</strong>-<strong>cutting</strong> there? What does the non-<strong>riparian</strong>species composition look like after <strong>clear</strong>-<strong>cutting</strong> compared to matching old areas andthese <strong>riparian</strong> <strong>clear</strong>-cuts? Are other environmental variables important there? Are theinitial survival smaller due to less moist micro-refugia and how do this affect the reestablishmentduring a longer time period?To know how the size <strong>of</strong> <strong>clear</strong>-cuts and environmental variables affects the reestablishment<strong>of</strong> <strong>snail</strong>s and other litter dwelling invertebrates, would be an importanthelp to maintain biological diversity and preserve threatened species.AcknowledgementsFirst I would like to thank my supervisor Mats Dynesius for guiding me in my writingand in my train <strong>of</strong> thoughts, for ideas, patience and support. I want to thank Krist<strong>of</strong>ferHy<strong>land</strong>er who also has acted as a supervisor, for helping me with statistics andreferences and having the time and patience to answer all kinds <strong>of</strong> questions. EvaHy<strong>land</strong>er, for introducing me to these beautiful animals and checking my attempt <strong>of</strong>identification. My dear friend Kicki Lindström, who gave me invaluable support.Thank you for sorting situations out on hot days and in hungry moments, keeping myspirits up and making things happen! Gunnar Öhlund for taking time to read mytheses and contributing with comments. I also want to thank everyone in theLandscape Ecology Group for answers, ideas and a really nice time.Thank you Emilia Scherlund and Anna Lagerström, a big hug.Literature citedAbbot, R. T. 1989. Compendium <strong>of</strong> <strong>land</strong> shells- a color guide to more than 2,000 <strong>of</strong> the world’sterrestrial shells. American Malacologist, Inc. Melbourne.Andersson, A. 1996. Landmollusker i jämtländska nyckelbiotoper. Skogsstyrelsen. Rapport 3.Barker, G. M. 2001. Gastropods on <strong>land</strong>: Phylogeny, Diversity and Adaptive Morphology. Pages 1-146in G. M. Baker, editor. The biology <strong>of</strong> terrestrial molluscs. CABI Publisher, Oxon, UnitedKingdom.Baur, A. and B. Baur. 1988. Individual Movement Patterns <strong>of</strong> the Minute Land Snail Punctumpygmaeum. The Veliger. 30(4): 372-376.Baur, B. and J. Bengtsson. 1987. Colonizing ability in <strong>land</strong> <strong>snail</strong>s on Baltic uplift archipelagos. Journal<strong>of</strong> Biogeography. 14:329-341.Boag, D. A. 1985. Microdistribution <strong>of</strong> three genera <strong>of</strong> small terrestrial <strong>snail</strong>s (Stylomatophora:Pulmonata). - Can. J. Zool. 63: 1089-1095.Burch, J. B. 1955. Some ecological factors <strong>of</strong> the soil affecting the distribution and abundance <strong>of</strong> <strong>land</strong><strong>snail</strong>s in eastern Virginia. The Nautilus. 69(2): 62- 69.21
Dallinger, R., B. Berger, R. Triebskorn-Köhler and H. Köhler. 2001. Soil biology and ecotoxicology.Pages 489-525 in G. M. Baker, editor. The biology <strong>of</strong> terrestrial molluscs. CABI Publisher,Oxon, United Kingdom.Dynesius, M., K. Hy<strong>land</strong>er and C. Nilsson. 2001. Boreal streamside forests are bryophyte-diversityhotspots and retain more species after <strong>clear</strong>-<strong>cutting</strong> compared to non-<strong>riparian</strong> forests. In:Dynesius M. 2001. Spatial and evolutionary aspects <strong>of</strong> species diversity, species traits andhuman impact with examples from boreal <strong>riparian</strong> and forest plant communities. Dissertation,Umeå University.Ehnström, B. and H. W. Waldén. 1986. Fuanavård i skogsbruket. Del 2 – Den lägre faunan.Skogsstyrelsen, Jönköping.Falkner, G., R. A. Bank and T. von Proschwitz. 2001. Check-list <strong>of</strong> the non-marine Molluscan Speciesgrouptaxa <strong>of</strong> the States <strong>of</strong> Norther, Atlantic and Central Europe. (CLECOM I). Heldia 4: 1-76Fisher, R. F. and D. Binkley. 2000. Ecology and management <strong>of</strong> forest soils. Third edition. John Wiley& Sons, Inc. New York.Grave<strong>land</strong>, J. 1996. Avian eggshell formation in calcium-rich and calcium-poor habitats: Importance <strong>of</strong><strong>snail</strong> shells and anthropogenic calcium sources. Can. J. Zool. 74 (6): 1035-1044.Grave<strong>land</strong>, J and R. vanderWal. 1996. Decline in <strong>snail</strong> abundance due to soil acidification causeseggshell defects in forest passerines. Oecologia. 105 (3): 351-360.Gärdenfors, U., H. W. Waldén and I. Wäreborn. 1996. Försurningseffekter på skogslevande snäckor-Återinventeringar, försökskalkningar, mark- och skalkemi. Naturvårdsverket, Stockholm.Rapport 4605. In Swedish, summary in English.Göthner, T. 2002. Skogsbrukets effekter på <strong>land</strong>snäckor i bäckskogar- En studie av kantzoners roll förbevarande av snäckfaunan. Degree thesis, Umeå university.Hotopp, KP. 2002. Land <strong>snail</strong>s and soil calcium in central Appalachian Mountain Forest. SoutheasternNaturalist. 1 (1): 27- 44.Hy<strong>land</strong>er,K., C. Nilsson and T. Göthner. In press. Effects <strong>of</strong> buffer strip retention and <strong>clear</strong><strong>cutting</strong> on<strong>land</strong> <strong>snail</strong>s in boreal <strong>riparian</strong> forests. Conservation Biology.Hy<strong>land</strong>er,K., C. Nilsson, B. G. Jonnson and T. Göthner. Differences in habitat quality explainnestedness in a <strong>land</strong> <strong>snail</strong> meta-community. Unpublished.Hägglund, B. and J.-E. Lundmark. 1981. Handledning i bonitering med Skogshögskolansboniteringssystem. Skogsstyrelsen, Jönköping.Karltun, E. Markkemiska analyser inom ståndortskarteringen. Metodbeskrivning.www-sml.slu.se/sk/analyinf.pdf Last updated 2003-11-10Kerney, M. P., R. A. D. Cameron and G. Riley. 1979. A Field Guide to the Land Snails <strong>of</strong> Britan andNorth- West Europe. - William Collins Sons and Co. Ltd. Glasgow.Lindström, K. 2003. Wood-living bryophyte species diversity and distribution – differences betweensmall-stream and up<strong>land</strong> spruce forests. Degree thesis, Umeå university.Lundmark, J.-E. 1988. Skogsmarkens ekologi. Ståndortsanpassat skogsbruk del 2-tillämpning.Skogsstyrelsen, Jönköping.Mason, C. F. 1970. Food, Feeding Rates and Assimilation in Wood<strong>land</strong> Snails. Oecologia. 4: 358-373.Mason, C. F. 1970b. Snail Populations, Beech Litter Production, and the Role <strong>of</strong> Snails in LitterDecomposition. Oecologia. 5: 215-239.22
Niemelä, J. 1997. Invertebrates and Boreal Forests Management. - Conservation Biology. vol. 11,3: 601- 610.Norušis, M. J. 1999. SPSS for Windows, version 10.0 SPSS., Chicago, Illinois, USA.Rees, W. J. 1965. The aerial dispersal <strong>of</strong> Mollusca. Proceedings <strong>of</strong> the Malacological Society <strong>of</strong>London. 36: 269-282.Reinink, K. 1979. Observations on the distribution <strong>of</strong> <strong>land</strong> <strong>snail</strong>s in the woods <strong>of</strong> the Ijsselmeer polders.Basteria. 43: 33-45.Shikov, E. V. 1984. Effects <strong>of</strong> <strong>land</strong> use changes on the <strong>land</strong> mollusc fauna in the central portion <strong>of</strong> theRussian plain. Pages 237-248 in A. Solem and A. C. van Bruggen, editors. World-wide <strong>snail</strong>s.E. J. Brill/W. Backhuys, Leiden, the Nether<strong>land</strong>s.Strayer, D., D. H. Pletscher, S. P. Hamburg and S. C. Nordvin. 1986. The <strong>effects</strong> <strong>of</strong> forest disturbanceon <strong>land</strong> gastropod communities in northern New Eng<strong>land</strong>. - Can. J. Zool. 64: 2094-2098.ter Braak, C. J. F. and I. C. Prentice. 1988. A theory <strong>of</strong> gradient analysis. – Advances in EcologicalResearch 18: 271-317.Valovirta, I. 1996. Land mollusc monitoring scheme- A handbook for field and laboratory methods.Version 15.04.1996. Finnish Environmental Institute, Helsinki, Nordic Council <strong>of</strong> Ministers.von Proschwitz, T. 2001. Monitoring studies on <strong>land</strong> <strong>snail</strong>s in the province <strong>of</strong> Hal<strong>land</strong> (SW Sweden) –a special survey <strong>of</strong> high diversity sites. Länstyrelsen Hal<strong>land</strong>. In Swedish, summary inEnglish.von Proschwitz, T. 1993. Habitat selection and distribution <strong>of</strong> ten vertiginid species in the province <strong>of</strong>Dals<strong>land</strong> (SW. Sweden) (Gastropoda, Pulmonata, Vertiginidae). MalakologischeAbhandlungen Staatliches Museum für Tierkunde Dresden. 16: 177-212.von Proschwitz, T. 1998. Landlevande mollusker i Jönköpings län. Länstyrlsen Jönköpings län.Waldén, H. W. 1998. Studies on the impact by forestry on the mollusc fauna in commercially usedforests in Central Sweden. Skogsstyrelsen. Rapport 2. In Swedish, summary in English.Waldén, H. W., U. Gärdenfors and I. Wäreborn. 1991. The impact <strong>of</strong> acid rain and heavy metals ontheterrestrial mollusc fauna. Tenth International Malacological Congress, Tubingen (1989).425- 435Waldén, H. W. 1981. Communities and diversity <strong>of</strong> <strong>land</strong> molluscs in Scandinavian wood<strong>land</strong>s. I. Highdiversity communities in taluses and boulder slopes in SW Sweden. Journal <strong>of</strong> Conchology.30: 351-372Wäreborn, I. 1982. Environments and molluscs in a non-calcareous forest area in southern Sweden;with remarks on competition among terrestrial <strong>snail</strong>s. In: Environments and molluscs in anon-calcareous forest areas in southern Sweden. Dissertation, University<strong>of</strong> Lund.Wäreborn, I. 1979. Reproductive success <strong>of</strong> two species <strong>of</strong> <strong>land</strong> <strong>snail</strong>s in relation to calcium salts inforest litter. Malacologia. 18: 177-180Wäreborn, I. 1969. Land molluscs and their environments in an oligotrophic area in southern Sweden.Oikos. 20: 416- 47923


