Stockholm Roadshow, - Coca Cola İçecek
Stockholm Roadshow, - Coca Cola İçecek
Stockholm Roadshow, - Coca Cola İçecek

Create successful ePaper yourself
Turn your PDF publications into a flip-book with our unique Google optimized e-Paper software.
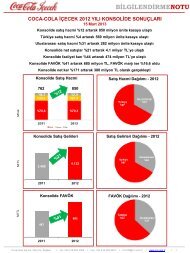
Geography and Category SplitVolume split (uc) - GeographyRevenue Split2005201120052011Volume split (uc) - CategoryEBITDA Split20052011200520118
Understanding Consumer BehaviorTurkey Central Asia PakistanCOKE 3LKazakhstanFanta BuratinoKazakhstanFanta DushesMinute MaidPulpyRamadanSherbetCappy PulpyKazakhstanFanta Lemon LemonadeAzerbaijanFanta Green AppleAzerbaijanFanta Dushes9
Iraq becomes 2nd largest market internationallyCCI’s Iraqi operations started in 2006 inNorthern IraqOn September 21, 2012, the acquisitionprocess of Al Waha Beverages, active in SouthIraq was completedCCI’s effective shareholding in Al Waha is ca.65%NARTD market is estimated to be 425 mn unitcases, of which sparkling beverages makes up250 mn casesPopulation of 33 million, of which 70% areless than 30 years of age11
Business Overview & StrategyOperational ReviewFinancial ReviewAppendix
1H12 ReviewDouble digit volume growth continuedBoth sparkling and still categories grewat low double digitsSparkling’s share within total volumeincreased due to strong categorygrowth in 2Q12Stable input cost environment13
Volume up by 10.7% in 1H12Turkey Volume International Volume Consolidated Volume(Unit cases in millions) (Unit cases in millions) (Unit cases in millions)259.0 268.3126.4356.5394.797.61H111H121H111H121H111H122Q12Consolidated up by 11.1% to 243.8 million ucTurkey up by 4.5% to 160.3 million ucInternational up by 26.5% to 83.6 million uc14
1H12 Sales Volume BreakdownVolume split (uc) - Geography1H11Volume split (uc) – Consolidated1H11Int'l27.4%Still21.5%Tea9.0%Turkey72.6%Sparkling69.5%1H121H12Tea8.9%Int'l32.0%Still21.9%Turkey68.0%Sparkling69.2%15
TurkeyTurkey volume growth 3.6% in 1H12All categories posted growth in 1H12‣ Both sparkling and still category grew ataround mid single digit in 2Q12Fuse Tea Pet 1LFuse Tea Can 330 mlCappy Fruit Beats 1ltFlavoursBurn 500ml.Cappy Sourcherry1ltCappy FruitScherbet 1ltCappy Blackmulberry1lt16
International OperationsAll key markets posted strong volumegrowth in 1H12‣ Pakistan volume growth 24%‣ Kazakhstan growth 31%‣ Azerbaijan growth 26%‣ Iraq growth 70%Volume split (uc) – Int’lCoke Zero Pet 0.5L, 1LTurkmenistanPiko Mors 1LKazakhstanFuse TeaPet 0.5L, 1L, 0.33LCanAzerbaijan17
Business Overview & StrategyOperational ReviewFinancial ReviewAppendix
Net sales up by 23% in 1H12Turkey Net Sales International Net Sales Consolidated Net Sales(TL in millions) (US$ in millions) (TL in millions)1,181.21,294.1346.81,911.01,554.8254.01H111H121H111H121H111H122Q12Consolidated up by 26.8% to TL 1,227.0 millionTurkey up by 13.5% to TL 817.5 millionInternational up by 32.8% to US$ 230.0 million19
EBITDA up by 45% in 1H12Turkey EBITDATurkey EBITDA International EBITDA Consolidated EBITDA(TL in millions) (US$ in millions) (TL in millions)14.9%17.1%*17.8%*14.4%*12.4%17.0%175.8220.661.6223.8325.531.41H111H121H111H121H111H122Q12Consolidated up by 49.7% to TL 242.9 millionTurkey up by 30.1% to TL 158.4 millionInternational up by 81.6% to US$ 50.0 million*EBITDA Margin20
Financial Expenses1H111H12Interest income22 14Interest expense (-)(29) (28)Foreign exchange gain / (loss)10 (23)Unrealized FX gain / (loss) - Borrowings(43) 49Gain / (loss) on derivative transactions(0) 0Financial Income / (Expense) Net(41) 11*mn TL21
Debt Structure1H12 FY11 Change%USD denominated*EURO denominated*TL denominatedOther (in USD terms)Total Financial Debt in TL814 77347 430 038 361,645 1,6345%9%n.m.6%1%Total Cash & Equivalent in TL472 526(10%)Net Debt in TL 1,173 1,1086%Net Debt in US$649 58711%Maturity Date% of total longterm debt2012 2013 2014 2015 20161.4% 4.1% 92.1% 2.1% 0.3%*In original currency22
2012 GuidanceConsolidated volume up at lowdouble digitMaintain strong top linegrowth ahead of volumeEBITDA Growth > Net Revenuegrowth23
AppendixFinancial Statements 2011Financial Leverage 2011Corporate StructureCountry DataOperational EfficienciesTurkey AFB MarketTea Market Segments in TurkeyTrade Structure in Turkey
Introduction to Financial StatementsBasis of PreparationConsolidated /TurkeyInternationalTL/$Year-EndTL/$AverageFunctionalCurrencyReportingCurrencyTLTLUSDUSDDecember 31,2011 1.8889December 31,2010 1.5460December 31,2011 1.6708December 31,2010 1.4990Presentation• Accounting standard is IFRS as per regulations of the Capital MarketsBoard of Turkey (CMB).• The Group’s interest in joint ventures is accounted by way ofproportionate consolidation.• The functional currency of CCBPL is Pakistan Rupee (PKR).Definitions• Net Sales – Net of discounts and special consumption tax for Turkishoperation∆ 22.2% ∆ 11.5%InflationAnnual ∆December 31, 2011 10.45%• EBITDA = EBIT + Amortization & Depreciation + Relevant Non CashExpenses including Provision for Employee Benefits - Relevant Non-cashincome including Negative Goodwill25
Income Statement - Consolidated(TL mn) 2010 2011 2011 vs 2010Volume (m/uc)665.4 761.7 14.5%Net Sales2,753.2 3,408.6 23.8%COGS (1,721.6) (2,145.8) 24.6%Gross Profit 1,031.5 1,262.8 22,.%OPEX (750.1) (939.8) 25.3%Other Inc/Exp (Net) (9.6) 5.4 n.mEBIT271.8 328.3 20.8%EBIT (exc. other) 281.4 322.9 14.8%Income Before Minority Int. & Tax 255.3 183.4 (28.2%)Minority Interest (0.7) (1.2) 66.6%Income Tax (56.9) (41.9) (26.4%)Net Income/(Loss) 197.7 140.3 (29.0%)EBITDA 435.0 486.9 11.9%EBITDA (exc. other)Gross Margin 37.5% 37.0%EBIT Margin 9.9% 9.6%EBIT Margin (exc. other) 10.2% 9.5%EBITDA Margin 15.8% 14.3%440.0 484.8 10.2%EBITDA Margin (exc. other) 16.0% 14.2%26
Income Statement - Turkey(TL mn) 2010 2011 2011 vs 2010Volume (m/uc)494.4 546.8 10.6%Net Sales2,121.4 2,472.8 16.6%COGS (1,277.5) (1,476.1) 15.5%Gross Profit 843.9 996.7 18.1%OPEX (609.7) (752.2) 23.4%Other Inc/Exp (Net) 6.1 23.5 n.mEBIT240.3 267.9 11.5%EBIT (exc. other) 234.1 244.4 4.4%Income Before Minority Int. & Tax 234.6 141.6 n.mMinority Interest - -Income Tax (43.3) (21.8) (49.6%)Net Income/(Loss) 191.3 119.8 (37.4%)EBITDA 342.5 362.6 5.9%EBITDA (exc. other)Gross Margin 39.8% 40.3%EBIT Margin 11.3% 10.8%EBIT Margin (exc. other) 11.0% 9.9%EBITDA Margin 16.2% 14.7%333.5 340.8 2.2%EBITDA Margin (exc. other) 15.7% 13.8%27
Income Statement - International(USD mn) 2010 2011 2011 vs 2010Volume (m/uc) 171.0 215.0 25.7%Net Sales 422.8 576.2 36.3%COGS (298.1) (417.1) 39.9%Gross Profit 124.8 159.2 27.6%OPEX (95.9) (115.4) 20.4%Other Inc/Exp (Net) (0.3) 1.6 n.mEBIT 28.6 45.4 58.5%EBIT (exc. other) 28.9 43.8 51.4%Income Before Minority Int. & Tax 20.6 33.5 66.0%Minority Interest (0.5) (0.7 ) 49.5%Income Tax (10.6) (8.9) 18.2%Net Income/(Loss) 11.3 22.2 97.1%EBITDA 83.9 69.5 20.7%EBITDA (exc. other)Gross Margin 29.5% 27.6%EBIT Margin 6.8% 7.9%EBIT Margin (exc. other) 6.8% 7.6%EBITDA Margin 16.4% 14.6%EBITDA Margin (exc. other) 16.3% 14.5%68.9 83.4 21.0%28
Balance Sheet – FY11/FY10(TL million)DecemberDecember 31, DecemberDecember 31, 2010(TL million)31, 20112011 31, 2010(audited) (audited) (audited) (audited)Cash & Cash Equivalents 522.2 491.7 ST Borrowings 125.4 627.7Investments in Securities 3.8 107.1 Trade Payables 185.9 99.3Trade Receivables andDue from Related Parties 284.2 300.0 Due to Related Parties 89.4 45.0Inventories 298.6 223.7 Other Payables 92.5 80.9Other Receivables 13.2 4.8 Provision for Corporate Tax 1.4 1.0Other Current Assets 328.2 166.6 Provision for Employee Benefits 14.7 14.4Total Current Assets 1,450.2 1,293.8 Other Liabilities 16.9 12.4Property, Plant andEquipment 1,676.8 1,203.0 Total Current Liabilities 526.1 880.6Intangible Assets(including goodwill) 593.6 459.4 LT Borrowings 1,508.6 617.9Deferred Tax Assets 1.9 2.5 Provision for Employee Benefits 30.2 35.7Other receivables andnon-current assets 65.0 55.3 Other Liabilities 0.0 3.6Total Non-current Assets 2,337.3 1,720.2 Deferred Tax Liability 52.6 41.1TOTAL ASSETS 3,787.6 3,014.0Total Non-Current Liabilities 1,591.4 698.4Minority Interest 20.1 17.6Shareholders Equity 1,650.0 1,417.4TOTAL LIABILITIES andSHAREHOLDER’S EQUITY 3,787.6 3,014.029
Free Cash Flow(TL mn) 2011 2010Cash Flow From Operating ActivitiesNet Income Adj for Non-Cash Items 533.5 459.2Interest Paid (51.8) (48.1)Interest Received 31.4 38.5Taxes Paid (30.0) (60.3)Employee Termination Benefits,Vacation Pay, Mngmt Bonus(33.8) (22.1)Operating Cash Flow 449.2 367.2 22.3%Change in Working Capital (165.1) (97.0)Operating Cash Flow post Change in WC 284.2 270.2 5.2%Cash Flow Investing ActivitiesProperty, Plant and Equipment (496.2) (159.6)Free Cash Flow (212.0) 110.6 n.m30
Financial Leverage and FCFNet Debt/EBITDA Capex/Net Sales FCF(Excluding – acquisitions)(TL million)2.4x2.0x11.0% 10.2% 111441H11 1H12 1H11 1H121H111H12* 12M Trailing31
Corporate Structure32
Country DataPopulation(mn) in 2011(2)% ofpopulationbelow 30years (2)GDP per capitain 2011($) (3)Per capitaconsumption ofsparkling bev.(L) in 2011 (4)CCI’s marketshare insparkling bev.in 2011 (5)CCI’s 2011VolumeBreakdownTurkey 74.3(1) 51% 10,576 45 70% 71.9%Pakistan 177.8 65% 1,164 12 28% 8.9%Kazakhstan 16.4 51% 10,951 32 37% 6.8%Azerbaijan 9.4 50% 7,510 24 57% 4.2%Iraq 32.8 70% 3,306 23 - 3.1%Jordan 6.4 67% 4,542 50 - 1.6%Turkmenistan 5.1 59% 4,362 38 - 1.8%Kyrgyzstan 5.4 61% 970 16 - 1.5%Syria 20.9 65% 3,050 17 - 0.2%Tajikistan 7.0 68% 862 7 -0%Sources: TUIK(1), UN Estimate(2), IMF(3), Company Estimate(4), Nielsen(5)33
Building a Sustainable Growth BusinessCCI TurkeyBest Country Bottling Operation at2009 TCCC EAG President’sEnvironment AwardsCCI Ankara PlantQuality Achievement Reward at2011 TCCC EAG National QualityAwardsWater usage ratio(lt water/lt product)2006 20111.741.473.442.002.10 2.101.70 1.74<strong>Coca</strong>-<strong>Cola</strong>System AverageEnergy usage ratio(MJ lt of product)2005 20111,690,27 0,250,450,400,340,280,22<strong>Coca</strong>-<strong>Cola</strong>System AverageTurkey Jordan Kazakhstan AzerbaijanTurkey Jordan Kazakhstan Azerbaijan34
Turkey AFB MarketAFB Market (exc. milk)5.2 billion ucRTD AFB Market (exc. milk)1.3 billion ucTea46.4%SparklingWater5%Ayran2%Other2%Powder&Concentrate0.4%Hot Coffee2.5%HOD24.8%RTD AFB26.0%FruitJuices&StillDrinks12%Bottled Water35%SparklingBeverages44%Source: Canadean, 2011Hot tea category constitutes 46% of alcohol-free beveragesRTD- Ready-to-Drink BeveragesAFB- Alcohol Free Beverages35
Tea Market Segments in TurkeyVolume2.7 bn ucValue *0.8 bn $Teapotbag4%Teabag1%TeabagTeapotbag5%8%Loose95%Loose87%Source: Nielsen, 2011Source: Nielsen, 2011Very high levels of hot tea consumption• Has the highest share of throat after tap water• 95% of Turkish people drink tea everyday• World’s highest per capita consumption* Nielsen datas are excluding on-premise consumption channels36
Trade Structure in TurkeyRetail Volume by Channel (2011)Hypermarket2%Discount Store5%Other 6% Gas Station 2%On Premise16%TraditionalGrocery 47%Supermarket23%Half of volume delivered by traditional trade channelsHighest retail coverage among all FMCG categories in Turkey*Other includes game houses, entertainment,gymnasium, travel, accomodation, transportation,education, workplace and military.Source: Company37
GlossaryAFB: Alcohol Free BeveragesCAGR: Compound Annual Growth RateCMB: Capital Markets Board of TurkeyHOD: Home and Office delivery waterOWB: One Way BottleRTD: Ready-to-Drink BeveragesUC: Unit Case (1 uc equals 5.678 liters)YTD: Year to Date<strong>Coca</strong>-<strong>Cola</strong> Icecek Investor RelationsTel: +90 216 528 4000Fax: +90 216 365 8457CCI-IR@cci.com.tr www.cci.com.tr------------------------------------Deniz Can YücelInvestor Relations ManagerTel: +90 216 528 3386deniz.yucel@cci.com.trCredit RatingForeign Currency Senior Unsecured rating and IDR‘BBB-’, Stable OutlookLocal Currency Senior Unsecured and IDR,‘BBB’, Stable Outlook(Fitch Rating, Nov. 24, 2011)Corporate Governance Rating of 8.88 (out of 10)(Saha Rating, July 2, 2012)Istanbul Stock Exchange: CCOLA.ISBloomberg: CCOLA TIReuters: CCOLA.IS