- Page 1 and 2: ENGINEERING MANUAL ofAUTOMATICCONTR
- Page 3 and 4: Copyright 1934, 1940, 1953, 1988, 1
- Page 5 and 6: PREFACEThe purpose of this manual i
- Page 7 and 8: CONTROL FUNDAMENTALSElectronic Cont
- Page 9 and 10: CONTROL FUNDAMENTALSDeviation—The
- Page 11 and 12: CONTROL FUNDAMENTALSHVAC SYSTEM CHA
- Page 13: CONTROL FUNDAMENTALSInfiltration is
- Page 16 and 17: CONTROL FUNDAMENTALSROTATINGGRANULA
- Page 18 and 19: CONTROL FUNDAMENTALS-PATHOFIONSAIRF
- Page 20 and 21: CONTROL FUNDAMENTALSOPENFINALCONTRO
- Page 22 and 23: CONTROL FUNDAMENTALSTIME PROPORTION
- Page 24 and 25: CONTROL FUNDAMENTALSON“CLOSE”SW
- Page 26 and 27: CONTROL FUNDAMENTALSOUTDOOR AIRTEMP
- Page 28 and 29: CONTROL FUNDAMENTALSPROPORTIONAL-IN
- Page 30 and 31: CONTROL FUNDAMENTALSCONTROLLERVALVE
- Page 32 and 33: CONTROL FUNDAMENTALSIn terms of hea
- Page 34 and 35: CONTROL FUNDAMENTALSFLAPPERSPRINGSI
- Page 36 and 37: CONTROL FUNDAMENTALSimpact of the j
- Page 38 and 39: CONTROL FUNDAMENTALSCHARACTERISTICS
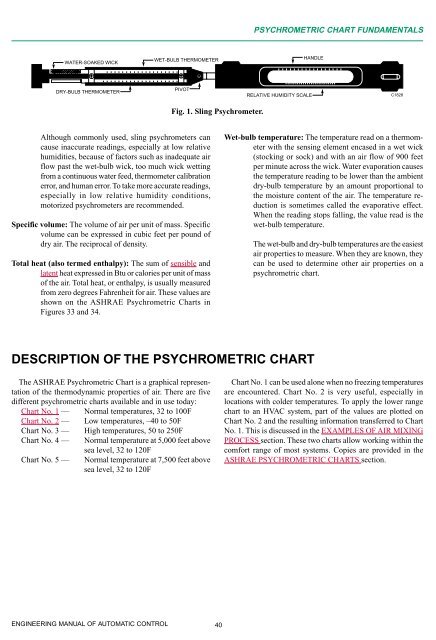
- Page 42 and 43: PSYCHROMETRIC CHART FUNDAMENTALShea
- Page 44 and 45: PSYCHROMETRIC CHART FUNDAMENTALS19.
- Page 46 and 47: PSYCHROMETRIC CHART FUNDAMENTALS0°
- Page 48 and 49: PSYCHROMETRIC CHART FUNDAMENTALSREF
- Page 50 and 51: PSYCHROMETRIC CHART FUNDAMENTALSThi
- Page 52 and 53: PSYCHROMETRIC CHART FUNDAMENTALSCOO
- Page 54 and 55: PSYCHROMETRIC CHART FUNDAMENTALS90
- Page 56 and 57: PSYCHROMETRIC CHART FUNDAMENTALSFig
- Page 58 and 59: PNEUMATIC CONTROL FUNDAMENTALSMain
- Page 60 and 61: PNEUMATIC CONTROL FUNDAMENTALSFrom
- Page 62 and 63: PNEUMATIC CONTROL FUNDAMENTALSA tem
- Page 64 and 65: PNEUMATIC CONTROL FUNDAMENTALSSome
- Page 66 and 67: PNEUMATIC CONTROL FUNDAMENTALSPRESS
- Page 68 and 69: PNEUMATIC CONTROL FUNDAMENTALSnozzl
- Page 70 and 71: PNEUMATIC CONTROL FUNDAMENTALSSENSO
- Page 72 and 73: PNEUMATIC CONTROL FUNDAMENTALSFigur
- Page 74 and 75: PNEUMATIC CONTROL FUNDAMENTALSBRANC
- Page 76 and 77: PNEUMATIC CONTROL FUNDAMENTALSMROOM
- Page 78 and 79: PNEUMATIC CONTROL FUNDAMENTALSCAPAC
- Page 80 and 81: PNEUMATIC CONTROL FUNDAMENTALSHESIT
- Page 82 and 83: PNEUMATIC CONTROL FUNDAMENTALSM13MD
- Page 84 and 85: PNEUMATIC CONTROL FUNDAMENTALSLow-l
- Page 86 and 87: PNEUMATIC CONTROL FUNDAMENTALSPNEUM
- Page 88 and 89: PNEUMATIC CONTROL FUNDAMENTALSPNEUM
- Page 90 and 91:
PNEUMATIC CONTROL FUNDAMENTALSSUPPL
- Page 92 and 93:
PNEUMATIC CONTROL FUNDAMENTALSDISCH
- Page 94 and 95:
ELECTRIC CONTROL FUNDAMENTALSLOW-VO
- Page 96 and 97:
ELECTRIC CONTROL FUNDAMENTALSSERIES
- Page 98 and 99:
ELECTRIC CONTROL FUNDAMENTALSLOW-LI
- Page 100 and 101:
ELECTRIC CONTROL FUNDAMENTALSCONTRO
- Page 102 and 103:
ELECTRIC CONTROL FUNDAMENTALSSERIES
- Page 104 and 105:
ELECTRIC CONTROL FUNDAMENTALSOPERAT
- Page 106 and 107:
ELECTRIC CONTROL FUNDAMENTALSBRIDGE
- Page 108 and 109:
ELECTRIC CONTROL FUNDAMENTALSTWO-PO
- Page 110 and 111:
ELECTRIC CONTROL FUNDAMENTALSA 135-
- Page 112 and 113:
ELECTRIC CONTROL FUNDAMENTALSMOMENT
- Page 114 and 115:
ELECTRONIC CONTROL FUNDAMENTALSINTR
- Page 116 and 117:
ELECTRONIC CONTROL FUNDAMENTALSTYPI
- Page 118 and 119:
ELECTRONIC CONTROL FUNDAMENTALSAnot
- Page 120 and 121:
ELECTRONIC CONTROL FUNDAMENTALSWIRE
- Page 122 and 123:
ELECTRONIC CONTROL FUNDAMENTALSTemp
- Page 124 and 125:
ELECTRONIC CONTROL FUNDAMENTALSTYPI
- Page 126 and 127:
MICROPROCESSOR-BASED/DDC FUNDAMENTA
- Page 128 and 129:
MICROPROCESSOR-BASED/DDC FUNDAMENTA
- Page 130 and 131:
MICROPROCESSOR-BASED/DDC FUNDAMENTA
- Page 132 and 133:
MICROPROCESSOR-BASED/DDC FUNDAMENTA
- Page 134 and 135:
MICROPROCESSOR-BASED/DDC FUNDAMENTA
- Page 136 and 137:
MICROPROCESSOR-BASED/DDC FUNDAMENTA
- Page 138 and 139:
MICROPROCESSOR-BASED/DDC FUNDAMENTA
- Page 140 and 141:
INDOOR AIR QUALITY FUNDAMENTALSINTR
- Page 142 and 143:
INDOOR AIR QUALITY FUNDAMENTALSRado
- Page 144 and 145:
INDOOR AIR QUALITY FUNDAMENTALSTabl
- Page 146 and 147:
INDOOR AIR QUALITY FUNDAMENTALSHEAL
- Page 148 and 149:
INDOOR AIR QUALITY FUNDAMENTALSPass
- Page 150 and 151:
INDOOR AIR QUALITY FUNDAMENTALSThis
- Page 152 and 153:
INDOOR AIR QUALITY FUNDAMENTALSEnvi
- Page 154 and 155:
INDOOR AIR QUALITY FUNDAMENTALSFLOW
- Page 156 and 157:
INDOOR AIR QUALITY FUNDAMENTALSROOF
- Page 158 and 159:
INDOOR AIR QUALITY FUNDAMENTALSFigu
- Page 160 and 161:
SMOKE MANAGEMENT FUNDAMENTALSINTROD
- Page 162 and 163:
SMOKE MANAGEMENT FUNDAMENTALSAny al
- Page 164 and 165:
SMOKE MANAGEMENT FUNDAMENTALSThe bu
- Page 166 and 167:
SMOKE MANAGEMENT FUNDAMENTALSThe do
- Page 168 and 169:
SMOKE MANAGEMENT FUNDAMENTALSAnothe
- Page 170 and 171:
SMOKE MANAGEMENT FUNDAMENTALSBIBLIO
- Page 172 and 173:
BUILDING MANAGEMENT SYSTEM FUNDAMEN
- Page 174 and 175:
BUILDING MANAGEMENT SYSTEM FUNDAMEN
- Page 176 and 177:
BUILDING MANAGEMENT SYSTEM FUNDAMEN
- Page 178 and 179:
BUILDING MANAGEMENT SYSTEM FUNDAMEN
- Page 180 and 181:
BUILDING MANAGEMENT SYSTEM FUNDAMEN
- Page 182 and 183:
BUILDING MANAGEMENT SYSTEM FUNDAMEN
- Page 184 and 185:
BUILDING MANAGEMENT SYSTEM FUNDAMEN
- Page 186 and 187:
AIR HANDLING SYSTEM CONTROL APPLICA
- Page 188 and 189:
AIR HANDLING SYSTEM CONTROL APPLICA
- Page 190 and 191:
AIR HANDLING SYSTEM CONTROL APPLICA
- Page 192 and 193:
AIR HANDLING SYSTEM CONTROL APPLICA
- Page 194 and 195:
AIR HANDLING SYSTEM CONTROL APPLICA
- Page 196 and 197:
AIR HANDLING SYSTEM CONTROL APPLICA
- Page 198 and 199:
AIR HANDLING SYSTEM CONTROL APPLICA
- Page 200 and 201:
AIR HANDLING SYSTEM CONTROL APPLICA
- Page 202 and 203:
AIR HANDLING SYSTEM CONTROL APPLICA
- Page 204 and 205:
AIR HANDLING SYSTEM CONTROL APPLICA
- Page 206 and 207:
AIR HANDLING SYSTEM CONTROL APPLICA
- Page 208 and 209:
AIR HANDLING SYSTEM CONTROL APPLICA
- Page 210 and 211:
AIR HANDLING SYSTEM CONTROL APPLICA
- Page 212 and 213:
AIR HANDLING SYSTEM CONTROL APPLICA
- Page 214 and 215:
AIR HANDLING SYSTEM CONTROL APPLICA
- Page 216 and 217:
AIR HANDLING SYSTEM CONTROL APPLICA
- Page 218 and 219:
AIR HANDLING SYSTEM CONTROL APPLICA
- Page 220 and 221:
AIR HANDLING SYSTEM CONTROL APPLICA
- Page 222 and 223:
AIR HANDLING SYSTEM CONTROL APPLICA
- Page 224 and 225:
AIR HANDLING SYSTEM CONTROL APPLICA
- Page 226 and 227:
AIR HANDLING SYSTEM CONTROL APPLICA
- Page 228 and 229:
AIR HANDLING SYSTEM CONTROL APPLICA
- Page 230 and 231:
AIR HANDLING SYSTEM CONTROL APPLICA
- Page 232 and 233:
AIR HANDLING SYSTEM CONTROL APPLICA
- Page 234 and 235:
AIR HANDLING SYSTEM CONTROL APPLICA
- Page 236 and 237:
AIR HANDLING SYSTEM CONTROL APPLICA
- Page 238 and 239:
AIR HANDLING SYSTEM CONTROL APPLICA
- Page 240 and 241:
AIR HANDLING SYSTEM CONTROL APPLICA
- Page 242 and 243:
AIR HANDLING SYSTEM CONTROL APPLICA
- Page 244 and 245:
AIR HANDLING SYSTEM CONTROL APPLICA
- Page 246 and 247:
BUILDING AIRFLOW SYSTEM CONTROL APP
- Page 248 and 249:
BUILDING AIRFLOW SYSTEM CONTROL APP
- Page 250 and 251:
BUILDING AIRFLOW SYSTEM CONTROL APP
- Page 252 and 253:
BUILDING AIRFLOW SYSTEM CONTROL APP
- Page 254 and 255:
BUILDING AIRFLOW SYSTEM CONTROL APP
- Page 256 and 257:
BUILDING AIRFLOW SYSTEM CONTROL APP
- Page 258 and 259:
BUILDING AIRFLOW SYSTEM CONTROL APP
- Page 260 and 261:
BUILDING AIRFLOW SYSTEM CONTROL APP
- Page 262 and 263:
BUILDING AIRFLOW SYSTEM CONTROL APP
- Page 264 and 265:
BUILDING AIRFLOW SYSTEM CONTROL APP
- Page 266 and 267:
BUILDING AIRFLOW SYSTEM CONTROL APP
- Page 268 and 269:
BUILDING AIRFLOW SYSTEM CONTROL APP
- Page 270 and 271:
BUILDING AIRFLOW SYSTEM CONTROL APP
- Page 272 and 273:
CHILLER, BOILER, AND DISTRIBUTION S
- Page 274 and 275:
CHILLER, BOILER, AND DISTRIBUTION S
- Page 276 and 277:
CHILLER, BOILER, AND DISTRIBUTION S
- Page 278 and 279:
CHILLER, BOILER, AND DISTRIBUTION S
- Page 280 and 281:
CHILLER, BOILER, AND DISTRIBUTION S
- Page 282 and 283:
CHILLER, BOILER, AND DISTRIBUTION S
- Page 284 and 285:
CHILLER, BOILER, AND DISTRIBUTION S
- Page 286 and 287:
CHILLER, BOILER, AND DISTRIBUTION S
- Page 288 and 289:
CHILLER, BOILER, AND DISTRIBUTION S
- Page 290 and 291:
CHILLER, BOILER, AND DISTRIBUTION S
- Page 292 and 293:
CHILLER, BOILER, AND DISTRIBUTION S
- Page 294 and 295:
CHILLER, BOILER, AND DISTRIBUTION S
- Page 296 and 297:
CHILLER, BOILER, AND DISTRIBUTION S
- Page 298 and 299:
CHILLER, BOILER, AND DISTRIBUTION S
- Page 300 and 301:
CHILLER, BOILER, AND DISTRIBUTION S
- Page 302 and 303:
CHILLER, BOILER, AND DISTRIBUTION S
- Page 304 and 305:
CHILLER, BOILER, AND DISTRIBUTION S
- Page 306 and 307:
CHILLER, BOILER, AND DISTRIBUTION S
- Page 308 and 309:
CHILLER, BOILER, AND DISTRIBUTION S
- Page 310 and 311:
CHILLER, BOILER, AND DISTRIBUTION S
- Page 312 and 313:
CHILLER, BOILER, AND DISTRIBUTION S
- Page 314 and 315:
CHILLER, BOILER, AND DISTRIBUTION S
- Page 316 and 317:
CHILLER, BOILER, AND DISTRIBUTION S
- Page 318 and 319:
CHILLER, BOILER, AND DISTRIBUTION S
- Page 320 and 321:
CHILLER, BOILER, AND DISTRIBUTION S
- Page 322 and 323:
CHILLER, BOILER, AND DISTRIBUTION S
- Page 324 and 325:
CHILLER, BOILER, AND DISTRIBUTION S
- Page 326 and 327:
CHILLER, BOILER, AND DISTRIBUTION S
- Page 328 and 329:
CHILLER, BOILER, AND DISTRIBUTION S
- Page 330 and 331:
CHILLER, BOILER, AND DISTRIBUTION S
- Page 332 and 333:
CHILLER, BOILER, AND DISTRIBUTION S
- Page 334 and 335:
CHILLER, BOILER, AND DISTRIBUTION S
- Page 336 and 337:
CHILLER, BOILER, AND DISTRIBUTION S
- Page 338 and 339:
CHILLER, BOILER, AND DISTRIBUTION S
- Page 340 and 341:
CHILLER, BOILER, AND DISTRIBUTION S
- Page 342 and 343:
CHILLER, BOILER, AND DISTRIBUTION S
- Page 344 and 345:
CHILLER, BOILER, AND DISTRIBUTION S
- Page 346 and 347:
CHILLER, BOILER, AND DISTRIBUTION S
- Page 348 and 349:
CHILLER, BOILER, AND DISTRIBUTION S
- Page 350 and 351:
CHILLER, BOILER, AND DISTRIBUTION S
- Page 352 and 353:
CHILLER, BOILER, AND DISTRIBUTION S
- Page 354 and 355:
CHILLER, BOILER, AND DISTRIBUTION S
- Page 356 and 357:
CHILLER, BOILER, AND DISTRIBUTION S
- Page 358 and 359:
CHILLER, BOILER, AND DISTRIBUTION S
- Page 360 and 361:
CHILLER, BOILER, AND DISTRIBUTION S
- Page 362 and 363:
CHILLER, BOILER, AND DISTRIBUTION S
- Page 364 and 365:
CHILLER, BOILER, AND DISTRIBUTION S
- Page 366 and 367:
CHILLER, BOILER, AND DISTRIBUTION S
- Page 368 and 369:
CHILLER, BOILER, AND DISTRIBUTION S
- Page 370 and 371:
CHILLER, BOILER, AND DISTRIBUTION S
- Page 372 and 373:
CHILLER, BOILER, AND DISTRIBUTION S
- Page 374 and 375:
INDIVIDUAL ROOM CONTROL APPLICATION
- Page 376 and 377:
INDIVIDUAL ROOM CONTROL APPLICATION
- Page 378 and 379:
INDIVIDUAL ROOM CONTROL APPLICATION
- Page 380 and 381:
INDIVIDUAL ROOM CONTROL APPLICATION
- Page 382 and 383:
INDIVIDUAL ROOM CONTROL APPLICATION
- Page 384 and 385:
INDIVIDUAL ROOM CONTROL APPLICATION
- Page 386 and 387:
INDIVIDUAL ROOM CONTROL APPLICATION
- Page 388 and 389:
INDIVIDUAL ROOM CONTROL APPLICATION
- Page 390 and 391:
INDIVIDUAL ROOM CONTROL APPLICATION
- Page 392 and 393:
INDIVIDUAL ROOM CONTROL APPLICATION
- Page 394 and 395:
INDIVIDUAL ROOM CONTROL APPLICATION
- Page 396 and 397:
INDIVIDUAL ROOM CONTROL APPLICATION
- Page 398 and 399:
INDIVIDUAL ROOM CONTROL APPLICATION
- Page 400 and 401:
INDIVIDUAL ROOM CONTROL APPLICATION
- Page 402 and 403:
VALVE SELECTION AND SIZINGVALVE SEL
- Page 404 and 405:
LINE PRESSURE IN PSIVALVE SELECTION
- Page 406 and 407:
VALVE SELECTION AND SIZINGVALVE MAT
- Page 408 and 409:
VALVE SELECTION AND SIZINGWhen butt
- Page 410 and 411:
VALVE SELECTION AND SIZING— Graph
- Page 412 and 413:
VALVE SELECTION AND SIZINGPRESSURE
- Page 414 and 415:
VALVE SELECTION AND SIZING3640.443.
- Page 416 and 417:
VALVE SELECTION AND SIZINGQUANTITY
- Page 418 and 419:
VALVE SELECTION AND SIZINGThe criti
- Page 420 and 421:
VALVE SELECTION AND SIZINGTable 5.
- Page 422 and 423:
DAMPER SELECTION AND SIZINGDAMPER S
- Page 424 and 425:
DAMPER SELECTION AND SIZINGIn a low
- Page 426 and 427:
DAMPER SELECTION AND SIZINGFor typi
- Page 428 and 429:
DAMPER SELECTION AND SIZINGTORQUE R
- Page 430 and 431:
DAMPER SELECTION AND SIZINGwhen eit
- Page 432 and 433:
DAMPER SELECTION AND SIZINGStabilit
- Page 434 and 435:
DAMPER SELECTION AND SIZINGTable 4.
- Page 436 and 437:
DAMPER SELECTION AND SIZINGDAMPER P
- Page 438 and 439:
DAMPER SELECTION AND SIZINGLOUVERSO
- Page 440 and 441:
GENERAL ENGINEERING DATAHEATING DAT
- Page 442 and 443:
GENERAL ENGINEERING DATACONVERSION
- Page 444 and 445:
GENERAL ENGINEERING DATAVOLUMEExist
- Page 446 and 447:
GENERAL ENGINEERING DATAHEAT TRANSF
- Page 448 and 449:
GENERAL ENGINEERING DATAFORCEEXAMPL
- Page 450 and 451:
GENERAL ENGINEERING DATATHREE-PHASE
- Page 452 and 453:
GENERAL ENGINEERING DATACONDUIT SIZ
- Page 454 and 455:
GENERAL ENGINEERING DATAVOLTAGE CON
- Page 456 and 457:
GENERAL ENGINEERING DATAAIRFLOW DAT
- Page 458 and 459:
GENERAL ENGINEERING DATAMOISTURE CO
- Page 460 and 461:
GENERAL ENGINEERING DATAENGINEERING
- Page 462 and 463:
GENERAL ENGINEERING DATAASHRAEGuide
- Page 464 and 465:
GENERAL ENGINEERING DATACooling Tow
- Page 466 and 467:
GENERAL ENGINEERING DATAFlame Safeg
- Page 468 and 469:
GENERAL ENGINEERING DATAOperationSe
- Page 470 and 471:
GENERAL ENGINEERING DATASeries 40Co
- Page 472:
GENERAL ENGINEERING DATAValve Contr