Uncertainty in Species Distribution Mapping
Uncertainty in Species Distribution Mapping
Uncertainty in Species Distribution Mapping

You also want an ePaper? Increase the reach of your titles
YUMPU automatically turns print PDFs into web optimized ePapers that Google loves.
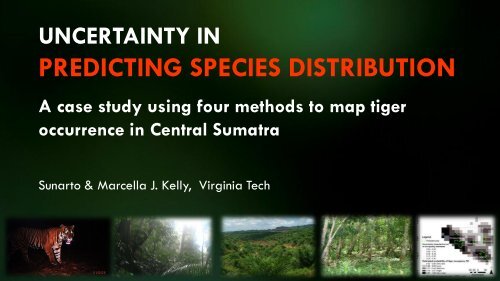
UNCERTAINTY INPREDICTING SPECIES DISTRIBUTIONA case study us<strong>in</strong>g four methods to map tigeroccurrence <strong>in</strong> Central SumatraSunarto & Marcella J. Kelly, Virg<strong>in</strong>ia Tech
Pre-assessment How many of you have modeled species distribution? For those who have done it, how many have: accounted uncerta<strong>in</strong>ty/evaluated model accuracy?
Outl<strong>in</strong>e Background Why species distribution? How species distribution is mapped <strong>Uncerta<strong>in</strong>ty</strong> and other issues Case study on predict<strong>in</strong>g tiger distribution
Why map/model sp distribution? Understand<strong>in</strong>g the ecology Fulfill<strong>in</strong>g the need for (species) management
www.tamr<strong>in</strong>.proboards.com/Why: Examples of ApplicationUnderstand<strong>in</strong>g ecology:Dispersal & barrierResources requirementsInteractions: wildlife & human
Brooks et al. 2006Why: Examples of ApplicationBiodiversity conservation priorities6
Conservation vs.DevelopmentHigh ConservationValue Areas (HCVA)7
MCP
Kernel Density
Home-range buffer 1
Home-range buffer 2
Grid
Predict<strong>in</strong>g species distribution: typical steps1. Determ<strong>in</strong><strong>in</strong>g scale2. Select<strong>in</strong>g variables3. Develop<strong>in</strong>g experimental design4. Collect<strong>in</strong>g data5. Develop<strong>in</strong>g/choos<strong>in</strong>g statistical procedures:range/envelope, distance/similarity, regressions,…6. Build<strong>in</strong>g & select<strong>in</strong>g models7. Translat<strong>in</strong>g mathematical model <strong>in</strong>to distribution map
After Morrison et al. 2006<strong>Uncerta<strong>in</strong>ty</strong> & other issuesImprecise data/measurement error: positional& attribute, applicable for bothspecies presence data (response variable) or environmental/habitat (predictorvariables)Error/uncerta<strong>in</strong>ty <strong>in</strong> data transfer/treatments/manipulation<strong>Uncerta<strong>in</strong>ty</strong> <strong>in</strong> selections of predictor variables<strong>Uncerta<strong>in</strong>ty</strong> <strong>in</strong> species detectionError/uncerta<strong>in</strong>ty <strong>in</strong> model parameter estimation<strong>Uncerta<strong>in</strong>ty</strong> <strong>in</strong> model<strong>in</strong>g approachUncerta<strong>in</strong> <strong>in</strong>ferencesFallacious/unrealistic assumptionsNatural variability/stochasticity of the system
Other issues : scaleAdapted from: Karanth & Nichols 2002
A case study: predict<strong>in</strong>g tiger distribution• Critically endangered• Elusive: high association with uncerta<strong>in</strong>ty• Urgent need for distribution maps• Year of the tiger
Study Area
Study Area17 km17 km
Types of data<strong>Species</strong> occurrence (response variables):• Presence only• Presence-’absence’• Detection-Nondetection• CountPredictors: Macro-habitat (global/landscape level features)
Model<strong>in</strong>g approaches used:Presence only data: Maximum Entropy (MaxEnt)Presence-’absence’ data: Logistic regression (R)Count data: Zero-<strong>in</strong>flated Negative B<strong>in</strong>omial regression (R)Detection-non detection data: Occupancy (Program PRESENCE)
Relative importance of variablesMaxEntLogistic Regr.CountOccupancy(% Contr.)(Logit l<strong>in</strong>k β)(Log l<strong>in</strong>k β)(Logit l<strong>in</strong>k β)Intercept NA -11.74 -2.38 (1.11) -8.48 (4.10)Forest area <strong>in</strong> 2007 59.8 1.30 0.73 (0.22) 0.61 (0.50)Altitude 0.7 113.09 20.94 (11.79) 94.08 (45.55)Distance to core forest area 0.1 -0.77 NA -0.85 (0.66)Road density 14.8 0.92 NA 0.05 (0.69)Distance to road 12.5 NA NA NADeforestation from 2006 to 2007 1.7 NA NA NADistance to core of protected areas 8.8 -1.07 NA NAPrecipitation 1.7 NA NA NA
Summary of predictionsMaxent Logistic Count OccupancyM<strong>in</strong>imum 0* 0 0 0Maximum 0.9 1.0 128.3 1.0Mean 0.237 0.329 2.036 0.423CV 0.871 1.185 4.499 0.830*) For Maxent outputs, no cell can be <strong>in</strong>terpreted as complete absent even if prediction is (near) 0(Phillips et al. 2006)
MaxEnt
Logisticregression
Count
Occupancy
“All models are wrong, butsome are useful”(George Box, quoted <strong>in</strong> Kennedy 1992: 73).
Concordance (%) between modelsOverallAccuracyREFERENCESMaxent Logistic Count OccupancyK-hatOverallAccuracyK-hatOverallAccuracyK-hatOverallAccuracyK-hatMaxent 28 13 38 22 38 23Logistic 28 13 47 34 52 40Count 38 22 47 34 56 45Occupancy 38 23 52 40 56 45
‘Correct predictions’ by different models( based on presence-only tiger records <strong>in</strong> 20 grids collected from <strong>in</strong>dependent surveys)Percentage of correct prediction100%75%50%25%MaxEntOccupancyCountLogistic regression0%1 2 3 4Treshholds on probability of occurrence34 1 = Very low, 2= low, 3= medium, 4= high
ConclusionsBetter to model than simply to map occurrence: account<strong>in</strong>g sampl<strong>in</strong>gefforts & environmental variablesIgnor<strong>in</strong>g detection probability ~ underestimat<strong>in</strong>g the populationparametersVariation <strong>in</strong> results from different modelsModel robustness for some variables & areasAccount for miss<strong>in</strong>g detections whenever possible: use occupancyFor some cases, presence-only model is still an acceptable choice.
AcknowledgementF<strong>in</strong>ancial & programmatic supportsprovided by: WWF Indonesia & Networks,Virg<strong>in</strong>ia Tech, Hurvis Family, STF, PHKA, OFWIMField team: Zulfahmi, Harry Kurniawan,Karmila Parakkasi, Eka Septayuda, Kusdianto,Fendy Panjaitan, Agung Suprianto, E. Tugiyo, L.Subali, H. Gebog, Herri Irawan, Roni Faslah,Kokok Yulianto, Sunandar, Riza Sukriana,TarmisonSpecial thanks to: Drs. Sybille Klenzendorf,Steve Prisley, Jim Nichols, Jim H<strong>in</strong>es, Dean F.Stauffer, Mike R. Vaughan, WHAPA colleagues