Grassland Vegetation Monitoring: A Minnesota Wildlife Action Plan ...
Grassland Vegetation Monitoring: A Minnesota Wildlife Action Plan ...
Grassland Vegetation Monitoring: A Minnesota Wildlife Action Plan ...

Create successful ePaper yourself
Turn your PDF publications into a flip-book with our unique Google optimized e-Paper software.
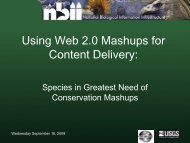
<strong>Grassland</strong> <strong>Vegetation</strong><strong>Monitoring</strong>: A <strong>Minnesota</strong><strong>Wildlife</strong> <strong>Action</strong> <strong>Plan</strong> Priority anda Multi-partner AdaptiveManagement CollaborativeDaren Carlson, Sara Vacek, Kim Bousquet, MeredithCornett, and Robert Dana
Can you read this?Aoccdrnig to rscheearch atCmabrigde Uinervtisy, it deosn'tmttaer in waht oredr the ltteers in awrod are, the olny iprmoatnt tihng istaht the frist and lsat ltteer be at therghit pclae. The rset can be a toatlmses and you can sitll raed it wouthita porbelm. Tihs is bcuseae the huamnmnid deos not raed ervey lteter byistlef, but the wrod as a wlohe.
What do you see?
What flower is this?
Taraxacum vulgare
"I think the big implication here is that as researchers we have to be very careful whenit comes to observing through our own limited sensory organs," says Herberstein of ourability to see in the UV spectrum."We are not meant to see crab spiders. Bees and birds are meant to see them."
Westerners tend to be analytical and pay more attention to the key, or focal, objects in ascene—for example, concentrating on the woman in the "Mona Lisa," as opposed to therocks and sky behind her.East Asians, by contrast, tend to look at the whole picture and rely on contextualinformation when making decisions and judgments about what they see, Nisbett said.
State wildlife action plans (SWAP):overview• 2005: All 50 states and 6 territories develop aComprehensive <strong>Wildlife</strong> Conservation Strategy (CWCS)All CWCS documents must contain 8 elements:1. Distribution & abundance of species in greatestconservation need2. Location & condition of habitats/communities3. Threats/stresses4. Conservation actions & priority research5. <strong>Plan</strong>s for <strong>Monitoring</strong>6. Procedures to review the plan7. Coordination with other agencies8. Public participation
EcoscapeMeasuring outcomes atmultiple scalesFunction & services(Watershed assessment tool)Key habitatsSpeciesAmount & condition(Prairie monitoring)Populations & distribution(Prairie monitoring)ProjectsAdaptive management(<strong>Grassland</strong> collaborative)
<strong>Monitoring</strong> for MN SWAP- Phase I: Prairies and surrogate grasslands1. Change analysis2. Prairie condition andanimal monitoring onselected high quality sites3. Adaptive management
Change analysis~ 2900 prairiesites surveyed >15years ago
Change analysis‣ Identify # of sites w/ change:1) # with prairie remaining2) # with some change3) # fully converted‣ Record types of change- both within and adjacent to sites‣Quantify change– explore use of object-orientedsegmentation analysis software
Prairie condition and animal monitoring48-60 high quality (A, B rank) nativeprairie sitesStratified by:- Geographic focus area- Landscape context and size(explore the effects of fragmentation)
Prairie condition and animal monitoring
<strong>Minnesota</strong> <strong>Grassland</strong> <strong>Monitoring</strong> Team<strong>Monitoring</strong> Protocol and <strong>Plan</strong>Basic ModelIntermediate ModelBasic + finer detail for grass vs. forb, moreextensive native species checklistDeluxe ModelIntermediate + all species > 10% cover at plot level, wider belttransect for natives, invasives/exotics, and disturbanceincreasers checklists.
<strong>Monitoring</strong> Protocol and <strong>Plan</strong>Structure• Visual Obstruction Reading• Litter depthComposition• <strong>Plan</strong>t groups• All invasive species• Native species checklist• All native species >10% cover- Data collected using 25m belttransects
Herbaceous (100s)Shrubs < 50%Native >50%Native >75%Native 50-75%100 = Grass >50%101 = Forb >50%102 = Grass >50%103 = Forb >50%A = Grass >75%all grassB = Grass 50-75%grass w/ forbsA = Forb >75%all forbsB = Forb 50-75%forbs w/ grassA = Grass >75%all grassB = Grass 50-75%grass w/ forbsA = Forb >75%all forbsB = Forb 50-75%forbs w/ grassExotic >50%Exotic >75%Exotic 50-75%104 = Grass >50%105 = Forb >50%106 = Grass >50%107 = Forb >50%A = Grass >75%all grassB = Grass 50-75%grass w/ forbsA = Forb >75%all forbsB = Forb 50-75%forbs w/ grassA = Grass >75%all grassB = Grass 50-75%grass w/ forbsA = Forb >75%all forbsB = Forb 50-75%forbs w/ grass
<strong>Minnesota</strong> <strong>Grassland</strong> <strong>Monitoring</strong> TeamData management
<strong>Minnesota</strong> <strong>Grassland</strong> <strong>Monitoring</strong> TeamNext steps• Sensitivity analyses of protocols-Sampling density-Repeatibility-Indicator species review• Predictive models-Management prescriptions• Refine monitoring framework-Frequency of most detailed protocols• Application development in ArcPad
5, 10, 50 years from now…Have we been successful?What have we learned?What do we need to change?
<strong>Minnesota</strong> <strong>Grassland</strong> <strong>Monitoring</strong> TeamObjectives• Maintain or increase the % cover ofnative prairie vegetation• Minimize the % cover of specificinvasives (Bromus, Poa, Cirsium,woody vegetation)• Maintain the structural diversity ofnative grassland ecosystems• Maintain or improve plantcomposition (MNDNR-SWAP only)
Field data entry
Prairie condition and animal monitoringPrairie animal monitoring:1) Bird communities2) Butterfly communities3) Insect abundance?4) Others?‣ Explore the use of area-occupancymodels (MacKenzie et al. 2002)
6 broad habitat priorities (key-key habitats)• Prairies and surrogate grasslands• Savannas and woodlands• Upland coniferous forest• Lowland coniferous forest• Non-forested wetlands• Rivers and streams• Lakeshores
<strong>Minnesota</strong> <strong>Grassland</strong> <strong>Monitoring</strong> TeamAdaptive ManagementSet up management frameworkStakeholder involvementObjective(s)Potential management alternativesPredictive models<strong>Monitoring</strong> protocols and plansSequential managementdecision makingmonitoringassessment
<strong>Minnesota</strong> <strong>Grassland</strong> <strong>Monitoring</strong> TeamNext stepsHigh DisturbanceLow Disturbancelow med high low med highGGG% invasives 0.7 0.2 0.1 0.5 0.3 0.2avg litter 0.5 0.3 0.2 0.2 0.3 0.5BRR% invasives 0.5 0.3 0.2 0.7 0.2 0.1avg litter 0.2 0.3 0.5 0.5 0.3 0.2
Measuring outcomes1. Are broad-scale terrestrial and aquatic ecosystems that support keyhabitats and SGCN functioning?2. Are the key habitats increasing in amount and/or improving incondition?3. Are the populations of Species in Greatest Conservation Need(SGCN) stable or increasing?4. Are the actions identified in Tomorrow’s Habitat effective?
Write down one of these statements:PARISIN THETHE SPRINGONCEIN AA LIFETIMEABIRDIN THETHE HAND
Prairie condition and animal monitoringPrairie condition monitoring variables:1) Percent cover of native prairie vegetation(forbs and grasses)2) Percent cover of specific invasive/exoticspecies (e.g., Bromus inermis, Poa pratensis, Cirsiumarvense, woody vegetation)3) Structural diversity4) Presence of all invasive/exotic species5) Native plant species diversity andcomposition‣ Sensitivity analyses of protocols
Herbaceous (100s)Shrubs < 50%Low Shrub (200s)Shrubs (50%Tall Shrub (300s)Shrubs (>1-m tall) >50%Tall Shrub Only (400s)Shrubs (>1-m tall) >75% withNO herbaceous understory900 = Other(small mammal mound, rock pile, cow pie, etc)
Measuring outcomes
Measuring outcomes1. Are the actions identified in Tomorrow’s Habitat beingimplemented? Are they effective?2. Are the populations of Species in Greatest Conservation Need(SGCN) stable or increasing?3. Are the key habitats identified in Tomorrow’s Habitat increasing inamount and/or improving in condition?4. Are broad-scale terrestrial and aquatic ecosystems that support keyhabitats and SGCN functioning?
Write down one of these statements:PARISIN THETHE SPRINGONCEIN AA LIFETIMEABIRDIN THETHE HAND
What Quantities to Estimate?3 Levels of Inference• Abundance – single species– State variable: abundance– Vital rates: Pr(survival, reproduction, movement)• Occupancy – single species– State variable: Proportion patches occupied– Vital rates: Pr(local extinction/colonization)• Community – multiple species– State variable: Species richness– Vital rates: rates of extinction and colonization
Species Occurrence• Conduct “presence-absence” (detectionnondetection)surveys.• Estimate what fraction of sites (or area) isoccupied by a species when species is notalways detected with certainty, even whenpresent (p < 1).
Single Season Model• Consider the data consists of 2 ‘layers’1. True presence/absence of the species.2. Observed data which is conditional upon speciesdistribution.• Knowledge about the first layer is imperfect.• Must account for the observation process tomake reliable inferences about occurrence.
Single Season Model• = probability a unit is occupied.• p j = probability species is detected at a unitin survey j (given presence).
Likelihood ApproachFor example,h1 101Verbal description: species is present at the unit, wasdetected in first and third survey, not detected insecond survey.Mathematical translation:Pr h 101 ψp 1p p 1 1 2 3
Likelihood ApproachFor example,h2 000Verbal description: species is present at the unit andwas never detected, OR species is absent.Mathematical translation:Pr h2000 ψ1 pj 1ψ3 j1
What can we achieve?
Pathway1. Tomorrow’s Habitatobjectives and priorities2. LCCMR & SWG prairiemonitoring project3. Prairie monitoringprotocols4. <strong>Grassland</strong> monitoringworkgroup
How many F’s are in the sentence below?FINISHED FILES ARE THERESULT OF YEARS OF SCIENTIFICSTUDY COMBINED WITH THEEXPERIENCE OF YEARS.
SGCN by Habitatstatewide summaryPrairieRiver- Headwater to largeWetland- Non-forestShrub/woodland- Upland*<strong>Grassland</strong>River- Very LargeForest- Upland ConiferForest- Upland Deciduous (Hardwood)Shrub- LowlandShoreline-dunes-cliff/talusForest- Lowland ConiferForest- Lowland DeciduousForest- Upland Deciduous (Aspen)Lake- ShallowLake- DeepCroplandDeveloped0 10 20 30 40 50 60 70 80Number of species
Landcover change~1890s 1990s
How many F’s are in the sentence below?FINISHED FILES ARE THERESULT OF YEARS OF SCIENTIFICSTUDY COMBINED WITH THEEXPERIENCE OF YEARS.
How many F’s are in the sentence below?FINISHED FILES ARE THERESULT OF YEARS OF SCIENTIFICSTUDY COMBINED WITH THEEXPERIENCE OF YEARS.Answer: 6
Write down one of these statements:PARISIN THETHE SPRINGONCEIN AA LIFETIMEABIRDIN THETHE HAND
Number of key habitats byECS subsection