LEGAL SERVICES COMMISSIONER ANNUAL REPORT 2012
LEGAL SERVICES COMMISSIONER ANNUAL REPORT 2012
LEGAL SERVICES COMMISSIONER ANNUAL REPORT 2012

You also want an ePaper? Increase the reach of your titles
YUMPU automatically turns print PDFs into web optimized ePapers that Google loves.
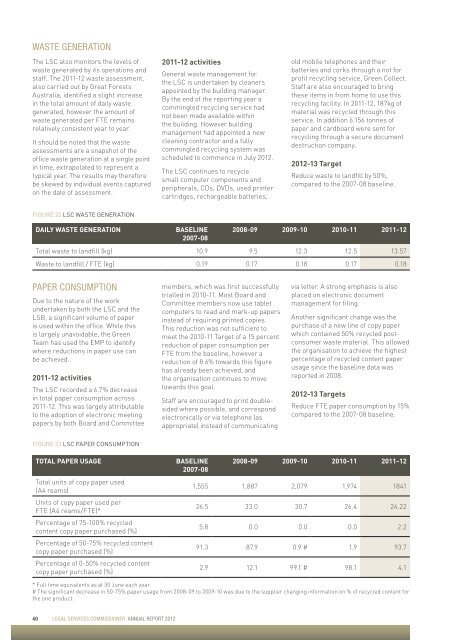
Waste generationThe LSC also monitors the levels ofwaste generated by its operations andstaff. The 2011-12 waste assessment,also carried out by Great ForestsAustralia, identified a slight increasein the total amount of daily wastegenerated, however the amount ofwaste generated per FTE remainsrelatively consistent year to year.It should be noted that the wasteassessments are a snapshot of theoffice waste generation at a single pointin time, extrapolated to represent atypical year. The results may thereforebe skewed by individual events capturedon the date of assessment.2011-12 activitiesGeneral waste management forthe LSC is undertaken by cleanersappointed by the building manager.By the end of the reporting year acommingled recycling service hadnot been made available withinthe building. However buildingmanagement had appointed a newcleaning contractor and a fullycommingled recycling system wasscheduled to commence in July <strong>2012</strong>.The LSC continues to recyclesmall computer components andperipherals, CDs, DVDs, used printercartridges, rechargeable batteries,old mobile telephones and theirbatteries and corks through a not forprofit recycling service, Green Collect.Staff are also encouraged to bringthese items in from home to use thisrecycling facility. In 2011-12, 187kg ofmaterial was recycled through thisservice. In addition 6.156 tonnes ofpaper and cardboard were sent forrecycling through a secure documentdestruction company.<strong>2012</strong>-13 TargetReduce waste to landfill by 50%,compared to the 2007-08 baseline.Figure 22 LSC waste generationDaily waste generationBaseline 2008-09 2009-10 2010-11 2011-122007-08Total waste to landfill (kg) 10.9 9.5 12.3 12.5 13.57Waste to landfill / FTE (kg) 0.19 0.17 0.18 0.17 0.18Paper consumptionDue to the nature of the workundertaken by both the LSC and theLSB, a significant volume of paperis used within the office. While thisis largely unavoidable, the GreenTeam has used the EMP to identifywhere reductions in paper use canbe achieved.2011-12 activitiesThe LSC recorded a 6.7% decreasein total paper consumption across2011-12. This was largely attributableto the adoption of electronic meetingpapers by both Board and Committeemembers, which was first successfullytrialled in 2010-11. Most Board andCommittee members now use tabletcomputers to read and mark-up papersinstead of requiring printed copies.This reduction was not sufficient tomeet the 2010-11 Target of a 15 percentreduction of paper consumption perFTE from the baseline, however areduction of 8.6% towards this figurehas already been achieved, andthe organisation continues to movetowards this goal.Staff are encouraged to print doublesidedwhere possible, and correspondelectronically or via telephone (asappropriate) instead of communicatingvia letter. A strong emphasis is alsoplaced on electronic documentmanagement for filing.Another significant change was thepurchase of a new line of copy paperwhich contained 50% recycled postconsumerwaste material. This allowedthe organisation to achieve the highestpercentage of recycled content paperusage since the baseline data wasreported in 2008.<strong>2012</strong>-13 TargetsReduce FTE paper consumption by 15%compared to the 2007-08 baseline.Figure 23 LSC paper consumptionTotal paper usageTotal units of copy paper used(A4 reams)Units of copy paper used perFTE (A4 reams/FTE)*Percentage of 75-100% recycledcontent copy paper purchased (%)Percentage of 50-75% recycled contentcopy paper purchased (%)Percentage of 0-50% recycled contentcopy paper purchased (%)Baseline2007-082008-09 2009-10 2010-11 2011-121,555 1,887 2,079 1,974 184126.5 33.0 30.7 26.4 24.225.8 0.0 0.0 0.0 2.291.3 87.9 0.9 # 1.9 93.72.9 12.1 99.1 # 98.1 4.1* Full time equivalents as at 30 June each year.# The significant decrease in 50-75% paper usage from 2008-09 to 2009-10 was due to the supplier changing information on % of recycled content forthe one product.40 Legal Services <strong>COMMISSIONER</strong> Annual Report <strong>2012</strong>