and unrealized gains and losses are recognized aschanges in net assets in the period in which they occurand investment income is recognized as revenue in theperiod earned. In order to increase consistency andcomparability in fair value measurements, a fair valuehierarchy prioritizes observable and unobservable inputsused to measure fair value into three levels, as describedbelow:Level 1 - Valuations for assets and liabilities that canbe obtained from readily available active pricingsources for market transactions involving identicalassets or liabilities.Level 2 - Valuations for assets and liabilities tradedin less active dealer or broker markets. Valuationsare obtained from third-party pricing services foridentical or similar assets or liabilities.Level 3 - Valuations for assets and liabilities thatare derived from other valuation methodologies,including option pricing models, discounted cashflow models or similar techniques, and not basedon market exchange, dealer, or broker-tradedtransactions.E. Donated goods and services are recognized in thefinancial statements if the services or goods enhanceor create non-financial assets or require specializedskills, provided by individuals possessing those skills andwould typically need to be purchased if not providedby donation. Donated contributions of use of facilitiesare recognized at estimated fair value. A member of<strong>Catalyst</strong>’s Board of Directors is an attorney. For manyyears, her law firm has provided pro-bono legal servicesto <strong>Catalyst</strong>. For the years ended August 31, <strong>2011</strong> and2010, <strong>Catalyst</strong> recorded contributed goods and servicesamounting to $605,086 and $779,040, respectively, whichare included in revenue, expenses and fixed assets forcapitalized property and equipment in the accompanyingconsolidated financial statements.F. <strong>Catalyst</strong> considers all highly liquid instruments purchasedwith original maturities of 3 months or less to be cashequivalents, except for cash, money market funds, andcertificates of deposits held as investments.G. <strong>Catalyst</strong> has determined that no allowance foruncollectible grants and contributions receivableand accounts and other receivables is necessary as ofAugust 31, <strong>2011</strong> and 2010. Such estimate is based onmanagement’s assessments of the creditworthiness of itsdonors, the aged basis of its receivables, as well as currenteconomic conditions and historical information.H. Inventory consists of publications that are sold on<strong>Catalyst</strong>’s website. Inventory is stated at the lower of cost(specific identification) or market.I. Property and equipment is stated at cost less accumulateddepreciation or amortization. These amounts do notpurport to represent replacement or realizable values.<strong>Catalyst</strong> capitalizes all owned property and equipmenthaving a useful life of greater than one year and a costof more than $1,000. Depreciation is provided on astraight-line basis over the estimated useful lives of theassets. Leasehold improvements are amortized over thelesser of the useful lives of the improvements or the termof the applicable lease.J. <strong>Catalyst</strong> leases real property under operating leasesat various dates in the future. Since the rent paymentsincrease over time, <strong>Catalyst</strong> records an adjustment torent expense each year to reflect its straight-lining policy.The annual adjustment recorded for the years endedAugust 31, <strong>2011</strong> and 2010, amounted to $110,599 and$110,467, respectively. Straight-lining of rent gives riseto a timing difference that is reflected as deferred rentobligation in the accompanying consolidated statementof financial position.K. <strong>Catalyst</strong> receives cash in advance of special events that areto be held after the statement of financial position date.It is <strong>Catalyst</strong>’s policy to record the contribution portionof the events as income when received and the exchangeportion as deferred income until earned. Additionally,advisory fee, honoraria, and miscellaneous income arereported as revenue when expenses are incurred inaccordance with the terms of the agreement. Deferredrevenue balances include special event, advisory fee,honoraria, and miscellaneous receipts applicable to thenext fiscal year.L. All elements of financial statements for <strong>Catalyst</strong> CanadaInc. and <strong>Catalyst</strong> Europe AG are translated by using acurrency exchange rate. For assets and liabilities, theexchange rate as of the balance sheet date is used. Forrevenues, support and expenses, an average exchangerate for the period is used. As of August 31, <strong>2011</strong>, theaccumulated adjustments to net assets related to currencyexchange rates amounted to a decrease in net assets ofapproximately $199,000. For the year ended August31, <strong>2011</strong>, <strong>Catalyst</strong> incurred a loss of $119,000. ThroughFebruary 2012 there are no significant exchange ratechanges.M. The preparation of consolidated financial statementsin conformity with accounting principles generallyaccepted in the United States of America requiresmanagement to make estimates and assumptions thataffect certain reported amounts and disclosures at thedate of the financial statements. Actual results coulddiffer from those estimates.N. Fair value measurements are based on the price that wouldbe received to sell an asset or paid to transfer a liabilityin an orderly transaction between market participants at47 | <strong>Catalyst</strong> <strong>Annual</strong> <strong>Report</strong> <strong>2011</strong>
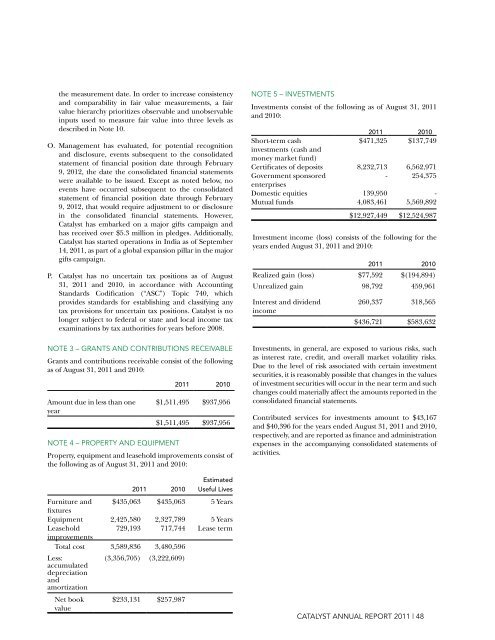
the measurement date. In order to increase consistencyand comparability in fair value measurements, a fairvalue hierarchy prioritizes observable and unobservableinputs used to measure fair value into three levels asdescribed in Note 10.O. Management has evaluated, for potential recognitionand disclosure, events subsequent to the consolidatedstatement of financial position date through February9, 2012, the date the consolidated financial statementswere available to be issued. Except as noted below, noevents have occurred subsequent to the consolidatedstatement of financial position date through February9, 2012, that would require adjustment to or disclosurein the consolidated financial statements. However,<strong>Catalyst</strong> has embarked on a major gifts campaign andhas received over $5.3 million in pledges. Additionally,<strong>Catalyst</strong> has started operations in India as of September14, <strong>2011</strong>, as part of a global expansion pillar in the majorgifts campaign.P. <strong>Catalyst</strong> has no uncertain tax positions as of August31, <strong>2011</strong> and 2010, in accordance with AccountingStandards Codification (“ASC”) Topic 740, whichprovides standards for establishing and classifying anytax provisions for uncertain tax positions. <strong>Catalyst</strong> is nolonger subject to federal or state and local income taxexaminations by tax authorities for years before 2008.NOTE 3 – GRANTS AND CONTRIBUTIONS RECEIVABLEGrants and contributions receivable consist of the followingas of August 31, <strong>2011</strong> and 2010:Amount due in less than oneyearNOTE 4 – PROPERTY AND EQUIPMENT<strong>2011</strong> 2010<strong>2011</strong> 2010$1,511,495 $937,956$1,511,495 $937,956Property, equipment and leasehold improvements consist ofthe following as of August 31, <strong>2011</strong> and 2010:EstimatedUseful LivesFurniture and $435,063 $435,063 5 YearsfixturesEquipment 2,425,580 2,327,789 5 YearsLeasehold 729,193 717,744 Lease termimprovementsTotal cost 3,589,836 3,480,596Less:(3,356,705) (3,222,609)accumulateddepreciationandamortizationNet bookvalue$233,131 $257,987NOTE 5 – INVESTMENTSInvestments consist of the following as of August 31, <strong>2011</strong>and 2010:Short-term cashinvestments (cash andmoney market fund)<strong>2011</strong> 2010Realized gain (loss) $77,592 $(194,894)Unrealized gain 98,792 459,961Interest and dividendincome<strong>2011</strong> 2010$471,325 $137,749Certificates of deposits 8,232,713 6,562,971Government sponsored- 254,375enterprisesDomestic equities 139,950 -Mutual funds 4,083,461 5,569,892$12,927,449 $12,524,987Investment income (loss) consists of the following for theyears ended August 31, <strong>2011</strong> and 2010:260,337 318,565$436,721 $583,632Investments, in general, are exposed to various risks, suchas interest rate, credit, and overall market volatility risks.Due to the level of risk associated with certain investmentsecurities, it is reasonably possible that changes in the valuesof investment securities will occur in the near term and suchchanges could materially affect the amounts reported in theconsolidated financial statements.Contributed services for investments amount to $43,167and $40,396 for the years ended August 31, <strong>2011</strong> and 2010,respectively, and are reported as finance and administrationexpenses in the accompanying consolidated statements ofactivities.<strong>Catalyst</strong> <strong>Annual</strong> <strong>Report</strong> <strong>2011</strong> | 48