Coasts & Estuaries - City of Port Adelaide Enfield - SA.Gov.au
Coasts & Estuaries - City of Port Adelaide Enfield - SA.Gov.au
Coasts & Estuaries - City of Port Adelaide Enfield - SA.Gov.au

You also want an ePaper? Increase the reach of your titles
YUMPU automatically turns print PDFs into web optimized ePapers that Google loves.
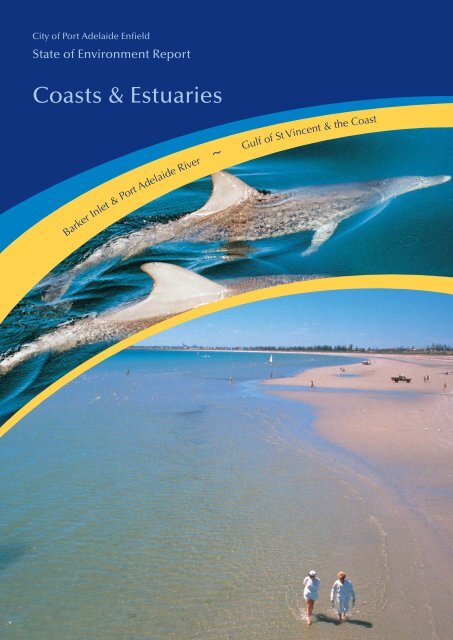
<strong>City</strong> <strong>of</strong> <strong>Port</strong> <strong>Adelaide</strong> <strong>Enfield</strong>State <strong>of</strong> Environment Report<strong>Coasts</strong> & <strong>Estuaries</strong>Barker Inlet & <strong>Port</strong> <strong>Adelaide</strong> River ~Gulf <strong>of</strong> St Vincent & the Coast
Coast & <strong>Estuaries</strong>Coast & <strong>Estuaries</strong>Barker Inlet & <strong>Port</strong> <strong>Adelaide</strong> RiverIntroductionThe Coastal and Marine Environment is a significant feature <strong>of</strong> the Council area. The coastal regioncan be roughly divided into two areas, the <strong>Port</strong> <strong>Adelaide</strong> River coastline (Barker Inlet and <strong>Port</strong><strong>Adelaide</strong> River Estuary) and the beach coastline. Map 22 (page 165) shows an aerial photograph <strong>of</strong>the features <strong>of</strong> the coastal environment.The Barker Inlet and <strong>Port</strong> <strong>Adelaide</strong> River Estuary is the largest tidal inlet in Gulf St Vincent and itsprotected waters provide <strong>Adelaide</strong> and South Australia with major port facilities. It is highly significantto the State in ecological, cultural and economic terms. The Barker Inlet comprises <strong>of</strong> the coastalestuary <strong>of</strong> the <strong>Port</strong> <strong>Adelaide</strong> River, with two islands (Torrens Island and Garden Island). The <strong>Port</strong>waterways consist <strong>of</strong> the <strong>Port</strong> <strong>Adelaide</strong> River, North Arm, North Arm Creek, Angas Inlet and BarkerInlet.<strong>Estuaries</strong> such as the <strong>Port</strong> <strong>Adelaide</strong> River and Barker Inlet are semi-enclosed bodies <strong>of</strong> water, wherethe sea begins to mix with urban land run<strong>of</strong>f, changing salinity gradients due to tidal exchanges.<strong>Estuaries</strong> are a particularly sensitive part <strong>of</strong> marine and coastal environments. They act as transitionzones between the land and the sea, where fresh and salt water meet and mix. Due to this processtidal areas also act as filters and channels for the pollutants and nutrients that run <strong>of</strong>f the land and intothe marine environment (DEH 2006).The Barker Inlet and St Kilda wetlands have been identified as wetlands <strong>of</strong> national importance(Australian Nature Conservation Agency 1996) and encompass the coastal waters, fringingmangroves, tidal creeks and adjoining wetlands and saltfields from St Kilda to Outer Harbor.The area is rich in history as a working port, and is also a popular recreation location. Over the yearsthe area has been host to a number <strong>of</strong> large industries including coal handling facilities, two electricitygenerating plants (Torrens Island and Pelican Point), cement works, salt harvesting, a sugar refinery,boat building facilities, major fuel storage depots, major sewage treatment plants (Bolivar and <strong>Port</strong><strong>Adelaide</strong>), chemical plants and rubbish dumps.Recent projects in the area include new residential and commercial development in the inner portarea, the <strong>Port</strong> <strong>Adelaide</strong> River Expressway including construction <strong>of</strong> a new bridge over the River, theLefevre Transport Corridor upgrade, and new marinas at Largs North and the Inner <strong>Port</strong> area.(Barker Inlet <strong>Port</strong> Estuary Committee (BIPEC), http://www.bipec.on.net/about.html)The seagrass and mangrove ecosystems <strong>of</strong> the Gulf St Vincent are <strong>of</strong> enormous ecological andeconomic importance, providing a basis for much <strong>of</strong> the region’s commercial and recreationalfisheries. Mangroves and shallow water seagrasses support a variety <strong>of</strong> juvenile fish and crustaceanspecies. The Barker Inlet system is home to a range <strong>of</strong> uncommon marine f<strong>au</strong>na including the pygmysquid (<strong>Adelaide</strong> and Mount L<strong>of</strong>ty Ranges Natural Resources Management Board 2006).The <strong>Port</strong> <strong>Adelaide</strong> River and Barker Inlet is a marine environment, not a freshwater system.Freshwater flows into the Inlet from a range <strong>of</strong> stormwater catchments; the water quality from thesecatchments is discussed in the chapter on Inland Waters.132
Coast & <strong>Estuaries</strong>Barker Inlet & <strong>Port</strong> <strong>Adelaide</strong> River Environmental IndicatorsState Indicator:• Water quality & sediment classification <strong>of</strong> <strong>Port</strong> <strong>Adelaide</strong> River-Barker Inlet Waterways.• Results <strong>of</strong> monitoring <strong>of</strong> Heavy Metals and PCB’s in Dolphins, Sediments and Fish <strong>of</strong> the <strong>Port</strong><strong>Adelaide</strong> River.• Results <strong>of</strong> KE<strong>SA</strong>B community monitoring in the <strong>Port</strong> <strong>Adelaide</strong> River.Pressure Indicator:• Ecosystem decline <strong>of</strong> mangroves, seagrasses and saltmarsh (by %).• C<strong>au</strong>lerpa taxifolia growth in the upper <strong>Port</strong> <strong>Adelaide</strong> River.• C<strong>au</strong>lerpa taxifolia growth in the <strong>Port</strong> <strong>Adelaide</strong> River/Barker Inlet.• Introduced marine species identified in the <strong>Port</strong> <strong>Adelaide</strong> area.Response Indicator:• Reduction in nutrient loads discharged to the <strong>Port</strong> <strong>Adelaide</strong> River- Barker Inlet.Barker Inlet & <strong>Port</strong> <strong>Adelaide</strong> River – State & PressuresEcology <strong>of</strong> the EstuaryThe protection <strong>of</strong> the ecological significance <strong>of</strong> the estuary is the aim <strong>of</strong> a number <strong>of</strong> reserves andsanctuaries that exist in the area. The Barker Inlet St Kilda Aquatic Reserve (2055 ha), the TorrensIsland Conservation Reserve (79 ha), <strong>Port</strong> Gawler Conservation Park (418 ha), St Kilda/ChapmanCreek Aquatic Reserve*(870 ha) and the Dolphin Sanctuary (*<strong>Port</strong> Gawler Conservation Park and StKilda/Chapman Creek Aquatic Reserve are not in the <strong>City</strong> <strong>of</strong> <strong>Port</strong> <strong>Adelaide</strong> <strong>Enfield</strong> area).These protected areas have been established to help preserve important local habitats such as lowlyingdunes and chenier ridges, supratidal flats, intertidal mangrove woodlands, intertidal mud andsand flats, tidal channels and sub-tidal seagrass meadows (EPA,2005).Despite these areas being designated as reserves, there are no management plans in place to guidemanagement <strong>of</strong> these areas. The Dolphin Sanctuary is the exception, with a management planrecently developed.Barker Inlet St Kilda Aquatic ReserveThis area is designated by Primary Industries and Resources South Australia (PIR<strong>SA</strong>) as the ‘BarkerInlet St Kilda Aquatic Reserve’ and is the largest and most ecologically significant reserve within theCouncil area.This reserve was established for the conservation <strong>of</strong> mangrove-seagrass communities and for theprotection <strong>of</strong> nursery areas for several species, including the western king prawn (Pene<strong>au</strong>slatisulcatus), King George Whiting (sillaginodes punctata), yellow fin whiting (Sillago schomburgkii)and blue swimmer crabs (<strong>Port</strong>unus pelagicus).(http://www.pir.sa.gov.<strong>au</strong>/byteserve/fisheries/rec_fishing/pdf/barker_inlet_st_kilda.pdf).Activities that are permitted in the area are boating and removal <strong>of</strong> fish by rod and line or handline,and the collection <strong>of</strong> blood worms for bait by the use <strong>of</strong> a hand net. The collection or removal <strong>of</strong> anyother marine organisms is prohibited.133
Coast & <strong>Estuaries</strong>Bird HabitatThe Barker Inlet forms part <strong>of</strong> the international migratory bird treaties. 57 species <strong>of</strong> waterbirds havebeen recorded in the area: 12 are listed under international treaties. Significant breeding habitats for18 species <strong>of</strong> waterbirds including; pelicans, cormorants, oystercatchers, gulls, terns, egrets andherons (Barker Inlet <strong>Port</strong> Estuary Committee (BIPEC), http://www.bipec.on.net/about.html).The tidal mudflats are likely to provide significant habitat for wading birds covered under the ‘Japan-Australia Migratory Bird Agreement’ (JAMBA) and ‘China Australia Migratory Bird Agreement’(CAMBA). The mangrove areas on Torrens Island provide one <strong>of</strong> the few breeding areas for the littleegret and rufous night heron in South Australia (EPA,2005).Mangroves, Seagrass and SaltmarshThe estuary contains the largest area <strong>of</strong> mangrove forest, shallow seagrasses and mudflats in Gulf StVincent. Sheltered conditions and good light penetration create very high levels <strong>of</strong> plant and animalproduction making these prime contributors to the ecology <strong>of</strong> the gulf and major nursery habitats forjuvenile species <strong>of</strong> commercial fish and crustaceans, particularly juvenile Western king prawns andKing George whiting (EPA, 2005).Seagrasses are ecologically important, providing plant production in the estuary, they support fishf<strong>au</strong>na and the growth <strong>of</strong> other organisms, <strong>of</strong>fer protection from predators, provide an importantfeeding habitat for birds and assist in stabilising sediments (DEH, 2006).Mangroves are major primary producers for the inter-tidal area, they assist movement <strong>of</strong> fish at hightide, provide shelter and nesting sites for birds, provide a major role in the balance between erosionand deposition <strong>of</strong> sediments along the coast and create clearer water (DEH, 2006).The Dolphin SanctuaryA major feature <strong>of</strong> the <strong>Port</strong> <strong>Adelaide</strong> River and environs are the dolphins. There are 25 to 30bottlenose dolphins known to frequent the area, and around 250 bottlenose dolphins have beenrecorded in the area.South Australia is home to the common bottlenose dolphin, the indo-pacific bottlenose dolphin andthe short-beaked common dolphin. The indo-pacific bottlenose dolphin is the resident species <strong>of</strong> the<strong>Port</strong> <strong>Adelaide</strong> River and Barker Inlet.In June 2005 the <strong>Adelaide</strong> Dolphin Sanctuary Act 2005 was proclaimed. The object <strong>of</strong> the Act is toprotect the dolphins and their habitat. This legislation sets out the boundary <strong>of</strong> the Sanctuary (Map 22page 165) and arrangements for the management <strong>of</strong> the species in this area. The Act requires aManagement Plan to be developed within the first twelve months <strong>of</strong> the Act’s operation.The dolphin sanctuary aims to promote the importance <strong>of</strong> the area as habitat for the resident andvisiting dolphins, and to develop improved management strategies for threats to the dolphins and theirenvironment. Examples <strong>of</strong> threats and impacts to be addressed include poor water quality and otherforms <strong>of</strong> pollution, introduced marine pests, harassment to the dolphin population via boat strikes,stabbings, shootings, entanglements, noise disturbance, loss <strong>of</strong> habitat and non-compliance withexisting regulations (<strong>Gov</strong>ernment <strong>of</strong> South Australia, 2002). <strong>Adelaide</strong> Dolphin Sanctuary rangers nowpatrol the land and water <strong>of</strong> the sanctuary. These rangers also work with <strong>of</strong>ficers from Transport <strong>SA</strong>,PIR<strong>SA</strong> - Fisheries and the EPA to make sure that activities they regulate such as fishing practices,boat activities and regulation <strong>of</strong> industrial discharges do not pose unacceptable risks to the dolphins.(Source: Barker Inlet <strong>Port</strong> Estuary Committee (BIPEC), http://www.bipec.on.net/about.html)134
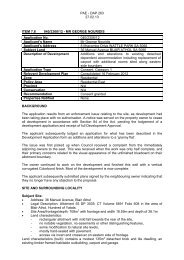
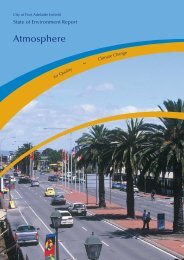
Coast & <strong>Estuaries</strong>Water QualityThe water quality <strong>of</strong> the <strong>Port</strong> <strong>Adelaide</strong> River is known to be degraded. The major c<strong>au</strong>ses <strong>of</strong> pollutionare considered to be the industrial activities that operate along the river, the wharf and shippingactivities, and stormwater from large catchments <strong>of</strong> the North Western section <strong>of</strong> <strong>Adelaide</strong> (see InlandWaters for details <strong>of</strong> catchments that discharge to the <strong>Port</strong> <strong>Adelaide</strong> River). Another potential source<strong>of</strong> pollution is the landfills in the area, on Garden Island and Wingfield (both closed). Figure 28 (page164) shows the locations <strong>of</strong> major activities and discharges.Since the 2000 State <strong>of</strong> Environment the first attempt at a holistic study in the <strong>Port</strong> Waterways hascommenced. The EPA <strong>Port</strong> Waterways Water Quality Improvement Plan (WQIP) is a two stageprogram to research and identify environmental values, water quality issues, river flow objectives,establish pollutant loads, sources, requirements and including time frame to attain and maintain thewater quality objectives.Essentially WQIPs are documents that detail strategies for water quality improvement, addressing arange <strong>of</strong> pollution inputs to an area and enabling stakeholders to agree on outcomes and theprocesses for achieving them. The draft WQIP (November 2006) is limited in scope to the nutrientsnitrogen and phosphorus.As reported in the <strong>Port</strong> Waterways Water Quality Improvement Plan (EPA,2005), several studiesindicate that the Barker Inlet-<strong>Port</strong> <strong>Adelaide</strong> River system demonstrates clear signs <strong>of</strong> seriousenvironmental stress and ecosystem decline. The principle water quality issues are:• nutrient enrichment (nitrogen and phosphorus) and the proliferation <strong>of</strong> algal growth.• toxic algal blooms, the largest stretching some 30km north from the inlet.• microbiological contamination, which may comprise recreational use.• toxicant contamination (such as heavy metals) in some areas <strong>of</strong> waters and sediments.Current water quality statusThe EPA undertake an ambient water quality monitoring program in coastal areas. The most recentEPA water quality data available, as discussed in the <strong>Port</strong> Waterways WQIP November 2006, issummary data from 1996 to 2000. There are 9 monitoring sites including Inner Harbor, North Arm,Barker Inlet and Outer Harbor. Ambient water quality and sediment analysis was undertaken. Thewater quality indicators used to describe the water quality condition are nutrients, heavy metals,bacteria and turbidity.State Indicator: Water quality & sediment classification <strong>of</strong> <strong>Port</strong> <strong>Adelaide</strong> River-Baker InletWaterwaysAs shown in Figure 21:• A poor heavy metal classification for ecosystem protection was given in locations 1,2,4,7,8and 9.• A majority <strong>of</strong> locations were classified with a poor microbiological rating mainly due to algalblooms.• Locations 5,6,7,8 and 9 were classified with a poor rating for organochlorine pesticides forprimary recreation.As shown in Figure 22:• 8 <strong>of</strong> the sediment survey locations were severely impacted by heavy metals.135
Coast & <strong>Estuaries</strong>Figure 21: <strong>Port</strong> <strong>Adelaide</strong> River- Barker Inlet Waterways, Water Quality ClassificationSource: <strong>Port</strong> Waterways Water Quality Improvement Plan Stage 1, Fig 5 pg 13, EPA June 2005136
Coast & <strong>Estuaries</strong>Figure 22: <strong>Port</strong> <strong>Adelaide</strong> River- Barker Inlet Waterways, Sediment ClassificationSource: <strong>Port</strong> Waterways Water Quality Improvement Plan Stage 1, Fig 6 pg 14, EPA June 2005137
Coast & <strong>Estuaries</strong>The most recent summary water quality classification is for October 2005 to March 2006.Table 26: <strong>Port</strong> <strong>Adelaide</strong> River – Barker Inlet waterways water quality classification – October 2005 –March 2006Indicator Ecosystem Recreation AquacultureAmmonia Poor NA GoodOxidised Nitrogen Poor NA NATotal Nitrogen Good NA NATotal Phosphorus Moderate NA NATurbidity Good Moderate NAChlorophyll a Moderate NA NAHeavy Metals Poor NA PoorBacteria NA Good GoodNA = not applicableAmmonia, nitrogen and Chlorophyll (a) were classified as poor and soluble phosphorus was elevatedat Site 9. This is likely due to the industrial discharges <strong>of</strong> Penrice Soda Products, historicalcontamination from the now closed <strong>Port</strong> <strong>Adelaide</strong> Wastewater Treatment Plant and the large number<strong>of</strong> stormwater drains that discharge into the <strong>Port</strong> waterways.Heavy metals (copper and zinc) are classified as resulting in a poor rating and may also beattributable to historic and ongoing industrial and urban stormwater discharges (heavy metals onroads) to the river.Elevated turbidity levels were likely as a result <strong>of</strong> dredging in the <strong>Port</strong> <strong>Adelaide</strong> River channel duringthe sampling period.(source: http://www.epa.sa.gov.<strong>au</strong>/all_port.html )Ammonia as a toxicantThe Penrice Soda Products plant at Osborne has discharged large quantities <strong>of</strong> ammonia into the<strong>Port</strong> <strong>Adelaide</strong> River for many years (EPA, 2005). With improved environmental knowledge, thispractice is now unacceptable and Penrice now manage their lime wastes onsite and are investigatingre-use opportunities.A small fraction <strong>of</strong> the total ammonia present in the water column will be present as the unionisedform (NH 3 ), this form can have toxic effects on marine organisms such as fish, invertebrates, algaeand plants.Figure 21 shows the extent <strong>of</strong> ammonia pollution within the <strong>Port</strong> <strong>Adelaide</strong> River, sites 1,2,4,5,6,7 and9 were classified by the EPA as poor, exceeding the 90 th percentile ANZECC trigger values forpotential toxicity, with sites 3 and 8 moderate. Sites 1 and 9, located within the <strong>Port</strong> <strong>Adelaide</strong> River,had significantly higher concentrations than other locations. The level <strong>of</strong> ammonia within the <strong>Port</strong><strong>Adelaide</strong> River remains a concern (EPA, 2005).The implementation <strong>of</strong> the ammonia reduction Environment Improvement Program at Penrice SodaProducts has resulted in an 18% reduction in the discharge <strong>of</strong> ammonia (EPA, 2005).138
Coast & <strong>Estuaries</strong>Nutrient loads – Nitrogen and PhosphorusStudies into the environmental status <strong>of</strong> the waterways consistently report that nutrients, particularlynitrogen and phosphorus are the key pollutants throughout the waterways.There are two main point sources that contribute to the 1538 t / year <strong>of</strong> nitrogen (N) and 258 t / year <strong>of</strong>phosphorus (P) loads to the waterways. These are Penrice Soda Products (820 t / year N) (nitrogenbeing a key component <strong>of</strong> ammonia) and the Bolivar Wastewater Treatment Plant (477 t / year P).Response Indicator: Reduction in nutrient loads discharged to the <strong>Port</strong> <strong>Adelaide</strong> River-BarkerInletTable 27: Percentage nutrient reduction from <strong>Port</strong> <strong>Adelaide</strong> Wastewater Treatment Plant (WWTP)Year Reduction total N (from 1994loads)Reduction total P (from 1994loads)2002-2003 64% 35%2006-2007 100% 100%2010-2011 100% 100%The redirection <strong>of</strong> the pumping line from <strong>Port</strong> <strong>Adelaide</strong> WWTP to Bolivar resulted in a significantdecrease in the load <strong>of</strong> nutrients discharged to the <strong>Port</strong> <strong>Adelaide</strong> River, the completion <strong>of</strong> the transferfrom <strong>Port</strong> <strong>Adelaide</strong> to Bolivar will reduce nutrient discharges from the <strong>Port</strong> <strong>Adelaide</strong> site to zero.Table 28: Percentage nutrient reduction from Bolivar WWTPYear Reduction total N (from 1994loads)Reduction total P (from 1994loads)2002-2003 70% 40%2006-2007 63% 33%2010-2011* 75% 53%* predicted reductionsThe dissolved air flotation and filtration plant (DAFF) plant at Bolivar WWTP and the Virginia PipelineReuse Scheme has resulted in significant reduction in the nutrient load entering the gulf from BolivarWWTP. The combined impact <strong>of</strong> these improvements is predicted to further reduce nitrogen andphosphorus loads.Table 29: Percentage nutrient reduction from PenriceYear Reduction total N (from 2002loads)Reduction total P (from 2002loads)2002-2003 18% Negligible2006-2007* 35% Negligible2010-2011* 40% Negligible* predicted reductions139
Coast & <strong>Estuaries</strong>Improvements to operations at Penrice as stipulated by EPA licensing conditions are expected toresult in a predicted reduction <strong>of</strong> up to 40% for total nitrogen load. Total phosphorus load is expectedto remain constant at around three tonnes per annum.(Source: http://www.epa.sa.gov.<strong>au</strong>/pdfs/pw_plan.pdf)Community Monitoring - KE<strong>SA</strong>BCommunity monitoring is coordinated by the KE<strong>SA</strong>B Patawalonga and Torrens Waterwatch groupsthrough the Snapshots program. The majority <strong>of</strong> Waterwatch sites are located along the <strong>Port</strong><strong>Adelaide</strong> River; the results relating to freshwater sites are discussed in the chapter on Inland Waters.140
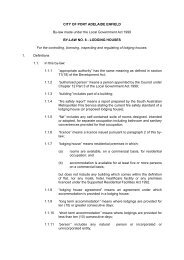
Coast & <strong>Estuaries</strong>State Indicator: Results <strong>of</strong> KE<strong>SA</strong>B community monitoring within the <strong>Port</strong> <strong>Adelaide</strong> RiverFigure 23: KE<strong>SA</strong>B Waterwatch Sites – Marine Sites in the <strong>City</strong> <strong>of</strong> <strong>Port</strong> <strong>Adelaide</strong> <strong>Enfield</strong>Site DetailsANI050Angus InletGarden Island YachtClubMUT050Mutton CoveVitas KarnaitisPOR010<strong>Port</strong> <strong>Adelaide</strong> River(wastewater outlet)Le Fevre High SchoolPOR015<strong>Port</strong> <strong>Adelaide</strong> River,Hack St outfallHarborside Quaycommunity groupPOR016<strong>Port</strong> <strong>Adelaide</strong> RiverMinories CommunityGroupPOR020Mangrove Cove<strong>Port</strong>side ChristianSchoolPOR025<strong>Port</strong> <strong>Adelaide</strong> River atKaratta DockDolphin WomanPOR030<strong>Port</strong> <strong>Adelaide</strong> River,BirkenheadLe Fevre PeninsulaPrimary SchoolPOR040<strong>Port</strong> <strong>Adelaide</strong> River,BirkenheadLe Fevre PeninsulaPrimary SchoolPOR050Snowdens BeachOceanview CollegePOR065Snowdens BeachOceanview CollegeOnly two samples 2004POR070<strong>Port</strong> <strong>Adelaide</strong> RiverNew Haven PrimarySchoolOnly two samples 20052001 2002 2003 2004 2005PNTpHPNTpHPNTpHAlAmPNTpHAlAmPNTpHAlAm1 3 11 1 1 1 32 1 1 3 4 2 31 1 1 1 6 3 4 22 3 32 1 2 1 6 2 233 11 111 2 12 3 2141
Coast & <strong>Estuaries</strong>Good (for all samples taken)2 Poor (number indicates how many samples had poor result)Not monitored6 Snapshot Events per year in March, May, June, Aug, Sept, Oct/Nov. Not all groups will havemonitored every Snapshot event in every year.Results RatingTurbidity: Good < 5 NTU; Poor > 25 NTUNitrate: Good < 1 mg/L N; Poor = or > 1 mg/L NOrtho Phosphate: Good < 0.1 mg/L P; Poor > 1 mg/L PpH: Good pH 6.5-9.2; Poor < 6.5 > 9.2Ammonium: Good < 0.5 mg/L; Poor > 0.5 mg/LAlkalinity: Good 90-120mg/L calcium carbonate; Poor 120 mg/L• A higher incidence <strong>of</strong> poor samples were recorded from the <strong>Port</strong> <strong>Adelaide</strong> River, Hack St outfallwith a total <strong>of</strong> 19 poor samples, followed by the <strong>Port</strong> <strong>Adelaide</strong> River, waste water outlet andMangrove Cove with 16 poor samples each during the sampling period.• Very high levels <strong>of</strong> nitrate and phosphate were recorded at several locations in 2003 and 2004indicating a local source <strong>of</strong> nutrients entering the estuarine system.Sample Location: POR020, Mangrove CoveSource: KE<strong>SA</strong>B Waterwatch: http://www.cwmb.sa.gov.<strong>au</strong>/kwc/programs/water_monitoring.htmImpacts on Marine EcologiesThe EPA have noted a serious and continuing decline in the marine ecosystems in the region,particularly in the loss <strong>of</strong> seagrasses and mangroves. Nutrient levels especially nitrogen, isconsidered to be a principle factor in the ecosystem design. Development and industrial land use isalso an important contributing factor in changes to the distribution <strong>of</strong> biological communities in the<strong>Port</strong> waterways (EPA, 2005).Mangroves, Seagrass and SaltmarshThe seagrass, mangroves and saltmarsh <strong>of</strong> the <strong>Port</strong> <strong>Adelaide</strong> River have been degraded over time bypollution (particularly effluent outfall) and development.142
Coast & <strong>Estuaries</strong>Pressure Indicator: Ecosystem decline <strong>of</strong> mangroves, seagrasses and saltmarsh (by %)Figure 24 depicts the ecosystem decline showing the condition <strong>of</strong> mangroves, seagrasses andsaltmarsh.There has been extensive loss <strong>of</strong> seagrasses in the northern part <strong>of</strong> the <strong>Port</strong> <strong>Adelaide</strong> River environs(north <strong>of</strong> Outer Harbor) due to effluent outfall and nutrient enrichment <strong>of</strong> the waters, it is estimatedthat since 1954 approximately 36.4% <strong>of</strong> the subtidal seagrasses have been lost, much greater thanexpected from natural changes. This subsequently has detrimental impacts on fish nurseries. Inaddition since 1954 it is estimated that approximately 25% <strong>of</strong> mangroves and 80% <strong>of</strong> samphires havebeen lost due to development (Kinhill Sterns, 1985).Monitoring has indicated that the growth <strong>of</strong> the weed Ulva (large nutrient-induced epidphytes) hasc<strong>au</strong>sed death rates <strong>of</strong> young mangrove seedlings <strong>of</strong> 67% (significantly greater than occurs naturally).Recognition <strong>of</strong> the ecological value <strong>of</strong> mangroves and seagrasses has taken precedence over that <strong>of</strong>saltmarshes, with little scientific work available on South Australian saltmarshes resulting in 80% <strong>of</strong>this habitat being lost in the Barker Inlet-<strong>Port</strong> <strong>Adelaide</strong> River region.C<strong>au</strong>lerpa taxifoliaC<strong>au</strong>lerpa taxifolia is a pest weed that has colonised in the waters <strong>of</strong> West Lakes and <strong>Port</strong> <strong>Adelaide</strong>River. A significant concern is the potential spread <strong>of</strong> the weed as a result <strong>of</strong> the ample nutrientsupply. It was first discovered in West Lakes in 2002, and was successfully removed by fresh waterflushing <strong>of</strong> the lakes.The weed was also discovered in the <strong>Port</strong> <strong>Adelaide</strong> River, and attempts have been made to eradicatethe weed using salt, chlorination and suction. Despite this, colonisation has occurred around GardenIsland into Eastern Passage, North Arm and the southern end <strong>of</strong> Barker Inlet. The further spread <strong>of</strong>this weed has been attributed to the 2004/05 long hot summer and mild start to winter.C<strong>au</strong>lerpa taxifolia is a bright green seaweed with main stems that can grow up to three metres longwith up to 200 fronds growing <strong>of</strong>f these stems that look like feathers or ferns. It can grow up to 25mma day and spreads by itself. New infestations start by dispersion <strong>of</strong> tiny plant fragments and are alsothought to spread via the release <strong>of</strong> spores. C<strong>au</strong>lerpa is a tropical species and its ideal habitat iswarmer waters, but the strain invading the <strong>Port</strong> <strong>Adelaide</strong> River is capable <strong>of</strong> surviving and thriving innon-tropical waters. Anchoring <strong>of</strong> vessels helps to spread the weed.C<strong>au</strong>lerpa taxifolia spreads quickly over the sea floor and takes over areas <strong>of</strong> native species such asseagrass. It is a very real threat to the seagrass meadows <strong>of</strong> Gulf St Vincent . When it takes overthis flora, it destroys fish nurseries and fish habitat. Fish do not eat C<strong>au</strong>lerpa taxifolia bec<strong>au</strong>se itcontains a toxin that is distasteful to them.PIR<strong>SA</strong> and <strong>SA</strong>RDI Aquatic Sciences are continuing to monitor and attempt to manage and eradicateC<strong>au</strong>lerpa taxifolia in the <strong>Port</strong> <strong>Adelaide</strong> River. This includes divers controlling high risk areas, anddeveloping dredging plans. There is currently in force a ban on anchoring in most <strong>of</strong> the <strong>Port</strong><strong>Adelaide</strong> River to prevent spread <strong>of</strong> the weed, the ban exists from snapper point (Outer Harbor)running the length <strong>of</strong> the <strong>Port</strong> <strong>Adelaide</strong> River and up to the middle ground beacon (Inner) <strong>of</strong> theBarker Inlet/Torrens Reach.143
Coast & <strong>Estuaries</strong>Figure 24: <strong>Port</strong> <strong>Adelaide</strong> River- Barker Inlet Waterways, Sediment ClassificationSource: <strong>Port</strong> Waterways Water Quality Improvement Plan Stage 1, Fig 7 pg 27, EPA June 2005144
Coast & <strong>Estuaries</strong>Figure 25: C<strong>au</strong>lerpa Infestation Areas in the <strong>Port</strong> <strong>Adelaide</strong> RiverSource: reproduced with written permission from <strong>Gov</strong>ernment <strong>of</strong> South Australia, PIR<strong>SA</strong>145
Coast & <strong>Estuaries</strong>Pressure Indicator: C<strong>au</strong>lerpa taxifolia growth in the upper <strong>Port</strong> <strong>Adelaide</strong> RiverIn March and April 2002 distribution surveys <strong>of</strong> the extent <strong>of</strong> the C<strong>au</strong>lerpa taxifolia infestation in the<strong>Port</strong> <strong>Adelaide</strong> River were conducted, these observations found a significant population <strong>of</strong> the alga,particularly northwards <strong>of</strong> the Railway and Jervois Bridges, with further small patches and singleplants extending as far as the Birkenhead Bridge (refer to Figure 26). Eradication measures wereundertaken to manually eradicate and control the spread. Despite these efforts by the end <strong>of</strong>December 2003 large areas <strong>of</strong> healthy C.taxifolia remained in the upper <strong>Port</strong> <strong>Adelaide</strong> River and anoutbreak in southern Barker Inlet indicated that the C<strong>au</strong>lerpa population in the upper <strong>Port</strong> <strong>Adelaide</strong>River was not fully contained.In follow up to this work, surveys <strong>of</strong> the upper <strong>Port</strong> <strong>Adelaide</strong> River were conducted in January andFebruary 2004 to determine changes in the distribution <strong>of</strong> C.taxifolia. In 2004 C.taxifolia in the upper<strong>Port</strong> <strong>Adelaide</strong> River is spread over two main areas, one mostly south <strong>of</strong> Jervois Bridge and a secondarea parallel to shore upstream <strong>of</strong> the Birkenhead Bridge (refer to Figure 27). The combined areacovered is approximately estimated to between 9-12ha (blue and pink shaded areas on Figure 27)although this includes potentially large bare areas.There were some differences in the distribution from the 2002 survey to the 2004 survey. However itshould be noted due to differences in survey methods and environmental constraints, comparison isproblematic. A large shallow zone <strong>of</strong> patchy weed observed in 2002 to the north <strong>of</strong> the Railway Bridgewas not present in 2004, otherwise the distribution in 2004 roughly correlates with that observed in2002, indicating that the eradication measures employed in this area have been ineffective.Pollution inputs to the <strong>Port</strong> <strong>Adelaide</strong> River included annual doses <strong>of</strong> 68 tonnes <strong>of</strong> phosphorus and(previously) 460 tonnes <strong>of</strong> nitrogen by the <strong>Port</strong> <strong>Adelaide</strong> sewage treatment works (now diverted toBolivar), as well as significant heavy metal contamination from various industrial and diffuse sources.This places pressure on native plant growth to compete with and combat the weed infestation (EPA,2002).Photo <strong>of</strong> C<strong>au</strong>lerpa taxifolia (Source: PIR<strong>SA</strong> - Environmental Issues - C<strong>au</strong>lerpa Taxifolia)146
Coast & <strong>Estuaries</strong>Figure 26: Map <strong>of</strong> upper <strong>Port</strong> <strong>Adelaide</strong> River showing the distribution <strong>of</strong> C<strong>au</strong>lerpa taxifolia inMarch/April 2002(Figures 26, 27, 28; Source: Westphalen et al 2004, reproduced with written permission from <strong>SA</strong>RDI)Figure 27: Map <strong>of</strong> upper <strong>Port</strong> <strong>Adelaide</strong> River showing distribution <strong>of</strong> C<strong>au</strong>lerpa taxifolia in January –February 2004147
Coast & <strong>Estuaries</strong>Pressure Indicator: C<strong>au</strong>lerpa taxifolia growth in the <strong>Port</strong> <strong>Adelaide</strong> River/Barker InletThere have been four broad-scale surveys <strong>of</strong> the <strong>Port</strong> <strong>Adelaide</strong> River/Barker Inlet region since thediscovery <strong>of</strong> C.taxifolia The first in March – April 2002 included the upper <strong>Port</strong> <strong>Adelaide</strong> River.Following surveys excluded this area and were undertaken in February 2003, June 2003 andFebruary-April 2004.Three outbreaks were documented over the survey periods, refer to Figure 28 (A,B,C). <strong>SA</strong>RDIindicate that there is a correlation between these outbreaks and the activities <strong>of</strong> recreational fishers,and that these infestations are likely to be the result <strong>of</strong> fragments <strong>of</strong> C.taxifolia being transported onfishing equipment.Further large scale follow up surveys <strong>of</strong> the <strong>Port</strong> <strong>Adelaide</strong> River/Barker Inlet are highly recommendedto ensure that small ongoing pockets <strong>of</strong> plants remain contained and that other outbreaks can beidentified.Figure 28: The junctions between the <strong>Port</strong> <strong>Adelaide</strong> River, Barker Inlet, Angus Inlet and North Armshowing the location <strong>of</strong> the C<strong>au</strong>lerpa taxifolia outbreaksAlgal blooms – red tidePhytoplankton blooms commonly known as ‘red tides’, are a common occurrence in the <strong>Port</strong> <strong>Adelaide</strong>River estuary. Aside from presenting possible health risks, major ecological problems can result, suchas dense microalgae c<strong>au</strong>sing oxygen depletion in the water column and consequent death <strong>of</strong> fish andinvertebrate f<strong>au</strong>na (Cannon, 1991).148
Coast & <strong>Estuaries</strong>Within the <strong>Port</strong> <strong>Adelaide</strong> River large quantities <strong>of</strong> bioavailable nutrients support the development <strong>of</strong>the bloom.ToxicantsThe State <strong>of</strong> Environment 2000 referred to a toxicological study undertaken by the Australian DolphinResearch Foundation in 1998 to determine if polychlorinated biphenyls (PCB’s) were present inmussels and fish taken from the <strong>Port</strong> <strong>Adelaide</strong> River. The report findings (Bossley and Burzacott1999) failed to detect PCBs in any <strong>of</strong> the mussel samples, however did find low levels <strong>of</strong> PCBs in one<strong>of</strong> the five fish sampled. At the time <strong>of</strong> the study two bottlenose dolphins were found dead and wereincluded in the study. Blubber samples were analysed, the younger dolphin was found to have highPCB levels (5-6mg/kg and the older dolphin low levels (less than 1mg/kg). A liver sample from theyounger dolphin was tested for mercury with a level 465mg/kg found. In a subsequent media releaseit was stated that “an <strong>Adelaide</strong> dolphin has been found to have the highest level <strong>of</strong> mercurycontamination ever recorded in a bottlenose dolphin anywhere in the world” (Bossley 1999).Following on from this study a survey on the <strong>Port</strong> <strong>Adelaide</strong> River by the EPA was conducted in 2000,monitoring <strong>of</strong> heavy metals and PCBs in dolphins, sediment and fish. Analysis <strong>of</strong> tissue samples fromdolphins is a useful means <strong>of</strong> determining whether accumulative toxicants including heavy metals,such as mercury and cadmium, and chlorinated organics compounds such as PCBs, are present insignificant amounts in the environment. Analysis <strong>of</strong> <strong>Port</strong> <strong>Adelaide</strong> River dolphins which have spent asubstantial proportion <strong>of</strong> their life on the estuary can indicate the presence <strong>of</strong> localised pollutionproblems.Tissue samples were analysed from 15 bottlenose dolphins, liver tissue tested for mercury, kidneytested for cadmium and blubber tested for PCBs. Sediment samples were taken from 26 sites in andaround the estuary, samples were analysed for heavy metals and PCBs. Fish were c<strong>au</strong>ght from the<strong>Port</strong> <strong>Adelaide</strong> River and tested for mercury, cadmium and lead to determine if they complied with theFood Standards Code.State Indicator: Results <strong>of</strong> monitoring <strong>of</strong> Heavy Metals and PCB’s in Dolphins, Sediments andFish <strong>of</strong> the <strong>Port</strong> <strong>Adelaide</strong> River.Dolphins• PCB levels in blubber samples from dolphins found in the vicinity <strong>of</strong> the <strong>Port</strong> <strong>Adelaide</strong> Riverwere substantially higher than dolphins at other sites around the state.• Mercury levels found in liver samples from <strong>Port</strong> <strong>Adelaide</strong> River dolphins were not unusualwhen compared to State, and cadmium levels were lower.Sediment• 17 <strong>of</strong> the 26 sites sampled had high lead and zinc concentrations, the source likely to be roadrun<strong>of</strong>f and historic industrial waste disposal to the <strong>Port</strong> <strong>Adelaide</strong> River).• Copper was found in high levels at five sites and nickel at one site, these sites were adjacentto ship or boat building/repair activities.• Elevated levels <strong>of</strong> mercury were found in 5 sites.Fish• Levels <strong>of</strong> mercury, cadmium and lead tested in fish c<strong>au</strong>ght from the <strong>Port</strong> <strong>Adelaide</strong> River metthe food standards and were safe to eat.(source: http://www.epa.sa.gov.<strong>au</strong>/pdfs/dolphin.pdf)In response to these findings the EPA has undertaken an <strong>au</strong>dit <strong>of</strong> industries in the area in order tolocate the source <strong>of</strong> PCB and mercury pollution, investigate ways <strong>of</strong> reducing these toxics from149
Coast & <strong>Estuaries</strong>entering the river, and review the practices <strong>of</strong> shipyards and marinas to reduce pollution from theseindustries. Road run<strong>of</strong>f was also identified as an area requiring further investigation <strong>of</strong> strategies tostop pollutants such as lead and zinc from entering the river via stormwater discharge.Thermal DischargeSeveral facilities in and around the <strong>Port</strong> <strong>Adelaide</strong> River release hot water as a result <strong>of</strong> industrialprocesses, including the Pelican Point, Torrens Island and Osborne power stations. Due to the largevolume <strong>of</strong> water present the impact <strong>of</strong> thermal discharges may be localised as overall backgroundtemperatures are not significantly altered by thermal discharge.However further investigation into the impacts on f<strong>au</strong>na and flora in the area is required. One studyconducted near the Torrens Island thermal outfall indicated that near the point <strong>of</strong> discharge somespecies <strong>of</strong> intertidal animals had reduced in population or had been eliminated, while other previouslyrare or absent species had become more common (Thomas et. al., 1986). A more recent studysuggested that thermal discharge, in combination with elevated nutrient levels and increased algalgrowth, had contributed to reduced biomass and diversity <strong>of</strong> intertidal f<strong>au</strong>na in parts <strong>of</strong> the estuaryand altered the fish species composition (Jones et. al., 1996).Development <strong>of</strong> Barker Inlet and <strong>Port</strong> <strong>Adelaide</strong> RiverIncreasing development adjacent to and in marine water bodies and coastline, including housing,marinas and boat ramps, places significant pressure on delicate coastal and marine environments.If sited incorrectly marinas and boat ramps can disrupt sand movement, degrade habitat and waterquality, and disrupt the natural flows <strong>of</strong> coastal creeks and streams (Department <strong>of</strong> Environment andHeritage, 2006).The new <strong>Port</strong> Waterfront residential development is a significant new coastal development within the<strong>City</strong> <strong>of</strong> <strong>Port</strong> <strong>Adelaide</strong> <strong>Enfield</strong>. Approximately 2000 new residential dwellings will be built along the <strong>Port</strong><strong>Adelaide</strong> River, including direct water frontage dwellings. Increased stormwater discharges directlyinto the <strong>Port</strong> <strong>Adelaide</strong> River is a potential pressure, some <strong>of</strong> this impact will be mitigated though urbanstormwater planning, installation <strong>of</strong> rain water tanks and gross pollutant traps.The approved construction and operation <strong>of</strong> approximately 550 marina berths within the Inner Harborat <strong>Port</strong> <strong>Adelaide</strong>, has the potential to place significant pressure on the <strong>Port</strong> <strong>Adelaide</strong> River andassociated ecologies. The Coast Protection Board has raised several <strong>of</strong> these issues including, theincreased potential for C<strong>au</strong>lerpa taxifolia and C<strong>au</strong>lerpa racemosa to be dispersed through the marineenvironment via boats, the long-term cumulative effects <strong>of</strong> large boating facilities including ballastdischarges, accidental discharges, changes to flow regimes, and litter, and the impacts on dolphinsincluding habitat, water quality and direct harm. Pollutants <strong>of</strong> potential concern include petrol, sewage,household garbage and boat wash-down effluent.The EPA is providing advice to the development in regard to these issues.Dredging <strong>of</strong> the <strong>Port</strong> <strong>Adelaide</strong> RiverWork has been completed on deepening the channel at Outer Harbor from 12.2 metres to 14.2metres to accommodate large Panamax ships as part <strong>of</strong> the Flinders <strong>Port</strong>s development. Severalother one-<strong>of</strong>f or regular maintenance dredging occurs at various sites along the river. Dredging haspotential significant environmental consequences on benthic (living on or in sediments <strong>of</strong> the seafloor) flora and f<strong>au</strong>na and the re-distribution <strong>of</strong> exotic marine species.The long term effect <strong>of</strong> dredging activities is not well documented. Further research is required toinvestigate the impacts <strong>of</strong> dredging and recovery rates in specific locations and in various conditions.150
Coast & <strong>Estuaries</strong>A working <strong>Port</strong>The management <strong>of</strong> the <strong>Port</strong> and the Shipping Channel is through Flinders <strong>Port</strong>s. Flinders <strong>Port</strong>s runsthe seven South Australian <strong>Port</strong>s, which includes <strong>Adelaide</strong>, <strong>Port</strong> Giles, Klein Point, Wallaroo, <strong>Port</strong>Pirie, and Thevenard. Of these ports, <strong>Port</strong> <strong>Adelaide</strong> is the largest. Flinders <strong>Port</strong>s has berthing at twolocations, Inner Harbor and Outer Harbor.The distribution <strong>of</strong> key marine pests is a major impact <strong>of</strong> shipping on the marine environment.Shipping transports marine and estuarine organisms faster and over longer distances than previouslyencountered. Ballast water, hulls or anchor ropes <strong>of</strong> these vessels regularly transport marine pests.As a result the Commonwealth <strong>Gov</strong>ernment is considering listing this process as a Key ThreateningProcess under the Environment Protection and Biodiversity Conservation Act 1999 in order toregulate the threat.The most significant marine introduced pest in South Australia has been the invasive seaweedC<strong>au</strong>lerpa taxifolia prevalent within the <strong>Port</strong> <strong>Adelaide</strong> River area as previously discussed.Pressure Indicator: Introduced marine species identified in the <strong>Port</strong> <strong>Adelaide</strong> areaTable 30: Introduced marine species identified in <strong>Port</strong> <strong>Adelaide</strong> areaSpeciesC<strong>au</strong>lerpa taxifoliaSabella spallanzanii – European /Sabellid Fan WormCarcinas maenas – European Shore CrabCiona intestinalis – AscidianAlexandrium minutum - Din<strong>of</strong>lagellateBugula flabellate – Bryozoan (sea moss)Cassiopea nodrosia – Tropical jellyfishPerna canaliculus – New Zealand greenlip musselLocation<strong>Port</strong> <strong>Adelaide</strong> River, West LakesNorth Haven, West Lakes, <strong>Port</strong> <strong>Adelaide</strong> RiverBarker Inlet, Outer Harbor<strong>Port</strong> <strong>Adelaide</strong>, Outer Harbor<strong>Port</strong> <strong>Adelaide</strong> River<strong>Port</strong> <strong>Adelaide</strong> River, Outer Harbor, northern GulfSt Vincent<strong>Port</strong> <strong>Adelaide</strong> RiverOuter HarborSource: PIR<strong>SA</strong>, http://pir.sa.gov.<strong>au</strong>/pages/sus_res/mar_hab/pests.htmCoastal Acid Sulphate SoilsWithin the <strong>City</strong> <strong>of</strong> <strong>Port</strong> <strong>Adelaide</strong> <strong>Enfield</strong> acid sulphate soils exist in the Barker Inlet and <strong>Port</strong> <strong>Adelaide</strong>River environs and are discussed in more detail in the chapter on Land. Acid sulfate soils may formunder tidal conditions and can generally be expected in unmanaged low-lying coastal areas.Disturbance <strong>of</strong> these soils and exposure to air can mobilise sulfuric acid and c<strong>au</strong>se toxic run<strong>of</strong>f thatcan degrade the marine environment and result in fish kills and algal blooms.151
Coast & <strong>Estuaries</strong>Local ResponseThe conservation and protection <strong>of</strong> the <strong>Port</strong> Waterways involves a range <strong>of</strong> stakeholders includingcommunity groups, non government organisations, State <strong>Gov</strong>ernment, EPA, Council and localindustry. There have been numerous response actions, management plans and improvements to landmanagement and industrial practices (as discussed above) which have contributed to a moresustainable and healthier river system.Specifically the EPA is undertaking a targeted program to improve the long term water quality <strong>of</strong> theriver.The EPA commenced a study <strong>of</strong> the water quality <strong>of</strong> <strong>Port</strong> waterways in 2004 with the assistance <strong>of</strong>funding from the Federal <strong>Gov</strong>ernment. The study has led to the development <strong>of</strong> the <strong>Port</strong> <strong>Adelaide</strong>River Water Quality Improvement Plan (WQIP). This plan aims to reduce the quantity <strong>of</strong> nutrientsdischarged into the waterway.Significant research and modelling <strong>of</strong> water quality processes in the estuary provided data on thereductions in nutrient discharges from Penrice and <strong>SA</strong> Water (Bolivar Wastewater Treatment Plant)required to improve the water quality. This provided documented nutrient reduction targets to guidefuture planning. The necessary reductions are substantial and may be costly to implement, but isenvisaged to return very significant social, environmental and economic benefits to the region.The WQIP will be reviewed every 7 years. The review will include monitoring (and public reporting)the progress <strong>of</strong> nutrient reductions and improvements in water quality <strong>of</strong> the waterways.Recommendations & Data Gaps• Management Plans are developed for the Barker Inlet St Kilda Aquatic Reserve, the TorrensIsland Conservation Reserve, <strong>Port</strong> Gawler Conservation Park and St Kilda/Chapman CreekAquatic Reserve.• The EPA seek to address heavy metals and contaminants associated with industrial effluentwithin the <strong>Port</strong> Waterways Water Quality Improvement Plan as the next stage <strong>of</strong> the WQIPrather than focus solely on nutrient discharges.• Ongoing monitoring <strong>of</strong> C<strong>au</strong>lerpa taxifolia in the <strong>Port</strong> <strong>Adelaide</strong> River and broad-scale surveys <strong>of</strong>the Barker Inlet system is imperative given the continued discovery <strong>of</strong> plants at outbreak sites.Widespread surveys <strong>of</strong> the metropolitan coast are required particularly in areas popular withrecreational fishers.• Monitor and review the use <strong>of</strong> rock salt to control C<strong>au</strong>lerpa taxifolia infestations and othereradication options available.• The impacts <strong>of</strong> thermal discharge on f<strong>au</strong>na and flora <strong>of</strong> the <strong>Port</strong> <strong>Adelaide</strong> River require furtherinvestigation.• Environmental Impact Assessment and ongoing monitoring is recommended for the <strong>Port</strong>Waterfront development specifically the impact <strong>of</strong> the construction and operation <strong>of</strong>approximately 550 marina berths.• Research into the long term effects <strong>of</strong> dredging and ecological recovery rates in the <strong>Port</strong><strong>Adelaide</strong> River is required.152
Coast & <strong>Estuaries</strong>Gulf St Vincent & the CoastIntroductionThe coast <strong>of</strong> the Gulf St Vincent is home to approximately 95% <strong>of</strong> the State’s population, despite thevastness <strong>of</strong> the State’s coast line. The establishment <strong>of</strong> human population and development in thesecoastal areas has contributed to significant degradation <strong>of</strong> marine environs (Edyvane, 1999).Gulf St Vincent exists as a reverse estuary (more saline at the top <strong>of</strong> the gulf, rather than the oceanmouth) which has limited exchange with the Southern Ocean. This has consequences on waterquality as the water in the gulf has a longer residence time when compared with the open ocean, andthe movement <strong>of</strong> polluted water from point source discharges can have negative environmentalimpacts on other regions <strong>of</strong> the gulf (Gayland, 2004).Gulf St Vincent is a shallow, sheltered tidal estuary with a biologically diverse and highly productiveecosystem, comprising <strong>of</strong> seagrasses, mangroves and tidal saltmarshes. The fishing community andcommercial fishing industry rely heavily on the protection <strong>of</strong> its water quality to maintain fish andcrustaceans species. It is also a popular and important recreational feature <strong>of</strong> metro <strong>Adelaide</strong>’s Coast.The coast <strong>of</strong> <strong>Adelaide</strong> (with the exception <strong>of</strong> the <strong>Port</strong> <strong>Adelaide</strong> River and Barker Inlet) generallycomprises sandy beaches and sand dunes that are used for recreational purposes. The coast asdescribed in this section can be defined as the 8km from end <strong>of</strong> Bower Road at Semaphore South, tothe Outer Harbor breakwater at the northern end.There are no major commercial fisheries or aquaculture operations located on the beaches <strong>of</strong> the <strong>City</strong><strong>of</strong> <strong>Port</strong> <strong>Adelaide</strong> <strong>Enfield</strong>. Seaweed harvesting is allowed if licensed. The sand dunes have significantbiodiversity value, and require careful management to ensure the recreational uses <strong>of</strong> the beach donot have an adverse impact.Management <strong>of</strong> the Coast has been a priority for the <strong>City</strong> <strong>of</strong> <strong>Port</strong> <strong>Adelaide</strong> <strong>Enfield</strong>, with variousmanagement plans in place to conserve and protect the coastal systems and supported biodiversity.Gulf St Vincent & the Coast Environmental IndicatorsState Indicator:• EPA Water quality classification <strong>of</strong> beaches.Pressure Indicator:• Change in the distribution and quantity <strong>of</strong> seagrasses.Gulf St Vincent & the Coast – State & PressuresWater QualityThe EPA monitors water quality <strong>of</strong> metropolitan beaches (twice monthly in summer and monthly inwinter) providing an indication <strong>of</strong> water quality for swimmer health and safety by measuring faecalbacteria (Enterococci) and water clarity (turbidity). Faecal waste pollution in coastal waters comesmainly from treated sewage discharges, boats and stormwater run<strong>of</strong>f. Poor water clarity reducesvisibility which can c<strong>au</strong>se accidents and can also limit the penetration <strong>of</strong> light to the lower water levels,resulting in reduced seagrass growth. Water clarity problems are c<strong>au</strong>sed by particulate matter instormwater run<strong>of</strong>f (soil erosion), and industry and sewage discharges.153
Coast & <strong>Estuaries</strong>Updated results are available via http://www.deh.sa.gov.<strong>au</strong>/epa/water_beaches.html.The EPA's Water Quality Monitoring Program also samples Largs Bay and Semaphore beachesevery month for the protection <strong>of</strong> ecosystem values and aquaculture. Where possible water samplesare taken from the end <strong>of</strong> a jetty or at locations where there is no jetty, samples are takenapproximately 50m from shore.Water quality is assessed as being in good, moderate or poor condition by interpreting waterchemistry and algal data.State Indicator: EPA water quality classification <strong>of</strong> beachesTable 31: Largs Bay Water Quality Classification for October 2005 - March 2006Indicator Ecosystem Recreation AquacultureAmmonia Good NA GoodOxidised Nitrogen Moderate NA NATotal Nitrogen Good NA NATotal Phosphorus Good NA NATurbidity Good Good NAChlorophyll (a) Poor NA NAHeavy Metals Good NA GoodBacteria NA Good NAChlorophyll (a) (an indicator <strong>of</strong> algae) was classified as poor at Largs Bay. This is most likely due towater from the <strong>Port</strong> <strong>Adelaide</strong> River, Bolivar WWTP and urban stormwater promoting algal growth.Heavy metals have slightly improved since the last 6 months, this could be due to less run<strong>of</strong>f enteringthe marine environment from urban catchments.Table 32: Semaphore Jetty Water Quality Classification for October 2005 - March 2006Indicator Ecosystem Recreation AquacultureAmmonia NC NA GoodOxidised Nitrogen Moderate NA NATotal Nitrogen Good NA NATotal Phosphorus Good NA NATurbidity Moderate Moderate NAChlorophyll (a) Poor NA NAHeavy Metals Good NA GoodBacteria NA Good NANA= Not applicable NC = not classified due to laboratory failureChlorophyll (a) was classified as poor and oxidised nitrogen classified as moderate at Semaphore.This is most likely due a combination <strong>of</strong> effluent from the Bolivar WWTP, heavy industries in the <strong>Port</strong><strong>Adelaide</strong> River and urban stormwater adding nutrients, which promote algal growth.Heavy metals were classified as good, which is an improvement from the last period where they wereclassified as poor. This is likely to be due to less run<strong>of</strong>f from urban areas due to the warmer months.(Source: http://www.deh.sa.gov.<strong>au</strong>/epa/water_beaches.html)154
Coast & <strong>Estuaries</strong>Figure 27: Map <strong>of</strong> the <strong>Adelaide</strong> metropolitan coast showing the accumulated loss <strong>of</strong> seagrasses from1949 to 1996 and stormwater outfalls between Largs Bay and Marino.(Figure 27 Source: Westphalen G,Collings G, Wear R, Fernandes M,Bryars S, Cheshire A (2005). A review<strong>of</strong> seagrass loss on the <strong>Adelaide</strong>metropolitan coastline. ACWSTechnical Report No 2 – Figure 2, Pg 4– reproduced with written permissionfrom the EPA).156
Coast & <strong>Estuaries</strong>FisheriesThe fisheries <strong>of</strong> the Gulf St Vincent are an important ecological resource. The commercial andrecreational fishing industries have economic importance to the State. The over exploitation (overfishing) <strong>of</strong> these resources can have a significant impact on the ecology <strong>of</strong> our marine life, and theviability <strong>of</strong> industries. In South Australia the management <strong>of</strong> fisheries is overseen by the State<strong>Gov</strong>ernment (PIR<strong>SA</strong>). The Barker Inlet St Kilda Aquatic Reserve and St Kilda/Chapman CreekAquatic Reserve form part <strong>of</strong> this fisheries management system.The Department <strong>of</strong> Environment and Heritage expresses concerns regarding the sustainability <strong>of</strong>Northern Zone rock lobster and snapper in Gulf St Vincent.The impacts <strong>of</strong> recreational fishing are noted. Recreational fishing is responsible for a greaterproportion <strong>of</strong> the fish catch for certain species (principally snapper and King George whiting) than thecommercial sector, however there are not the same levels <strong>of</strong> control in relation to total annual catchlevels.There are environmental, social and economic effects <strong>of</strong> over-exploiting fisheries. Effectivemanagement is required to ensure commercial and recreational fisheries remain sustainable and thatmarine biodiversity is not adversely affected by over fishing or damaging habitats through fishingpractices (DEH, 2006).<strong>Port</strong> <strong>Adelaide</strong> was subject to an ‘Inventory <strong>of</strong> Important Coastal Fisheries Habitats in South Australia’.Threats to fisheries habitats were identified within the study. Some <strong>of</strong> these include: establishment <strong>of</strong>exotic pest species such as the Sabellid fanworm north <strong>of</strong> Outer Harbor and C<strong>au</strong>lerpa taxifolia inWest lakes and upper <strong>Port</strong> <strong>Adelaide</strong> River; increased nutrients c<strong>au</strong>sed by the Bolivar SewageTreatment outfall; altered patterns <strong>of</strong> water and sediment movement c<strong>au</strong>sed by the location <strong>of</strong> theOuter Harbor breakwaters; physical disturbance c<strong>au</strong>sed by human trampling; bait digging and <strong>of</strong>f roadvehicle use; increased turbidity and sedimentation c<strong>au</strong>sed by intermittent dredging operations atOuter Harbor and in <strong>Port</strong> <strong>Adelaide</strong> River; increased heavy metals c<strong>au</strong>sed by atmospheric fall out andstormwater run<strong>of</strong>f <strong>of</strong> industrial effluent in the region; and thermal pollution from the Torrens Islandpower station (Bryars 2003).Coastal DevelopmentPressures <strong>of</strong> urbanisation and developments associated with coastal tourism significantly impacts onthe coastal zone. Development in close proximity to the beachfront damages the natural dunesystem. The clearing <strong>of</strong> dune vegetation and modification to the shore line disrupts the natural coastalenvirons.Urban development resulted in accelerated erosion <strong>of</strong> parts <strong>of</strong> the foreshore. Undisturbed dunes actas physical barriers that absorb wave energy and thereby protect inland areas from waves and tides.Dunes also store large quantities <strong>of</strong> sand that replenish beaches affected by wave and storm damageand play an important ecological role by supporting a diverse range <strong>of</strong> flora and f<strong>au</strong>na (Petherick2005).Coastal development has c<strong>au</strong>sed large quantities <strong>of</strong> sand to be ‘locked up’ or removed from thebeach system. Many <strong>of</strong> <strong>Adelaide</strong>’s coastal suburbs were built on an extensive system <strong>of</strong> coastaldunes, land was reclaimed along the Lefevre Peninsula to establish the suburb <strong>of</strong> North Haven.If development on the coast was restricted, the natural recession <strong>of</strong> the coast would have beenallowed with the coastline alignment progressively adjusting inland at southern beaches inaccordance with natural northward littoral drift <strong>of</strong> sand.157
Coast & <strong>Estuaries</strong>One <strong>of</strong> the major issues associated with increasing coastal development is erosion <strong>of</strong> the foreshoreand a change in the rate <strong>of</strong> sand movement along the coast.North Haven, 1949 North Haven, 1999(Source: http://www.environment.sa.gov.<strong>au</strong>/coasts/adelaide_background.html#factors)Sand Movement - beachesThe sandy beaches <strong>of</strong> <strong>Adelaide</strong> are highly modified environments that require significantmanagement to maintain. The manual management <strong>of</strong> sand has occurred over the last 30 years.The sand along the coast moves in a northerly direction, resulting in less sand on the southernbeaches and large amounts <strong>of</strong> sand along the northern beaches such as Semaphore. It is estimatedthat between 40,000 and 70,000 cubic metres <strong>of</strong> sand are moved north each year along the erodingcoastline between Brighton and Semaphore.There is currently major sand accumulation at Largs Bay, while sand has been depleted atSemaphore Park. Sand is carted from Semaphore to maintain this beach and protect coastalproperties.The manual sand management to date has been carried out by the Coast Protection Board andCouncils, and has involved beach replenishment by carting sand from the northern to southernbeaches, sand trapping and sand bypassing at Patawalonga, West Beach, and Torrens River outlet.The Department for Environment and Heritage have recently released ‘<strong>Adelaide</strong>’s Living Beaches, AStrategy for 2005 – 2025’. The current system <strong>of</strong> sand management has been reviewed, and the newplan focuses around building a series <strong>of</strong> pipelines to pump sand slurry from north to south. This sandwill also be supplemented by sand from external sources, most likely from Mount Compass.Investigations also continue into coastal structures that will capture sand at a few critical locations.An example is the breakwater installed at Semaphore South constructed to trap sand to be used forbeach replenishment.The type <strong>of</strong> pipeline system to move the sand slurry is still being explored by the State <strong>Gov</strong>ernment.A pipeline system will mean that trucks should no longer be used. The trucks can damage the sanddunes and beaches, and <strong>of</strong>ten need to move through residential streets.Sand DunesThe Semaphore dunes have developed over the last 30 years. The pre-European settlement dunesno longer exist due to housing development fronting the esplanade. Adjacent to the Semaphore jetty,158
Coast & <strong>Estuaries</strong>there were no dunes in the 1970s, and by 2001 the dune width at the jetty was approximately 100m.This occurred due to the accumulation <strong>of</strong> sand on the beach as a result <strong>of</strong> changes in wavepropagation influencing the movement and deposition <strong>of</strong> sand and further exacerbated by the loss in<strong>of</strong>fshore seagrasses (Townsend, 2005).Accumulation <strong>of</strong> sand remains significant despite at least 700,000 cubic meters <strong>of</strong> sand having beenremoved to replenish southern beaches.As a result <strong>of</strong> the young age <strong>of</strong> the dunes colonising vegetation is also recent. The dunes aredominated by introduced species such as Thynopyrum juncieform (se wheat grass) and Euphorbiaparalias (sea spurge) (Townsend, 2005).Off shore impact <strong>of</strong> <strong>Port</strong> <strong>Adelaide</strong> River DredgingAs part <strong>of</strong> the Flinders <strong>Port</strong>s development, dredging <strong>of</strong> the <strong>Port</strong> <strong>Adelaide</strong> River has been completed,resulting in the deepening <strong>of</strong> the channel by 2 metres to accommodate large ships.Land based disposal was not undertaken - the dredged soil was deposited <strong>of</strong>f shore in the Gulf StVincent. It was suggested that this activity may threaten <strong>of</strong>f-shore marine ecosystems by potentiallyspreading C<strong>au</strong>lerpa racemosa and C<strong>au</strong>lerpa taxifolia. The wider spread <strong>of</strong> this invisible alga issignificantly detrimental to seagrasses already under threat in this area. A point worthy <strong>of</strong>consideration and follow up is that the impacts <strong>of</strong> an influx <strong>of</strong> soil into the Gulf may lead to thesmothering <strong>of</strong> benthic (living on or in sediments <strong>of</strong> the sea floor) flora and f<strong>au</strong>na and increasedturbidity.Stormwater and waste water discharge to the seaLocally stormwater is discharged to the coast through the <strong>Port</strong> <strong>Adelaide</strong> River systems, as well asseveral smaller outfalls that discharge stormwater within the dunes or directly onto the beach. Thetotal estimated annual flows from the Barker Inlet system to the sea is 10.3GL (Wilkinson et al 2005 –ACWS Technical Report No.3).The Bolivar and <strong>Port</strong> <strong>Adelaide</strong> wastewater treatment plants have discharged treated effluent into GulfSt Vincent. Effluent from the <strong>Port</strong> <strong>Adelaide</strong> plant is now diverted to the Bolivar plant for treatmentrather than being discharged into the <strong>Port</strong> <strong>Adelaide</strong> River. Up until 1993, sludge from the sewagetreatment process was also discharged <strong>of</strong>fshore from the <strong>Port</strong> <strong>Adelaide</strong> plant. These dischargesincrease nutrient and sediment levels in near shore waters.In 2001/02 around 85% (or 77,329 mega litres) <strong>of</strong> this treated wastewater was discharged to the sea.Despite improvements to wastewater management and a reduction in the volume <strong>of</strong> treatedwastewater discharged in recent years, nutrient enrichment and eutrophication <strong>of</strong> marine waterscontinues. Table 31 provides more detail on the volume <strong>of</strong> treated wastewater discharged to Gulf StVincent in 2001/02.(Source: http://www.environment.sa.gov.<strong>au</strong>/coasts/adelaide_background.html#factors).159
Coast & <strong>Estuaries</strong>Table 31: Amount <strong>of</strong> treated wastewater discharged to Gulf St Vincent in 2001/02WWTPWastewatertreated(megalitres)Wastewaterdischarged(megalitres)Wastewaterre-used(megalitres)(% <strong>of</strong> total)Nitrogen(tonnes)Phosphorous(tonnes)SuspendedSolidsBolivar 45,671 35,957 9,714 (21%) 477 131 1,981 108ChristiesBeach10,718 8,747 1,971 (18%) 230 72 86 55Glenelg 20,812 18,894 1,918 (9%) 520 145 242 173<strong>Port</strong><strong>Adelaide</strong>13,731 13,731 0.0 (0%) 456 67 235 55Total 90,932 77,329 13,603 1,683 415 2,544 391* - Biochemical Oxygen DemandSource: DEH and <strong>SA</strong> WaterBOD*(tonnes)Climate ChangeCoastal systems are highly vulnerable to sea level rise, and changing storm and wave energyregimes predicted as a result <strong>of</strong> climate change. There is significant uncertainty regarding theprojections <strong>of</strong> sea level rise ranging from 9cm to 88cm by 2100 (AMLRNRMB, 2007).There are potentially significant flooding impacts for coastal regions, particularly in low lying areas,due to an increase in height <strong>of</strong> storm surges associated with sea-level rise, more intensive stormevents and increase in stormwater run<strong>of</strong>f linked to rainfall events. Tidal, estuarine and dune coastalsystems are highly dependant on sea-level, tidal range and flooding regimes. There is a high risk <strong>of</strong>potential damage to beaches, estuaries, mangroves, salt marshes and important biodiversity,recreational and industry assets. The impact on the coast is exacerbated by previous degradation andremoval <strong>of</strong> sand dunes (AMLRNRMB, 2007).The <strong>City</strong> <strong>of</strong> <strong>Port</strong> <strong>Adelaide</strong> <strong>Enfield</strong> commissioned a report titled ‘Flood Risk Management Study 2005’.This study aims to identify the risks and develop and implement a strategy to protect the vulnerableareas <strong>of</strong> the <strong>City</strong> from the risk <strong>of</strong> seawater rise and stormwater flooding taking into account thepossible sea level rise and known land subsidence over the next hundred years.The study reported floodplain mapping and damage estimates for a range <strong>of</strong> future sea level risescenarios <strong>of</strong> inundation combined with a 100 year storm event. These predict that the damagesassociated with a 100 year storm event will increase dramatically from existing conditions ($8m-$28m) to future scenarios associated with 500-880mm <strong>of</strong> sea level rise ($180m-$310m) within the<strong>City</strong> <strong>of</strong> <strong>Port</strong> <strong>Adelaide</strong> <strong>Enfield</strong>.160
Coast & <strong>Estuaries</strong>Local ResponseCoastal Management PlansIn 2000 a Coastal Management Plan was prepared in conjunction with the community to ensure thatmanagement <strong>of</strong> the region was in line with community views and expert opinion.Since this time more detailed management plans have been prepared for Semaphore Dune andSemaphore South Dune vegetations. These plans were prepared by the <strong>SA</strong> Urban Forest BiodiversityProgram. In the near future management plans for dune vegetation will be prepared for Largs,Taperoo and North Haven.Climate ChangeThe <strong>City</strong> <strong>of</strong> <strong>Port</strong> <strong>Adelaide</strong> <strong>Enfield</strong> has studied the impacts <strong>of</strong> projected climate change on flooding inparts <strong>of</strong> the Council area through the Flood Risk Management Study 2005 as discussed above.Environmental Indicators (currently not measured)StateNumber <strong>of</strong> samples exceeding ANZECC/NHMRC guidelines for water and sediment quality –beaches and estuary.PressureIndustrial and residential demand for coastal and riverside land – proportion <strong>of</strong> coast developed.Increase in visitor numbers to beaches and inlet.Increased storm and flood events (ARI) on the Lefevre Peninsula.ResponseTrend-responsive spatial data management system in place <strong>of</strong> species status (including GISmapping where possible).Percentage <strong>of</strong> area zoned as mangrove retreat.Budget expended on development and implementation <strong>of</strong> management plans for coastal and riverenvironments (both site specific and regional) – inter governmental programme.Number <strong>of</strong> community participating in coast management and conservation activities – e.g. dunecare, coastcare, Our Patch.Area <strong>of</strong> riparian, coastal or wetland rehabilitation projects (annual).Area <strong>of</strong> coast/marine environment covered by a MPA status (Marine Protected Area).161
Coast & <strong>Estuaries</strong>ReferencesACWS Technical Report No.1 prepared for the <strong>Adelaide</strong> Coastal Waters Steering Committee,November 2003. Department <strong>of</strong> Environmental Health, Flinders University <strong>of</strong> South Australia.ACWS Technical Report No 3 prepared for the <strong>Adelaide</strong> Coastal Waters Study Steering Committee.Department <strong>of</strong> Environmental Health, Flinders University <strong>of</strong> South Australia.AMLRNRMB February 2007 Climate Change in the <strong>Adelaide</strong> and Mount L<strong>of</strong>ty Ranges Regionhttp://www.dwlbc.sa.gov.<strong>au</strong>/assets/files/NRM_CC_Final.pdfBarker Inlet and <strong>Port</strong> Estuary Committee website (2005), www.bipec.on.net/Bryars S (2003) An Inventory <strong>of</strong> Important Coastal Fisheries Habitats in South Australia. Fish HabitatProgram, Primary Industries and Resources South Australia.Daniels C, Tait C (2005). <strong>Adelaide</strong>, Nature <strong>of</strong> a <strong>City</strong>: The Ecology <strong>of</strong> a Dynamic <strong>City</strong> from 1836 to2036. Bio<strong>City</strong>: Centre for Urban Habitats.Department for Environment and Heritage website (2006) <strong>Estuaries</strong>http://www.environment.sa.gov.<strong>au</strong>/coasts/estuaries.html#what_isDepartment for Environment and Heritage website (2005). <strong>Adelaide</strong> Dolphin Sanctuary websitewww.environment.sa.gov.<strong>au</strong>/coasts/ads/overview.htmlDepartment for Environment and Heritage (2005). <strong>Adelaide</strong>’s Living Beaches, A Strategy for 2005-2025.Department <strong>of</strong> Environment and Heritage 2004 An Ecological Representative System <strong>of</strong> MarineProtected Areas in <strong>SA</strong> Technical Report 2004http://deh.sa.gov.<strong>au</strong>/coasts/mpas/pdfs/mpa_report/part_4.pdfEnvironment Protection Authority (2005). <strong>Port</strong> Waterways Water Quality Improvement Plan –Stage 1.Environment Protection Authority (2005). Setting environmental values for the <strong>Port</strong> Waterways.Environment Protection Authority (2000), Monitoring Report Special Survey <strong>of</strong> the <strong>Port</strong> <strong>Adelaide</strong>River, Heavy Metals and PCBs in Dolphins, Sediment and Fish.Environment Protection Authority 1998 Changes in seagrass coverage. <strong>Adelaide</strong>, EnvironmentProtection Authority (<strong>SA</strong>).Jenkins, C (2005). Nutrient flux assessment in the <strong>Port</strong> Waterways. Environment ProtectionAuthorityFlinders <strong>Port</strong>s (2005). Flinders <strong>Port</strong>s website www.flindersports.com.<strong>au</strong>162
Coast & <strong>Estuaries</strong><strong>Gov</strong>ernment <strong>of</strong> South Australia (2002) <strong>Adelaide</strong> Dolphin Sanctuary: A Strategy to Protect BottlenoseDolphins and their Habitat in the Barker Inlet / <strong>Port</strong> <strong>Adelaide</strong> River Estuary and Associated Waters.Booklet. 10pKinhill Stearns Pty Ltd (1985), Wasleys to <strong>Adelaide</strong> Pipeline Looping Project, Draft EIS for SouthernSection and Supplement, Pipelines Authority <strong>of</strong> South Australia, <strong>Adelaide</strong>.PIR<strong>SA</strong> (2005), Information Sheet C<strong>au</strong>lerpa taxifolia. www.pir.sa.gov.<strong>au</strong>Petherick C and <strong>SA</strong> Urban Forest Biodiversity Program (2005), Vegetation Management PlanSemaphore Dune Reserve, for the <strong>City</strong> <strong>of</strong> <strong>Port</strong> <strong>Adelaide</strong> <strong>Enfield</strong>, May 2005.Townsend M (2005), Semaphore Park <strong>of</strong>fshore breakwater: a trial, Coastal Protection Branch,Department for Environment and Heritage, South Australia.Westphalen G, Collings G, Wear R, Fernandes M, Bryars S, Cheshire A (2005). A review <strong>of</strong> seagrassloss on the <strong>Adelaide</strong> metropolitan coastline. ACWS Technical Report No 2 prepared for the <strong>Adelaide</strong>Coastal Waters Study Steering Committee. South Australian Research and Development Institute(Aquatic Sciences) Publication No RD04/0073, <strong>Adelaide</strong>.Wilkinson J, Pearce M, Cromar N, Fallowfield H (2005). Audit <strong>of</strong> the quality and quantity <strong>of</strong> treatedwastewater discharging from Wastewater Treatment Plants (WWTPs) to the marine environment.Wilkinson J, Hutson J, Bestland E, Fallowfield H (2005). Audit <strong>of</strong> contemporary and historical quality<strong>of</strong> quantity data <strong>of</strong> stormwater discharging into the marine environment, and field work programme.163
Figure 28: <strong>Port</strong> <strong>Adelaide</strong> River-Barker Inlet Waterways, location <strong>of</strong> major activities and discharges.Source: <strong>Port</strong> Waterways Water Quality Improvement Plan Stage 1, Fig 8 pg 39, EPA June 2005164
Map 22 Features <strong>of</strong> Coastal environment within the <strong>City</strong> <strong>of</strong> <strong>Port</strong> <strong>Adelaide</strong> <strong>Enfield</strong>165