annual_2010_07.pdf
annual_2010_07.pdf
annual_2010_07.pdf

Create successful ePaper yourself
Turn your PDF publications into a flip-book with our unique Google optimized e-Paper software.
“Dead Rising 2” “Monster Hunter Freedom 3”<br />
“MARVEL VS. CAPCOM 3 Fate of Two Worlds”<br />
As a result, we released 72 new game titles, and shipped a total of 12.5<br />
million units (down 27.7% from the previous year). Net sales were 44,015<br />
million yen (down 30.0% from the previous year) and operating income was<br />
7,846 million yen (down 52.1% from the previous year).<br />
Targeting overseas sales ratio of 65% through more efficient<br />
development and the expanded online functionality of all<br />
major titles.<br />
As a medium-term business goal, we give priority to growth in North America<br />
and Europe in an effort to respond to the size of each market. Ideally, our<br />
overseas market share should be 80-90%, equivalent to the market segment<br />
size. However, since the domestic market share is increasing, the goal for<br />
our overseas sales ratio is currently set at 65%. In order to achieve this<br />
medium-term business goal, we will be implementing business strategies<br />
mainly centered on (1) expanding support for multi-platforms, (2) shortening<br />
the major titles sales cycle, (3) promoting the development of titles for<br />
overseas markets and (4) strengthening our online business (See P.19 “Our<br />
Strategy for Growth” for more details).<br />
With regard to (1) and (2), we are forming our domestic development<br />
TM & © 2011 Marvel Entertainment, LLC and its subsidiaries.<br />
Licensed by Marvel Characters B.V. www.marvel.com. All rights reserved.<br />
©CAPCOM CO., LTD. 2011, ©CAPCOM U.S.A., INC. 2011 ALL RIGHTS RESERVED.<br />
“Monster Hunter Frontier Online”<br />
structure in an attempt to strengthen our lineup through more efficient<br />
development and reorganization. Through hybrid development, which<br />
involves outsourcing the labor-intensive aspects of core content developed<br />
in-house by Capcom to outside development companies, we can shorten the<br />
development period, increase the number of titles released in a single year, and<br />
expand profitability. Furthermore, we are strengthening our lineup by allocating<br />
20-30% of funds set aside for investment in development toward new titles,<br />
while reusing past assets (titles). The sales launch of new titles including<br />
“Lost Planet 2”, “Dead Rising 2”, “Monster Hunter Freedom 3” and “MARVEL<br />
VS. CAPCOM 3 Fate of Two Worlds” are scheduled for the next fiscal year.<br />
With regard to (3), we are proactively pursuing partnerships with<br />
overseas development companies to expand overseas sales and secure<br />
development resources. Outsourcing the development of “Dead Rising 2”<br />
and other popular series enables us to promote product development that<br />
combines “overseas tastes” with “Capcom tastes”.<br />
Finally, with regard to (4), we are aggressively developing the PC online<br />
game and download businesses. We are aiming for synergy between<br />
“Monster Hunter Frontier Online” for the PC, which is on track in Taiwan,<br />
with the domestic release for Xbox 360. With these initiatives, we expect to<br />
release of 75 new game titles and the shipment of 20 million units in the<br />
next fiscal year, and forecast net sales of 71.5 billion yen and operating<br />
income of 15.3 billion yen.<br />
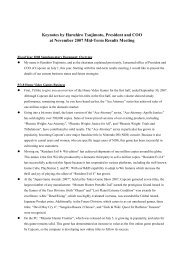
Diagram 13 Market Share by Region (CY2009)<br />
Japanese Market<br />
North American Market European (UK) Market<br />
Company name Sales (¥ Million) Share (%)<br />
Company name Sales ($ Thousand) Share (%)<br />
Company name Sales ($ Thousand) Share (%)<br />
31<br />
Outlook for the Next Fiscal Year<br />
1. Nintendo<br />
2. Square-Enix<br />
3. Namco Bandai<br />
4. Pokemon<br />
5. Konami<br />
6. Capcom<br />
7. Sega<br />
8. Level Five<br />
9. SCE<br />
10. Koei<br />
Others<br />
Total<br />
CAPCOM ANNUAL REPORT <strong>2010</strong><br />
68,000<br />
38,000<br />
34,000<br />
21,000<br />
21,000<br />
20,000<br />
13,000<br />
10,000<br />
8,000<br />
7,000<br />
20.9<br />
11.5<br />
10.3<br />
6.4<br />
6.3<br />
6.1<br />
4.1<br />
3.1<br />
2.6<br />
2.3<br />
26.4<br />
100.0<br />
1. A<br />
2. B<br />
3. C<br />
4. D<br />
5. E<br />
6. F<br />
7. G<br />
8. H<br />
•••<br />
10. Capcom<br />
Total<br />
Source: Enterbrain, Inc. Source: “The NPD Group / Retail Tracking Service”<br />
Data concerning our competitors are not disclosed<br />
by request of the market research company.<br />
•••<br />
252,559<br />
•••<br />
2.55%<br />
100.0<br />
1. Nintendo<br />
2. Electronic Arts<br />
3. Activision<br />
4. Ubisoft<br />
5. SCE<br />
6. Sega<br />
7. Microsoft<br />
8. THQ<br />
•••<br />
15. Capcom<br />
Others<br />
Total<br />
437,654<br />
432,257<br />
398,115<br />
239,148<br />
126,593<br />
124,598<br />
119,208<br />
113,397<br />
•••<br />
54,958<br />
16.5<br />
16.3<br />
15.0<br />
9.0<br />
4.8<br />
4.7<br />
4.5<br />
4.3<br />
•••<br />
2.1<br />
22.8<br />
100.0<br />
Source: Chart-Track, copyright ELSPA (UK) Ltd.