annual_2010_07.pdf
annual_2010_07.pdf
annual_2010_07.pdf

You also want an ePaper? Increase the reach of your titles
YUMPU automatically turns print PDFs into web optimized ePapers that Google loves.
Overview of Capcom’s Business and Outlook for the Future<br />
SWOT Analysis<br />
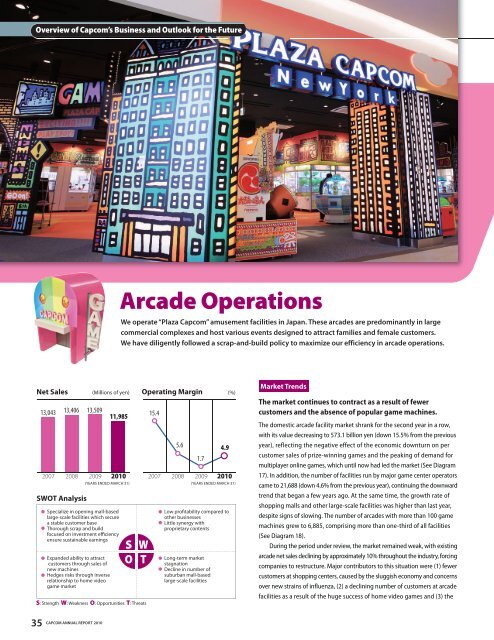
Arcade Operations<br />
We operate “Plaza Capcom” amusement facilities in Japan. These arcades are predominantly in large<br />
commercial complexes and host various events designed to attract families and female customers.<br />
We have diligently followed a scrap-and-build policy to maximize our efficiency in arcade operations.<br />
Net Sales (Millions of yen) Operating Margin<br />
(%)<br />
13,043 13,406 13,509<br />
Specialize in opening mall-based<br />
large-scale facilities which secure<br />
a stable customer base<br />
Thorough scrap and build<br />
focused on investment efficiency<br />
ensure sustainable earnings<br />
Expanded ability to attract<br />
customers through sales of<br />
new machines<br />
Hedges risks through inverse<br />
relationship to home video<br />
game market<br />
11,985<br />
2007 2008 2009 <strong>2010</strong><br />
(YEARS ENDED MARCH 31) (YEARS ENDED MARCH 31)<br />
S W<br />
O T<br />
S: Strength W: Weakness O: Opportunities T: Threats<br />
35<br />
CAPCOM ANNUAL REPORT <strong>2010</strong><br />
15.4<br />
5.6<br />
1.7<br />
Low profitability compared to<br />
other businesses<br />
Little synergy with<br />
proprietary contents<br />
Long-term market<br />
stagnation<br />
Decline in number of<br />
suburban mall-based<br />
large-scale facilities<br />
4.9<br />
2007 2008 2009 <strong>2010</strong><br />
Market Trends<br />
The market continues to contract as a result of fewer<br />
customers and the absence of popular game machines.<br />
The domestic arcade facility market shrank for the second year in a row,<br />
with its value decreasing to 573.1 billion yen (down 15.5% from the previous<br />
year), reflecting the negative effect of the economic downturn on per<br />
customer sales of prize-winning games and the peaking of demand for<br />
multiplayer online games, which until now had led the market (See Diagram<br />
17). In addition, the number of facilities run by major game center operators<br />
came to 21,688 (down 4.6% from the previous year), continuing the downward<br />
trend that began a few years ago. At the same time, the growth rate of<br />
shopping malls and other large-scale facilities was higher than last year,<br />
despite signs of slowing. The number of arcades with more than 100 game<br />
machines grew to 6,885, comprising more than one-third of all facilities<br />
(See Diagram 18).<br />
During the period under review, the market remained weak, with existing<br />
arcade net sales declining by approximately 10% throughout the industry, forcing<br />
companies to restructure. Major contributors to this situation were (1) fewer<br />
customers at shopping centers, caused by the sluggish economy and concerns<br />
over new strains of influenza, (2) a declining number of customers at arcade<br />
facilities as a result of the huge success of home video games and (3) the