annual_2010_07.pdf
annual_2010_07.pdf
annual_2010_07.pdf

Create successful ePaper yourself
Turn your PDF publications into a flip-book with our unique Google optimized e-Paper software.
Overview of Capcom’s Business and Outlook for the Future<br />
SWOT Analysis<br />
S W<br />
O T<br />
S: Strength W: Weakness O: Opportunities T: Threats<br />
29<br />
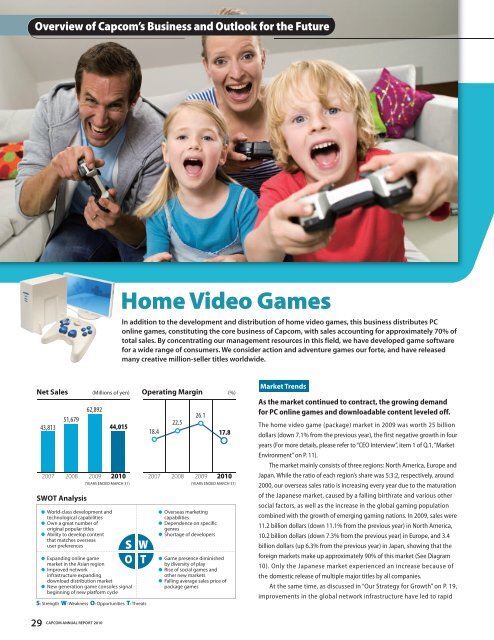
Net Sales (Millions of yen) Operating Margin<br />
(%)<br />
43,813<br />
51,679<br />
62,892<br />
44,015<br />
2007 2008 2009 <strong>2010</strong> 2007 2008 2009 <strong>2010</strong><br />
(YEARS ENDED MARCH 31) (YEARS ENDED MARCH 31)<br />
World-class development and<br />
technological capabilities<br />
Own a great number of<br />
original popular titles<br />
Ability to develop content<br />
that matches overseas<br />
user preferences<br />
Expanding online game<br />
market in the Asian region<br />
Improved network<br />
infrastructure expanding<br />
download distribution market<br />
New generation game consoles signal<br />
beginning of new platform cycle<br />
CAPCOM ANNUAL REPORT <strong>2010</strong><br />
Home Video Games<br />
In addition to the development and distribution of home video games, this business distributes PC<br />
online games, constituting the core business of Capcom, with sales accounting for approximately 70% of<br />
total sales. By concentrating our management resources in this field, we have developed game software<br />
for a wide range of consumers. We consider action and adventure games our forte, and have released<br />
many creative million-seller titles worldwide.<br />
18.4<br />
22.5<br />
26.1<br />
Overseas marketing<br />
capabilities<br />
Dependence on specific<br />
genres<br />
Shortage of developers<br />
17.8<br />
Game presence diminished<br />
by diversity of play<br />
Rise of social games and<br />
other new markets<br />
Falling average sales price of<br />
package games<br />
Market Trends<br />
As the market continued to contract, the growing demand<br />
for PC online games and downloadable content leveled off.<br />
The home video game (package) market in 2009 was worth 25 billion<br />
dollars (down 7.1% from the previous year), the first negative growth in four<br />
years (For more details, please refer to “CEO Interview”, item 1 of Q.1, “Market<br />
Environment” on P. 11).<br />
The market mainly consists of three regions: North America, Europe and<br />
Japan. While the ratio of each region’s share was 5:3:2, respectively, around<br />
2000, our overseas sales ratio is increasing every year due to the maturation<br />
of the Japanese market, caused by a falling birthrate and various other<br />
social factors, as well as the increase in the global gaming population<br />
combined with the growth of emerging gaming nations. In 2009, sales were<br />
11.2 billion dollars (down 11.1% from the previous year) in North America,<br />
10.2 billion dollars (down 7.3% from the previous year) in Europe, and 3.4<br />
billion dollars (up 6.3% from the previous year) in Japan, showing that the<br />
foreign markets make up approximately 90% of this market (See Diagram<br />
10). Only the Japanese market experienced an increase because of<br />
the domestic release of multiple major titles by all companies.<br />
At the same time, as discussed in “Our Strategy for Growth” on P. 19,<br />
improvements in the global network infrastructure have led to rapid
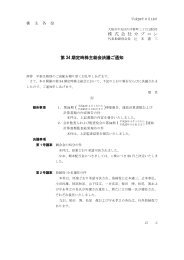
“Dead Rising 2” “Monster Hunter Freedom 3”<br />
“MARVEL VS. CAPCOM 3 Fate of Two Worlds”<br />
As a result, we released 72 new game titles, and shipped a total of 12.5<br />
million units (down 27.7% from the previous year). Net sales were 44,015<br />
million yen (down 30.0% from the previous year) and operating income was<br />
7,846 million yen (down 52.1% from the previous year).<br />
Targeting overseas sales ratio of 65% through more efficient<br />
development and the expanded online functionality of all<br />
major titles.<br />
As a medium-term business goal, we give priority to growth in North America<br />
and Europe in an effort to respond to the size of each market. Ideally, our<br />
overseas market share should be 80-90%, equivalent to the market segment<br />
size. However, since the domestic market share is increasing, the goal for<br />
our overseas sales ratio is currently set at 65%. In order to achieve this<br />
medium-term business goal, we will be implementing business strategies<br />
mainly centered on (1) expanding support for multi-platforms, (2) shortening<br />
the major titles sales cycle, (3) promoting the development of titles for<br />
overseas markets and (4) strengthening our online business (See P.19 “Our<br />
Strategy for Growth” for more details).<br />
With regard to (1) and (2), we are forming our domestic development<br />
TM & © 2011 Marvel Entertainment, LLC and its subsidiaries.<br />
Licensed by Marvel Characters B.V. www.marvel.com. All rights reserved.<br />
©CAPCOM CO., LTD. 2011, ©CAPCOM U.S.A., INC. 2011 ALL RIGHTS RESERVED.<br />
“Monster Hunter Frontier Online”<br />
structure in an attempt to strengthen our lineup through more efficient<br />
development and reorganization. Through hybrid development, which<br />
involves outsourcing the labor-intensive aspects of core content developed<br />
in-house by Capcom to outside development companies, we can shorten the<br />
development period, increase the number of titles released in a single year, and<br />
expand profitability. Furthermore, we are strengthening our lineup by allocating<br />
20-30% of funds set aside for investment in development toward new titles,<br />
while reusing past assets (titles). The sales launch of new titles including<br />
“Lost Planet 2”, “Dead Rising 2”, “Monster Hunter Freedom 3” and “MARVEL<br />
VS. CAPCOM 3 Fate of Two Worlds” are scheduled for the next fiscal year.<br />
With regard to (3), we are proactively pursuing partnerships with<br />
overseas development companies to expand overseas sales and secure<br />
development resources. Outsourcing the development of “Dead Rising 2”<br />
and other popular series enables us to promote product development that<br />
combines “overseas tastes” with “Capcom tastes”.<br />
Finally, with regard to (4), we are aggressively developing the PC online<br />
game and download businesses. We are aiming for synergy between<br />
“Monster Hunter Frontier Online” for the PC, which is on track in Taiwan,<br />
with the domestic release for Xbox 360. With these initiatives, we expect to<br />
release of 75 new game titles and the shipment of 20 million units in the<br />
next fiscal year, and forecast net sales of 71.5 billion yen and operating<br />
income of 15.3 billion yen.<br />
Diagram 13 Market Share by Region (CY2009)<br />
Japanese Market<br />
North American Market European (UK) Market<br />
Company name Sales (¥ Million) Share (%)<br />
Company name Sales ($ Thousand) Share (%)<br />
Company name Sales ($ Thousand) Share (%)<br />
31<br />
Outlook for the Next Fiscal Year<br />
1. Nintendo<br />
2. Square-Enix<br />
3. Namco Bandai<br />
4. Pokemon<br />
5. Konami<br />
6. Capcom<br />
7. Sega<br />
8. Level Five<br />
9. SCE<br />
10. Koei<br />
Others<br />
Total<br />
CAPCOM ANNUAL REPORT <strong>2010</strong><br />
68,000<br />
38,000<br />
34,000<br />
21,000<br />
21,000<br />
20,000<br />
13,000<br />
10,000<br />
8,000<br />
7,000<br />
20.9<br />
11.5<br />
10.3<br />
6.4<br />
6.3<br />
6.1<br />
4.1<br />
3.1<br />
2.6<br />
2.3<br />
26.4<br />
100.0<br />
1. A<br />
2. B<br />
3. C<br />
4. D<br />
5. E<br />
6. F<br />
7. G<br />
8. H<br />
•••<br />
10. Capcom<br />
Total<br />
Source: Enterbrain, Inc. Source: “The NPD Group / Retail Tracking Service”<br />
Data concerning our competitors are not disclosed<br />
by request of the market research company.<br />
•••<br />
252,559<br />
•••<br />
2.55%<br />
100.0<br />
1. Nintendo<br />
2. Electronic Arts<br />
3. Activision<br />
4. Ubisoft<br />
5. SCE<br />
6. Sega<br />
7. Microsoft<br />
8. THQ<br />
•••<br />
15. Capcom<br />
Others<br />
Total<br />
437,654<br />
432,257<br />
398,115<br />
239,148<br />
126,593<br />
124,598<br />
119,208<br />
113,397<br />
•••<br />
54,958<br />
16.5<br />
16.3<br />
15.0<br />
9.0<br />
4.8<br />
4.7<br />
4.5<br />
4.3<br />
•••<br />
2.1<br />
22.8<br />
100.0<br />
Source: Chart-Track, copyright ELSPA (UK) Ltd.
Overview of Capcom’s Business and Outlook for the Future<br />
7,102<br />
8,525<br />
4,628<br />
5,819<br />
2007 2008 2009 <strong>2010</strong><br />
Contents Expansion<br />
We are expanding two other businesses based on the content used for our home video games making it<br />
possible for different businesses to create a synergetic effect. For example, Pachinko & Pachislo Business<br />
is involved in the development, manufacture and sales of frames and LCD devices for gaming machines<br />
as well as software, whereas Mobile Content Business deals with the development and distribution of<br />
game content for mobile phones.<br />
Net Sales (Millions of yen) Operating Margin<br />
(%)<br />
SWOT Analysis<br />
Multiple usage of abundant<br />
proprietary content<br />
High degree of development<br />
technology capabilities<br />
S W<br />
O T<br />
22.9<br />
30.9<br />
8.7<br />
2007 2008<br />
-5.0<br />
2009 <strong>2010</strong><br />
(YEARS ENDED MARCH 31) (YEARS ENDED MARCH 31)<br />
Mobile Content<br />
High-performance<br />
smartphone handsets<br />
Rise of social games and<br />
other new markets<br />
Expanding demand for mobile<br />
phones in emerging markets<br />
P&S<br />
Market recovery from relaxation of regulation<br />
on business affecting public morals<br />
S: Strength W: Weakness O: Opportunities T: Threats<br />
P&S<br />
Fragile Company sales<br />
network<br />
Shortage of acquired titles<br />
Mobile Content<br />
Barriers to entry are low,<br />
significant competitor presence<br />
P&S<br />
Continued sluggishness in the<br />
gaming machine market<br />
Market Trends<br />
The Pachinko & Pachislo market remained sluggish,<br />
decreasing 15.8% from the previous year.<br />
The Mobile content market continued to expand, increasing<br />
15.5%.<br />
The Contents Expansion Business consists of two businesses that develop<br />
the content of our home video games, the Pachinko & Pachislo Business<br />
and the Mobile Content Business.<br />
The size of the Pachinko & Pachislo (gaming machines) market, including<br />
sales at Pachinko parlors, was 21,716 billion yen in 2008. Despite being the<br />
biggest entertainment market, it shrank by 1,264 billion yen (down 5.5% from<br />
the previous year) from its record low last year. Although the decrease itself<br />
is an improvement over last year, the overall market contraction has yet to<br />
be restrained. The market for Pachinko & Pachislo machines where we operate<br />
our business remained soft, worth 1,142.8 billion yen (down 15.8% from the<br />
previous year) in 2008 (See Diagram 14 on next page).<br />
These sluggish conditions are mainly due to the amendments to the<br />
“Regulations on the Entertainment and Amusement Trades Rationalizing Act”<br />
(hereinafter called the “Entertainment and Amusement Trade Regulations”)<br />
that were enacted in July 2004. As the gaming aspect of Pachislo machines<br />
has been further restricted, the number of core users continues to dwindle.<br />
CAPCOM ANNUAL REPORT <strong>2010</strong><br />
32<br />
Overview of Capcom’s<br />
Business and Outlook for the Future
Pachislo machine<br />
“Vampire”<br />
At the same time, with respect to Pachinko machines, these amendments<br />
to the Regulations gave hardware manufacturers greater flexibility in designing<br />
and developing innovative products, encouraging the launch of new products<br />
appealing to users. As a result, sales were steady.<br />
The outlook for the Pachislo market calls for a shift to the development<br />
of machines with a greater emphasis on entertainment so that users can play<br />
for a long period of time with a small amount of money in an effort to develop<br />
the beginning users segment. This is expected to result in the gradual<br />
appearance of machines more aligned with market needs in preparation for<br />
the eventual recovery trend. The outlook for the pachinko (new machine<br />
sales) market is for a leveling off resulting from the expansion of the low-cost<br />
game machine market, including one yen Pachinko machines.<br />
The mobile content market has been growing worldwide and was worth<br />
4.72 billion dollars (up 15.5% from the previous year) in 2009 (See Diagram<br />
15). Factors underlying this growth include the spread of mobile phones driven<br />
by a growing world population and the rise of smartphones such as the<br />
iPhone, both of which contributed to the significant increase in the number<br />
of users who play mobile games to 546 million people (up 85.8% from the<br />
previous year).<br />
By region, the North American market was worth1.13 billion dollars (up<br />
20.0% from the previous year) and the European market was worth 1.68<br />
billion dollars (up 46.3% from the previous year) as a result of significant<br />
expansion of the smartphone market. Despite an increase in users in China<br />
and other developing countries in Asia, declining numbers of users in Japan<br />
resulted in an Asia-Pacific market including Japan worth 1.81 billion dollars<br />
(down 6.1% from the previous year).<br />
The outlook for this market is for an increase in “application stores” that<br />
1,309.0<br />
786.5<br />
522.5<br />
2004<br />
1,406.4<br />
869.9<br />
536.5<br />
Pachislo Pachinko<br />
1,389.5<br />
898.6<br />
490.9<br />
2005 2006<br />
1,357.3<br />
856.4<br />
500.9<br />
2007<br />
1,142.8<br />
900.5<br />
242.3<br />
2008<br />
(¥ Billion)<br />
Source: Figures by Capcom, based on “Research Results of the Pachinko-Related Machine Markets 2008”<br />
and “Research Results of the Pachinko-Related Machine Markets 2009” from Yano Research Institute Ltd.<br />
33<br />
(CY)<br />
sell downloadable application software for smartphones, as well as an<br />
increase in smartphone users (see Diagram 16), which are expected to represent<br />
38% of mobile phone sales by 2013. In addition, newly released operating<br />
systems enable software companies to develop games that maximize<br />
hardware functionality, enabling the provision of games that appeal to<br />
a wide segment, from light users to core game fans. As a result, significant<br />
growth is forecast for the global mobile content market, which is expected<br />
to reach 11.42 billion dollars in 2014 (an average <strong>annual</strong> growth rate of<br />
19.4%).<br />
Operating Results for This Fiscal Year<br />
Despite a slowdown in the Pachinko & Pachislo Business, the<br />
Mobile Content Business maintained steady sales and<br />
returned to profitability.<br />
Capcom’s strength in this business is our ability to maintain high profitability<br />
through the multiple usage of our wealth of intellectual properties in a<br />
variety of areas.<br />
In the Pachinko & Pachislo Business, Capcom develops attractive software<br />
featuring our proprietary content along with that of third-party developers,<br />
using our technological expertise in high-resolution image processing<br />
cultivated through the development of home video games. Also, we have<br />
been supplying LCD devices to machine manufacturers. Moreover, we<br />
acquired Enterrise CO., LTD., a manufacturer of equipment related to Pachislo<br />
machines, as a subsidiary in November 2008. This allowed us to start our<br />
own frame business using Enterrise’s main board development capabilities<br />
(program for controlling the number of balls dispensed).<br />
Diagram 14 Major Gaming Machines Market (New Machine sales)<br />
Diagram 15 Mobile Content Market<br />
CAPCOM ANNUAL REPORT <strong>2010</strong><br />
Pachislo machine<br />
“Beautiful Joe”<br />
“Are You Smarter<br />
Than A 5th Grader?”<br />
Game Code ©2008 CAPCOM.<br />
Produced under license Fox<br />
Broadcasting Co. Are You Smarter<br />
Than A 5th Grader? and ©2008 JM, Inc.<br />
“Cash Cab After Dark: Las Vegas”<br />
Cash Cab © <strong>2010</strong> & TM Discovery<br />
Communications, LLC. All rights reserved.<br />
4,721<br />
103<br />
1,812<br />
1,677<br />
1,130<br />
2009<br />
5,618<br />
159<br />
2,199<br />
1,961<br />
1,300<br />
<strong>2010</strong><br />
(Estimate)<br />
7,147<br />
369<br />
2,805<br />
2,446<br />
1,527<br />
2011<br />
(Estimate)<br />
8,369<br />
557<br />
3,170<br />
2,825<br />
1,817<br />
2012<br />
(Estimate)<br />
“Where’s Waldo?”<br />
Japan, Asia Europe North America other<br />
9,729<br />
767<br />
3,566<br />
3,280<br />
2,117<br />
2013<br />
(Estimate)<br />
Where’s Waldo?®<br />
©2009 Classic Media.<br />
All rights reserved.<br />
($ Million)<br />
11,421<br />
993<br />
4,207<br />
3,729<br />
2,493<br />
2014<br />
(CY)<br />
(Estimate)<br />
Source: Gartner Dataquest <strong>2010</strong>
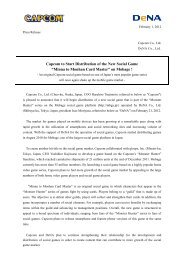
"Apollo Justice: Ace Attorney" “Resident Evil: Degeneration” “Street Fighter IV”<br />
“MONHAN NIKKI<br />
MOBILE AIRU MURA”<br />
During this fiscal year, the market for equipment related to gaming<br />
machines remained in a slump as a result of the difficult business environment,<br />
the of unfavorable performance of “Vampire”. However, “Beautiful Joe”,<br />
which was introduced in the fourth quarter, sold 2,500 units and continues<br />
to demonstrate steady sales. Entrusted development product “Onimusha:<br />
Dawn of Dreams”, part of our collaborative development, firmly established<br />
its brand power, selling 28,000 units. Despite these glimmers of hope,<br />
performance was sluggish from beginning to end.<br />
In the Mobile Content Business, as part of our “Single Content Multiple<br />
Usage” strategy, we utilize expertise and content cultivated through the<br />
development of home video games to deliver our popular home video<br />
game titles for mobile phones worldwide.<br />
In the overseas business, we introduced the latest the series of casual games<br />
linked with popular TV programs “Who Wants to Be a Millionaire?” and “Are<br />
You Smarter Than A 5th Grader?” while “Cash Cab After Dark: Las Vegas” and<br />
“Where’s Waldo?” which make use of copyrights from another company, became<br />
best sellers for all mobile phone companies, providing stable sales composition<br />
as a new series for the light user segment. As a result, our share in the North<br />
American mobile content market was 3.3% (a fifth place ranking) in 2009.<br />
At the same time, sales of the “Apollo Justice : Ace Attorney”, which has<br />
been the domestic profit engine, continued growing steadily. We acquired<br />
new users through the release of “Resident Evil: Degeneration” and “Street<br />
Fighter IV” for the iPhone, results that were roughly as planned.<br />
As a result of these factors, net sales were 5,819 million yen (up 25.7%<br />
from the previous year) and operating income was 509 million yen (compared<br />
to an operating loss of 230 million yen at the previous year), reflecting a<br />
return to profitability.<br />
Diagram 16<br />
Launch of<br />
iPhone<br />
on 6/29/07<br />
1.3<br />
2007<br />
Sales Volume of iPhone<br />
Launch of<br />
iPhone3G<br />
on 7/11/08<br />
11.6<br />
2008 2009<br />
(Millions of units)<br />
Launch of<br />
iPhone3GS<br />
on 6/19/09<br />
20.7<br />
(CY)<br />
Source: Information announced by Apple<br />
Outlook for the Next Fiscal Year<br />
We will strengthen consigned development and sales in our<br />
Pachinko & Pachislo Business.<br />
We will focus efforts on smartphones in our Mobile Content<br />
Business.<br />
In the next fiscal year, we predict that a rebound in the Pachinko & Pachislo<br />
business will be difficult as no revisions are expected to the amendments<br />
made to the Entertainment and Amusement Trade Regulations. However,<br />
we will reduce risks by strengthening our consigned development business<br />
and introducing major titles<br />
“Beautiful Joe”, which was released in the previous period and surpassed<br />
sales expectations, is the result of various improvements, including (1) the<br />
promotion of efficient development by consolidating the development<br />
departments at the Headquarters and our subsidiary Enterrise, and (2) the<br />
strengthening of our distribution network through consignment of sales to<br />
a major sales company. To improve the overall profitability of this business<br />
next year, we will (1) expand the consignment business which is expected<br />
to contribute stable profits, (2) improve development quality through<br />
business partnerships with major sales companies, and (3) introduce major<br />
popular home video game contents. In addition to the promotion of these<br />
initiatives, we are scheduled to release two new machines.<br />
In the Mobile Content Business, we will focus efforts on developing<br />
content for smartphones, a market where high growth is expected both in<br />
Japan and overseas. We aim to improve “sales price” and the “number of<br />
downloads” by introducing popular Capcom titles to the high average<br />
purchase price core user segment, while making use of copyrighted content<br />
from other companies focused on the large casual user segment. Also, with<br />
respect to the remarkable growth of the social game market, we will fuse<br />
Capcom content with communication systems to provide service that<br />
makes use of our strengths. For example, through a tie-up with DeNA Co.,<br />
Ltd., we will deliver “Monster Hunter” on Japan’s largest platform. In this<br />
way, we can engage a wide range of diverse home video game and mobile<br />
user segments, differentiate ourselves in the mobile game market and<br />
move closer to our objective of becoming the frontrunner in social gaming.<br />
Moreover, next year we will move the Pachinko & Pachislo Business<br />
segment from “Contents Expansion” to “Arcade Equipments Business (currently<br />
Arcade Game Sales)”, and spin-off the high growth potential Mobile<br />
Content Business as an independent segment.<br />
We project net sales for the next fiscal year will be 4 billion yen with an<br />
operating income of 900 million yen.<br />
CAPCOM ANNUAL REPORT <strong>2010</strong><br />
34<br />
Overview of Capcom’s<br />
Business and Outlook for the Future
Overview of Capcom’s Business and Outlook for the Future<br />
SWOT Analysis<br />
Arcade Operations<br />
We operate “Plaza Capcom” amusement facilities in Japan. These arcades are predominantly in large<br />
commercial complexes and host various events designed to attract families and female customers.<br />
We have diligently followed a scrap-and-build policy to maximize our efficiency in arcade operations.<br />
Net Sales (Millions of yen) Operating Margin<br />
(%)<br />
13,043 13,406 13,509<br />
Specialize in opening mall-based<br />
large-scale facilities which secure<br />
a stable customer base<br />
Thorough scrap and build<br />
focused on investment efficiency<br />
ensure sustainable earnings<br />
Expanded ability to attract<br />
customers through sales of<br />
new machines<br />
Hedges risks through inverse<br />
relationship to home video<br />
game market<br />
11,985<br />
2007 2008 2009 <strong>2010</strong><br />
(YEARS ENDED MARCH 31) (YEARS ENDED MARCH 31)<br />
S W<br />
O T<br />
S: Strength W: Weakness O: Opportunities T: Threats<br />
35<br />
CAPCOM ANNUAL REPORT <strong>2010</strong><br />
15.4<br />
5.6<br />
1.7<br />
Low profitability compared to<br />
other businesses<br />
Little synergy with<br />
proprietary contents<br />
Long-term market<br />
stagnation<br />
Decline in number of<br />
suburban mall-based<br />
large-scale facilities<br />
4.9<br />
2007 2008 2009 <strong>2010</strong><br />
Market Trends<br />
The market continues to contract as a result of fewer<br />
customers and the absence of popular game machines.<br />
The domestic arcade facility market shrank for the second year in a row,<br />
with its value decreasing to 573.1 billion yen (down 15.5% from the previous<br />
year), reflecting the negative effect of the economic downturn on per<br />
customer sales of prize-winning games and the peaking of demand for<br />
multiplayer online games, which until now had led the market (See Diagram<br />
17). In addition, the number of facilities run by major game center operators<br />
came to 21,688 (down 4.6% from the previous year), continuing the downward<br />
trend that began a few years ago. At the same time, the growth rate of<br />
shopping malls and other large-scale facilities was higher than last year,<br />
despite signs of slowing. The number of arcades with more than 100 game<br />
machines grew to 6,885, comprising more than one-third of all facilities<br />
(See Diagram 18).<br />
During the period under review, the market remained weak, with existing<br />
arcade net sales declining by approximately 10% throughout the industry, forcing<br />
companies to restructure. Major contributors to this situation were (1) fewer<br />
customers at shopping centers, caused by the sluggish economy and concerns<br />
over new strains of influenza, (2) a declining number of customers at arcade<br />
facilities as a result of the huge success of home video games and (3) the
Plaza Capcom Inazawa Plaza Capcom Omagari Plaza Capcom Hanyu<br />
Plaza Capcom Kyoto<br />
absence of a popular new game genre to follow multiplayer online games.<br />
Looking ahead, we forecast improved <strong>annual</strong> net sales on a per-store<br />
basis as a result of industrywide, large-scale arcade adjustments and<br />
investment in new products using 3D technology. However, we also believe<br />
it will take time to solve the structural problems mentioned above, with<br />
sluggish market conditions continuing for some time.<br />
Operating Results for This Fiscal Year<br />
Despite a decline in existing arcade net sales to 86% of the previous<br />
year’s figure, income was 162.9% of the previous year’s figure on<br />
the successful implementation of measures to improve earnings.<br />
Capcom’s strengths in this business category are: (1) specialization in opening<br />
mall-based large-scale facilities that quickly secure a long-term stable<br />
customer base, (2) the planning and operation of sales venues popular with<br />
customers and (3) the ability to maintain higher profitability than the<br />
competition by selling or shutting down unprofitable facilities to raise<br />
return on investment (See Diagram 19).<br />
During the period under review, we focused on retaining core users and<br />
expanding the number of female and family users by hosting various events,<br />
conducting promotions and creating comfortable environments to stimulate<br />
demand amid a sluggish market recovery. However, weak consumption and<br />
“nesting consumers” adversely affected our ability to draw in customers,<br />
resulting in existing arcade net sales of 86% of the previous year’s figure.<br />
We also strove to improve profitability by reducing arcade operating<br />
costs, closing two unprofitable arcades and other structural revisions that<br />
605.5<br />
2003<br />
28,355<br />
4,343<br />
4,015<br />
19,997<br />
2003<br />
637.7<br />
26,360<br />
4,591<br />
3,169<br />
18,600<br />
2004<br />
649.2<br />
2004 2005<br />
25,044<br />
5,705<br />
3,562<br />
15,777<br />
2005<br />
682.5<br />
2006<br />
23,902<br />
6,003<br />
3,510<br />
14,389<br />
2006<br />
702.9<br />
2007<br />
Source: JAMMA “Survey on the Amusement Industry” (YEARS ENDED MARCH 31)<br />
23,613<br />
6,390<br />
3,582<br />
13,640<br />
2007<br />
678.1<br />
2008<br />
(categorized by # of arcade machine units)<br />
22,723<br />
6,719<br />
3,279<br />
12,726<br />
2008<br />
Over 101 machines 51~100machines Below 50 machines<br />
(¥ Billion)<br />
573.1<br />
2009<br />
21,688<br />
6,885<br />
3,227<br />
11,576<br />
2009<br />
Source: JAMMA “Survey on the Amusement Industry” (YEARS ENDED MARCH 31)<br />
reduced the number of arcades in operation to 38 as of March 31, <strong>2010</strong>.<br />
As a result of these factors, while net sales declined to 11,985 million yen<br />
(down 11.3% from the previous year), the successful implementation of<br />
measures to improve earnings resulted in operating income of 590 million<br />
yen (up 162.9% from the previous year).<br />
Outlook for the Next Fiscal Year<br />
We have frozen the opening of new arcades, as we<br />
concentrate on improving earnings at existing facilities.<br />
We forecast an operating margin of 5.5%.<br />
In the next fiscal year, despite signs that declines in the amusement market<br />
have bottomed out we believe a self-sustained recovery amid the continued<br />
sluggish economy will require more time, so for the time being, we are<br />
freezing the opening of new arcades to concentrate on improving the<br />
earnings of existing facilities. We will attempt to enhance the efficiency of<br />
our operating structure with a thorough review of all expenses, starting<br />
with rent and the depreciation of prizes and components with high fixed<br />
cost ratios, while controlling capital expenditure through carefully selected<br />
investments in machines to reduce depreciation and amortization expenses.<br />
Having completed the closing of unprofitable facilities this year, to<br />
stabilize earnings we will suspend the opening of new facilities until market<br />
conditions improve. Accordingly, in the fiscal year ending March 31, 2011,<br />
we will open no new facilities and plan to close one.<br />
We forecast net sales of 11 billion yen and operating income of 600<br />
million yen in the fiscal year ending March 31, 2011.<br />
Diagram 17 Arcade Facilities Market Trends<br />
Diagram 19 Comparison of Arcade Operation Performance (March <strong>2010</strong>)<br />
Diagram 18<br />
Change in Number of Storefronts<br />
Aeon Fantasy<br />
Capcom<br />
Adores<br />
Namco Bandai<br />
Holdings<br />
Sega Sammy<br />
Holdings<br />
Total<br />
Net sales<br />
(¥ Million)<br />
43,706<br />
11,985<br />
26,034<br />
65,362<br />
54,835<br />
201,922<br />
Share<br />
(%)<br />
21.6<br />
5.9<br />
12.9<br />
32.4<br />
27.2<br />
100.0<br />
Operating<br />
income<br />
(¥ Million)<br />
2,514<br />
590<br />
848<br />
284<br />
–1,338<br />
89.9<br />
88.7<br />
94.7<br />
84.6<br />
76.9<br />
Source: Financial Results FY 2009 by respective company and support documentation<br />
(Aeon Fantasy fiscal end in February <strong>2010</strong>)<br />
–<br />
Operating<br />
margin<br />
(%)<br />
5.8<br />
4.9<br />
3.3<br />
0.4<br />
–2.4<br />
–<br />
Year-on-year<br />
rise<br />
(%)<br />
CAPCOM ANNUAL REPORT <strong>2010</strong><br />
–<br />
36<br />
Overview of Capcom’s<br />
Business and Outlook for the Future
Overview of Capcom’s Business and Outlook for the Future<br />
Net Sales (Millions of yen) Operating Margin<br />
(%)<br />
37<br />
8,060<br />
6,574<br />
SWOT Analysis<br />
8,031<br />
(YEARS ENDED MARCH 31) (YEARS ENDED MARCH 31)<br />
High quality video game machines<br />
make use of home video game<br />
development capabilities<br />
Maximize profits through link<br />
with home video game consoles<br />
Ability to observe real time<br />
market movements though<br />
company-owned arcades<br />
Market recovery via<br />
introduction of popular<br />
machines<br />
Market expansion through<br />
network and 3D and other new<br />
technologies<br />
2,280<br />
2007 2008 2009 <strong>2010</strong><br />
S W<br />
O T<br />
S: Strength W: Weakness O: Opportunities T: Threats<br />
CAPCOM ANNUAL REPORT <strong>2010</strong><br />
Arcade Game Sales<br />
We develop, produce and distribute arcade games for amusement facilities. We concentrate our efforts<br />
on the development of coin-operated and prize-winning games, which are in high demand, and supply<br />
software for arcade video games to secure a stable customer base.<br />
17.0<br />
18.0<br />
21.9<br />
Lack of title lineup<br />
Low profitability<br />
Declining operator<br />
investment appetite<br />
Long-term market<br />
stagnation<br />
-8.9<br />
2007 2008 2009 <strong>2010</strong><br />
Market Trends<br />
The market continued to shrink for the second straight year,<br />
as the number of visitors to mall-based facilities declined.<br />
After growing for the five consecutive years through 2007, the market for<br />
arcade machines, which took a slight downward turn in 2008, remained<br />
adversely affected by the global recession. The domestic market was worth<br />
182.8 billion yen (down 11.0% from the previous year), while the overseas<br />
market amounted to 11.3 billion yen (down 1.6% from the previous year).<br />
The combined market was worth 196.2 billion yen (down 10.5% from the<br />
previous year) (See Diagram 20).<br />
As for market trends by product category, prize-winning games accounted<br />
for 19.8% of the market, with sales totaling 36.2 billion yen (down 10.0% from<br />
the previous year) due to this segment’s particular sensitivity to business<br />
conditions. Coin-operated game accounted for 20.3% of the market, with<br />
sales totaling 37.1 billion yen (down 15.7% from the previous year), reflecting<br />
the peak in demand for large game machines and sluggish pachislo<br />
coin-operated game sales (See Diagram 21). During the period under review,<br />
a significant number of mall-based facilities managed by major game software<br />
companies, which comprise a large percentage of this segment, were closed.<br />
The current trends in the arcade game market are focused on network<br />
game machines targeting the core user segment, which has a high percentage
Coin-operated game “Mario party<br />
Fushigi no Korokoro Catcher”<br />
Licensed by Nintendo<br />
©2007 Nintendo /<br />
©2007 HUDSON SOFT /<br />
©CAPCOM CO.,LTD.2009<br />
ALL RIGHTS RESERVED.<br />
Coin-operated game<br />
"Chibi Maruko Chan"<br />
of sales per customer and repeat users. Efforts are being made to earn<br />
additional profits and reduce operator investment with respect to network<br />
game machines by introducing content billing and shared sales models<br />
designed to provide mutual benefits. At the same time, investment in the<br />
development of products appealing to families, couples and other members<br />
of the casual user segment has been shifted to small- and medium-sized<br />
game machines due to a major decline in the number of these customers.<br />
The outlook for the foreseeable future is the continued stagnation of the<br />
sales market, as facilities operators remain cautious about capital expenditure<br />
owing to signs that the facilities market has bottomed out. The facilities<br />
operations business will continue to struggle in the face of declining numbers of<br />
customers at shopping malls due to the sluggish economy and concerns over<br />
swine influenza, the repercussions of a prosperous home video game market<br />
on the number of customers visiting amusement facilities and the absence of<br />
popular new machines to follow in the footsteps of multi-player online games.<br />
Operating Results for This Fiscal Year<br />
A cooling of the market resulted in business restructuring<br />
and major declines in sales and profits.<br />
One strength in this business category lies in our ability to provide high-quality<br />
arcade video games by making use of development capabilities for home<br />
video game software. In particular, combat-based fighting games, our flagship<br />
genre, allow us to maximize profits by launching the same content as for<br />
home video games.<br />
Another strength comes from the fact that we own company-managed<br />
facilities, enabling an awareness of market trends in real-time, such as in-store<br />
information related to popular games. We introduce trial game machines at<br />
company-based facilities to gather opinions of users and facility operators<br />
that are then used to develop popular game machines. In light of the sluggish<br />
market environment in fiscal 2009, we made an effort to expand our existing<br />
customer base and create new customers through the release of “Mario Party<br />
Prize-winning game<br />
"Bell Circle Sparkling Blue"<br />
Arcade video game “Super Street Fighter IV”<br />
Diagram 20 Arcade Game Market Trends<br />
Diagram 21 Breakdown of the Arcade Game Market by Game Type<br />
120.2<br />
2002<br />
134.5<br />
164.0<br />
2003 2004<br />
167.7<br />
2005<br />
188.6<br />
2006<br />
210.2<br />
2007<br />
205.5<br />
2008<br />
(¥ Billion)<br />
182.8<br />
2009<br />
Source: JAMMA “Survey on the Amusement Industry” (YEARS ENDED MARCH 31)<br />
Fushigi no Korokoro Catcher” and other medal game machines. Also, despite<br />
a business partnership with NAMCO BANDAI Games Inc. in an attempt to<br />
break the market deadlock and an all-out effort to expand sales, we faced<br />
an uphill battle in terms of the business development surrounding repeat<br />
main products, and were ultimately forced to restructure this business.<br />
As a result, net sales were 2,280 million yen (down 71.6% from the<br />
previous year), while operating income was 203 million yen (compared to<br />
1,758 million yen in the previous year).<br />
Outlook for the Next Fiscal Year<br />
We will take decisive actions on organizational reforms and<br />
focus efforts on market-oriented product development.<br />
In the next fiscal year, facility operators’ investment “selection and concentration”<br />
will continue despite indications that the market decline has stopped. We<br />
will ensure profitability by investing in video game machines, focusing on<br />
popular machines with proven track records.<br />
At the same time, in consideration of our significant losses in the previous fiscal<br />
year, we will conduct major organizational reforms. By combining our Arcade<br />
Operations and Arcade Game Sales businesses, we will be able to focus on<br />
market-oriented product development. In addition, we will strengthen our title<br />
lineup through the implementation of our “Single Content Multiple Usage” strategy.<br />
Furthermore, we will integrate our Development Department, which is<br />
currently divided between Tokyo and Osaka, as well as consolidate our<br />
manufacturing sites to accelerate the speed at which we introduce products.<br />
We plan to concentrate on the highly profitable “Super Street Fighter IV” as our<br />
core product, in addition to the release of one other coin-operated video game.<br />
From the next fiscal year, we will move the Pachinko & Pachislo Business<br />
(currently part of Contents Expansion) to Arcade Games Sales as the<br />
“Amusement Equipments Business”.<br />
As a result of these measures and changes, we forecast segment net<br />
sales of 5 billion yen and operating income of 1.2 billion yen.<br />
Others<br />
20.5 (11.2%)<br />
Music Game<br />
4.2 (2.3%)<br />
Printing<br />
12.1 (6.6%)<br />
Game Card<br />
24.4 (13.3%)<br />
2009<br />
Total 182.8<br />
(¥ Billion)<br />
Prize-winning Games<br />
36.2 (19.8%)<br />
Coin-operated Games<br />
37.1 (20.3%)<br />
Dedicated<br />
28.1 (15.4%)<br />
Video<br />
20.3 (11.1%)<br />
Source: JAMMA “Survey on the Amusement Industry” (YEARS ENDED MARCH 31)<br />
CAPCOM ANNUAL REPORT <strong>2010</strong><br />
38<br />
Overview of Capcom’s<br />
Business and Outlook for the Future
Overview of Capcom’s Business and Outlook for the Future<br />
Net Sales (Millions of yen) Operating Margin<br />
(%)<br />
2,561<br />
2,947 2,824 2,736<br />
2007 2008 2009 <strong>2010</strong><br />
SWOT Analysis<br />
Synergy effect from multiple use<br />
of abundant content<br />
Brand value increased through<br />
high media exposure<br />
High profitability<br />
Expansion of film, animation,<br />
comics, stage productions,<br />
orchestras and other<br />
development media<br />
S W<br />
O T<br />
S: Strength W: Weakness O: Opportunities T: Threats<br />
39<br />
CAPCOM ANNUAL REPORT <strong>2010</strong><br />
Other Businesses<br />
Based on a “Single Content Multiple Usage” strategy of developing game content for various media, we<br />
will pursue a variety of copyright-related business opportunities including publishing (walkthrough and<br />
strategy guides as well as game settings collections) and licensing (music CDs and licensed merchandise).<br />
Furthermore, we are concentrating on developing game content into movie and TV animation programs.<br />
-17.2<br />
15.9<br />
37.3<br />
40.1<br />
2007 2008 2009 <strong>2010</strong><br />
(YEARS ENDED MARCH 31) (YEARS ENDED MARCH 31)<br />
Low return of sales of licensed<br />
products<br />
Direct competition with<br />
other company’s contents as<br />
a result of globalization<br />
Operating Results for This Fiscal Year<br />
The successful development of our “Single Content Multiple<br />
Usage” long-term strategy resulted in higher profits despite<br />
lower revenues.<br />
Capcom’s strength in this category is its ability to take advantage of the strong<br />
synergy with the Home Video Games Business by making multifaceted use<br />
of its abundant intellectual properties. In particular, the brand value of our<br />
movie-related business has risen through extensive media exposure. This leads<br />
to greater sales of video game software, completing a virtuous sales cycle.<br />
During this fiscal year, we continued to execute our “Single Content<br />
Multiple Usage” strategy (see “Our Strategy for Growth” on P. 25), conducting<br />
various projects based on each game title to enhance the branding of our game<br />
content and maximize profits.<br />
These projects were implemented across all business segments, with each<br />
division involved in the launch of arcade games, mobile content, walkthrough<br />
and strategy guides and character goods, as well as movie and TV animation<br />
programs and other events in connection with the release of our home<br />
video games (See Diagram 22).<br />
Specifically, we focused on increasing the “adaptation of our game content<br />
into Hollywood movies”, which strengthens the promotion and sales of home<br />
video games.
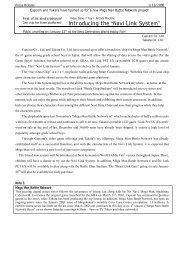
Election promotion poster<br />
“Sengoku BASARA”<br />
Although other Japanese software manufacturers have made similar moves,<br />
the number of Capcom game titles adapted into movies and the attendant<br />
box-office revenues demonstrate our clear competitive advantage in this area.<br />
This success is a result of (1) our strength in creating original content,<br />
underpinned by owning more proprietary content than our competitors<br />
and (2) the global popularity of our titles, which are suitable for adaptation<br />
into Hollywood movies for global distribution (See Diagram 23).<br />
For example, we timed the April 2009 sales launch of home video game<br />
“Sengoku BASARA Battle Heroes” to coincide with the start of the TV animation<br />
broadcast, and in June we began offering a related package tour through a<br />
tie-up with the Japan Travel Bureau (JTB) Corporation. In July, we began<br />
stage performances and launched a merchandise series and printed<br />
materials. Furthermore, the character was used in PR activities conducted<br />
for the Miyagi Prefecture gubernatorial election in an attempt to go beyond<br />
the gaming framework and develop content over the long-term.<br />
Such ongoing projects are successful at creating trends like the “Rekijo”<br />
(women who like history) and “Sengoku” , increasing the brand value of<br />
“Sengoku BASARA”.<br />
We also promoted several multi-development projects, including those<br />
involving “Street Fighter”, “Resident Evil“, “Ace Attorney” , “Monster Hunter”<br />
and “Dead Rising”.<br />
As a result of these efforts, net sales during the period under review<br />
declined to 2,736 million yen (down 3.1% from the previous year), while<br />
Diagram 22<br />
Movie<br />
TV<br />
animation<br />
Theatrical<br />
production<br />
Aug. 1994<br />
Dec. 1994<br />
Mar. 2002<br />
Sep. 2004<br />
Mar. 2005<br />
Nov. 2007<br />
Oct. 2008<br />
Feb. 2009<br />
Aug. <strong>2010</strong><br />
Sep. <strong>2010</strong><br />
Apr. 1995<br />
Mar. 2002<br />
Oct. 2006<br />
Jun. 2007<br />
Apr. 2009<br />
Jul. <strong>2010</strong><br />
Aug. <strong>2010</strong><br />
Feb. 2009<br />
Jul. 2009<br />
Aug. 2009<br />
Apr. <strong>2010</strong><br />
Animated movie<br />
Hollywood movie<br />
Hollywood movie<br />
Hollywood movie<br />
Animated movie<br />
Hollywood movie<br />
CG movie<br />
Hollywood movie<br />
Movie<br />
Hollywood movie<br />
TV animation<br />
TV animation<br />
TV animation<br />
TV animation<br />
TV animation<br />
TV animation<br />
TV animation<br />
Takarazuka Revue Company<br />
Theatrical production<br />
Takarazuka Revue Company<br />
Theatrical production<br />
Movie “Resident Evil: Afterlife 3D”<br />
©<strong>2010</strong> Sony Pictures Entertainment(J) Inc. All Rights Reserved.<br />
List of our content that has been adapted into<br />
movies and theatrical productions<br />
Street Fighter II<br />
Street Fighter<br />
Resident Evil<br />
Resident Evil: Apocalypse<br />
Mega Man Battle Network<br />
Resident Evil: Extinction<br />
Resident Evil: Degeneration<br />
Street Fighter: The Legend of Chun-Li<br />
ZOMBREX DEAD RISING SUN<br />
Resident Evil: Afterlife 3D<br />
Street Fighter II V<br />
Mega Man Battle Network<br />
Mega Man Star Force<br />
Devil May Cry<br />
Sengoku BASARA<br />
Sengoku BASARA2<br />
MONHAN NIKKI GIRIGIRI AYRU MURA AIRU KIKI IPPATSU<br />
Phoenix Wright: Ace Attorney – The Truth Comes Back to Life<br />
Sengoku BASARA<br />
Phoenix Wright: Ace Attorney 2<br />
Sengoku BASARA Stage Adaptation second stage<br />
Movie “ZOMBREX<br />
DEAD RISING SUN”<br />
operating income increased to 1,097 million yen (up 4.1% from the previous<br />
year).<br />
Outlook for the Next Fiscal Year<br />
We will engage in multi-development projects including<br />
Hollywood movie adaptations and new theme park attractions.<br />
Looking ahead, we will continue to execute our “Single Content Multiple<br />
Usage” strategy.<br />
In the movie-related business, global titles for movie adaptation will<br />
include “Resident Evil: Afterlife 3D”, “Onimusha”, “Lost Planet” and “Clock<br />
Tower”. We will also test a new promotional development by streaming a<br />
movie adaptation of “Dead Rising” on the Internet. “Sengoku BASARA” will<br />
be adapted for the second round of the stage, TV animation and package<br />
tour offered by JTB. Also, a new attraction based on “Sengoku BASARA” is<br />
scheduled for installation at Fuji-Q Highland in Yamanashi Prefecture.<br />
Other content development includes a new attraction based on “Monster<br />
Hunter” that is scheduled to be installed at an amusement park, Greenland<br />
in Kumamoto Prefecture, with the distribution of goods for amusement<br />
facilities slated to coincide with the year-end sales launch of software for<br />
home video games.<br />
Functioning as multimedia development for game content, these<br />
cross-industry collaborations enable our products to reach a wider audience<br />
and enhance our brand value.<br />
In light of these efforts, we forecast net sales in the next fiscal year of<br />
3.5 billion yen and operating income of 1 billion yen.<br />
Diagram 23<br />
Title<br />
1. RESIDENT EVIL: EXTINCTION<br />
2. RESIDENT EVIL: APOCALYPSE<br />
3. RESIDENT EVIL<br />
4. STREET FIGHTER<br />
5. SILENT HILL<br />
6. FINAL FANTASY: THE SPIRITS WITHIN<br />
7. SUPER MARIO BROS.<br />
8. HOUSE OF THE DEAD<br />
9. STREET FIGHTER: THE LEGEND OF CHUN-LI<br />
10. DOA: DEAD OR ALIVE<br />
- TEKKEN<br />
Event “Monster Hunter World”<br />
List of Japanese game content that has been<br />
adapted into movies<br />
Original writer<br />
company<br />
Capcom<br />
Capcom<br />
Capcom<br />
Capcom<br />
Konami<br />
Square<br />
Nintendo<br />
Sega<br />
Capcom<br />
Tecmo<br />
NAMCO BANDAI<br />
Games<br />
Box-office revenue<br />
(worldwide)<br />
$147,717,833<br />
$129,394,835<br />
$102,441,078<br />
$99,423,521<br />
$97,607,453<br />
$85,131,830<br />
$20,915,465<br />
$13,818,181<br />
$12,764,201<br />
$7,516,532<br />
Unpublished<br />
As of June, <strong>2010</strong><br />
(Capcom figures)<br />
CAPCOM ANNUAL REPORT <strong>2010</strong><br />
40<br />
Overview of Capcom’s<br />
Business and Outlook for the Future