annual_2010_07.pdf
annual_2010_07.pdf
annual_2010_07.pdf

Create successful ePaper yourself
Turn your PDF publications into a flip-book with our unique Google optimized e-Paper software.
Overview of Capcom’s Business and Outlook for the Future<br />
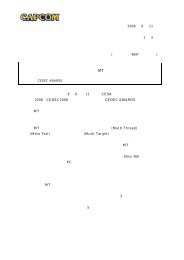
Net Sales (Millions of yen) Operating Margin<br />
(%)<br />
37<br />
8,060<br />
6,574<br />
SWOT Analysis<br />
8,031<br />
(YEARS ENDED MARCH 31) (YEARS ENDED MARCH 31)<br />
High quality video game machines<br />
make use of home video game<br />
development capabilities<br />
Maximize profits through link<br />
with home video game consoles<br />
Ability to observe real time<br />
market movements though<br />
company-owned arcades<br />
Market recovery via<br />
introduction of popular<br />
machines<br />
Market expansion through<br />
network and 3D and other new<br />
technologies<br />
2,280<br />
2007 2008 2009 <strong>2010</strong><br />
S W<br />
O T<br />
S: Strength W: Weakness O: Opportunities T: Threats<br />
CAPCOM ANNUAL REPORT <strong>2010</strong><br />
Arcade Game Sales<br />
We develop, produce and distribute arcade games for amusement facilities. We concentrate our efforts<br />
on the development of coin-operated and prize-winning games, which are in high demand, and supply<br />
software for arcade video games to secure a stable customer base.<br />
17.0<br />
18.0<br />
21.9<br />
Lack of title lineup<br />
Low profitability<br />
Declining operator<br />
investment appetite<br />
Long-term market<br />
stagnation<br />
-8.9<br />
2007 2008 2009 <strong>2010</strong><br />
Market Trends<br />
The market continued to shrink for the second straight year,<br />
as the number of visitors to mall-based facilities declined.<br />
After growing for the five consecutive years through 2007, the market for<br />
arcade machines, which took a slight downward turn in 2008, remained<br />
adversely affected by the global recession. The domestic market was worth<br />
182.8 billion yen (down 11.0% from the previous year), while the overseas<br />
market amounted to 11.3 billion yen (down 1.6% from the previous year).<br />
The combined market was worth 196.2 billion yen (down 10.5% from the<br />
previous year) (See Diagram 20).<br />
As for market trends by product category, prize-winning games accounted<br />
for 19.8% of the market, with sales totaling 36.2 billion yen (down 10.0% from<br />
the previous year) due to this segment’s particular sensitivity to business<br />
conditions. Coin-operated game accounted for 20.3% of the market, with<br />
sales totaling 37.1 billion yen (down 15.7% from the previous year), reflecting<br />
the peak in demand for large game machines and sluggish pachislo<br />
coin-operated game sales (See Diagram 21). During the period under review,<br />
a significant number of mall-based facilities managed by major game software<br />
companies, which comprise a large percentage of this segment, were closed.<br />
The current trends in the arcade game market are focused on network<br />
game machines targeting the core user segment, which has a high percentage