The book of abstracts is available. - PoznaÅ
The book of abstracts is available. - PoznaÅ
The book of abstracts is available. - PoznaÅ

You also want an ePaper? Increase the reach of your titles
YUMPU automatically turns print PDFs into web optimized ePapers that Google loves.
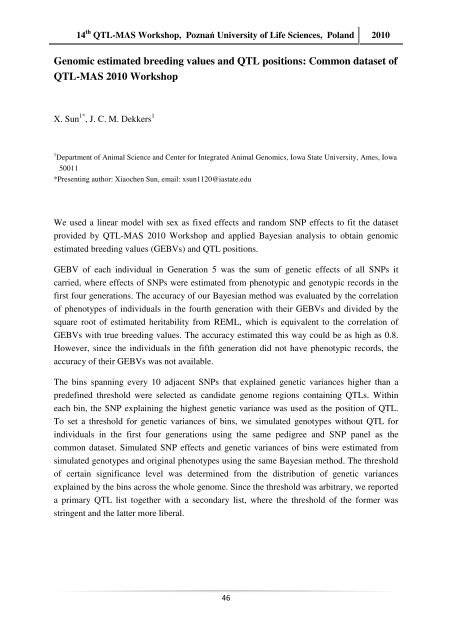
14 th QTL-MAS Workshop, Poznań University <strong>of</strong> Life Sciences, Poland 2010Genomic estimated breeding values and QTL positions: Common dataset <strong>of</strong>QTL-MAS 2010 WorkshopX. Sun 1* , J. C. M. Dekkers 11 Department <strong>of</strong> Animal Science and Center for Integrated Animal Genomics, Iowa State University, Ames, Iowa50011*Presenting author: Xiaochen Sun, email: xsun1120@iastate.eduWe used a linear model with sex as fixed effects and random SNP effects to fit the datasetprovided by QTL-MAS 2010 Workshop and applied Bayesian analys<strong>is</strong> to obtain genomicestimated breeding values (GEBVs) and QTL positions.GEBV <strong>of</strong> each individual in Generation 5 was the sum <strong>of</strong> genetic effects <strong>of</strong> all SNPs itcarried, where effects <strong>of</strong> SNPs were estimated from phenotypic and genotypic records in thefirst four generations. <strong>The</strong> accuracy <strong>of</strong> our Bayesian method was evaluated by the correlation<strong>of</strong> phenotypes <strong>of</strong> individuals in the fourth generation with their GEBVs and divided by thesquare root <strong>of</strong> estimated heritability from REML, which <strong>is</strong> equivalent to the correlation <strong>of</strong>GEBVs with true breeding values. <strong>The</strong> accuracy estimated th<strong>is</strong> way could be as high as 0.8.However, since the individuals in the fifth generation did not have phenotypic records, theaccuracy <strong>of</strong> their GEBVs was not <strong>available</strong>.<strong>The</strong> bins spanning every 10 adjacent SNPs that explained genetic variances higher than apredefined threshold were selected as candidate genome regions containing QTLs. Withineach bin, the SNP explaining the highest genetic variance was used as the position <strong>of</strong> QTL.To set a threshold for genetic variances <strong>of</strong> bins, we simulated genotypes without QTL forindividuals in the first four generations using the same pedigree and SNP panel as thecommon dataset. Simulated SNP effects and genetic variances <strong>of</strong> bins were estimated fromsimulated genotypes and original phenotypes using the same Bayesian method. <strong>The</strong> threshold<strong>of</strong> certain significance level was determined from the d<strong>is</strong>tribution <strong>of</strong> genetic variancesexplained by the bins across the whole genome. Since the threshold was arbitrary, we reporteda primary QTL l<strong>is</strong>t together with a secondary l<strong>is</strong>t, where the threshold <strong>of</strong> the former wasstringent and the latter more liberal.46