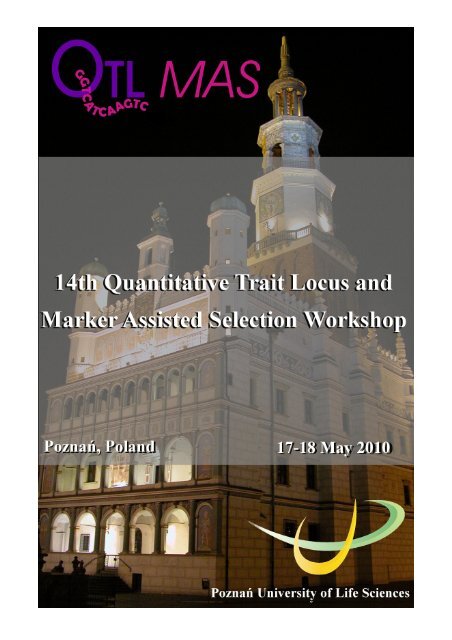
The book of abstracts is available. - PoznaÅ
The book of abstracts is available. - PoznaÅ
The book of abstracts is available. - PoznaÅ

Create successful ePaper yourself
Turn your PDF publications into a flip-book with our unique Google optimized e-Paper software.
<strong>The</strong> <strong>book</strong> <strong>of</strong> <strong>abstracts</strong>14 th QTL – MAS Worksop
<strong>The</strong> <strong>book</strong> <strong>of</strong> <strong>abstracts</strong>14 th QTL – MAS Workshop<strong>The</strong> 14 th QTL-MAS workshop has been organized by Poznań University <strong>of</strong> Life Sciences,Department <strong>of</strong> Genetics and Animal Breeding, in collaboration with Wroclaw University<strong>of</strong> Environmental and Life Sciences and <strong>The</strong> Wielkopolska Regional Centre <strong>of</strong> AnimalBreeding and Reproduction in Poznań, based in Tulce Ltd.<strong>The</strong> core <strong>of</strong> the Organizing Committee cons<strong>is</strong>ts <strong>of</strong>:Paweł KrajewskiTomasz StrabelJoanna SzydaKrzyszt<strong>of</strong> MolińskiTomasz SzwaczkowskiMaciej Szydłowski<strong>The</strong> Workshop <strong>is</strong> organized with support from:Alicja BorowskaDagna KręgielskaSebastian MuchaPaulina PaczyńskaMarcin PszczołaKatarzyna RzewuskaAnna WolcKacper ŻukowskiTh<strong>is</strong> <strong>book</strong> <strong>of</strong> <strong>abstracts</strong> has been edited by the Organizing Committee.
HONORARY PATRONAGE14 th QTL-MAS 2010 workshop has been organized under the honorarypatronage <strong>of</strong>:Min<strong>is</strong>ter <strong>of</strong> Agriculture and Rural DevelopmentMarshal <strong>of</strong> the Wielkopolska Region<strong>The</strong> Mayor <strong>of</strong> the City <strong>of</strong> Poznań
<strong>The</strong> following sponsors have provided financial support tothe 14 th QTL-MAS workshop:Breeding and Insemination Centre “SHIUZ” in Bydgoszcz<strong>The</strong> Wielkopolska Regional Centre <strong>of</strong> Animal Breeding andReproduction in Poznań, based in Tulce Ltd.Illumina Inc.Cobb-Vantress, Inc.Mazowieckie Centrum Hodowli i Rozrodu Zwierząt Sp. z o.o.w ŁowiczuPol<strong>is</strong>h Federation <strong>of</strong> Cattle Breeders and Dairy FarmersP. H. KONRAD in ŁomżaSAS Institute<strong>The</strong> Małopolskie Biotechnology Centre company
CONTENTSPROGRAM………………………………………………………………………………………...8ABSTRACTS……………………………………………………………….…………………13
14 th QTL-MAS Workshop, Poznań University <strong>of</strong> Life Sciences, Poland 2010PROGRAMMonday May 17 thMorningChair: Tomasz Strabel 9:00 – 12:30Session I Genetic architecture and QTL mapping <strong>of</strong> quantitative traits09:00 Organizing Committee Opening and introduction09:15 William Hill Genetic architecture <strong>of</strong> quantitative traits(invited)09:45 Mats Pettersson Re-examining ep<strong>is</strong>tatic interactions inVirginia line chickens10:00 Carl Nettelblad Haplotype inference based on HiddenMarkov Models in the QTL-MASmulti-generational dataset10:15 Maciej Szydłowski QTL-MAS 2010: Simulated Dataset10:30 - 11:00 C<strong>of</strong>fee break11:00 Aniek Bouwman A Bayesian approach to detect (pleiotropic)QTL affecting a simulated binary andquantitative trait11:15 Albart Coster Partial least square regression applied to theQTL-MAS 2010 dataset11:30 Mario Calus Genomic breeding value estimation and QTLdetection using univariate and bivariatemodels11:45 Xia Shen Hierarchical likelihood opens a new way <strong>of</strong>estimating genetic values using genome-widedense marker maps12:00 Burak Karacaören Association analyses <strong>of</strong> the QTL-MAS dataset using grammar, principal components andBayesian network methodologies12:15 Kacper Żukowski Testing association <strong>of</strong> genotypes withd<strong>is</strong>crete and continuous traits12:30 - 13:30 Lunch7
14 th QTL-MAS Workshop, Poznań University <strong>of</strong> Life Sciences, Poland 2010Monday May 17 thAfternoonChair: Paweł Krajewski 13:30 – 17:00Session II Methods for QTL mapping detection and association analys<strong>is</strong>13:30 Karl Broman <strong>The</strong> genetic d<strong>is</strong>section <strong>of</strong> complex traits inmodel organ<strong>is</strong>ms (invited)14:00 Animesh Acharjee Integrating genetic markers with ~omics datausing genetical genomics and modern regressionmethods14:15 Ghyslaine Schopen Genome wide association study using single andmultiple SNP analys<strong>is</strong>14:30 Simon Teyssèdre Robustness and power <strong>of</strong> single-SNP analys<strong>is</strong> inrelated populations14:45 Lucy Crooks Compar<strong>is</strong>on <strong>of</strong> an improved method forcalculating line origin probabilities againstGridQTL using simulated data15:00 - 15:30 C<strong>of</strong>fee break15:30 Yurii Aulchenko Tutorial on *ABEL package (invited)16:00 Robin Wellmann Genome wide evaluation using dominance16:15 Anna Johansson Genome wide effects <strong>of</strong> divergent selection forbody weight in chickens16:30 Saber Qanbari Using genome scans <strong>of</strong> DNA polymorph<strong>is</strong>m toidentify regions exhibiting positive selection16:45 Organizing Committee Comparative analys<strong>is</strong> <strong>of</strong> submitted results onQTL mapping and applied methods18:30 – 21:00 Dinner8
14 th QTL-MAS Workshop, Poznań University <strong>of</strong> Life Sciences, Poland 2010Tueasday May 18 thMorningChair: Joanna Szyda 9:00 – 12:30Session III Methods for estimation <strong>of</strong> genomic breeding values09:00 Małgorzata Bogdan Genome-wide scans for quantitative traitloci in experimental populations - <strong>is</strong>sues <strong>of</strong>multiple testing and model selection(invited)09:30 Matthew Cleveland Genotype imputation for the prediction <strong>of</strong>genomic breeding values in non-genotypedand low-density genotyped individuals09:45 Joseph Ogutu A compar<strong>is</strong>on <strong>of</strong> random forests, boostingand support vector machines for genomicselection with SNP markers10:00 Zhe Zhang Genomic selection using Best LinearUnbiased Prediction with a trait specificrelationship matrix10:15 Javad Nadaf Applying different genomic selectionapproaches on QTL-MAS 2010 data10:30 Torben Schulz-Streeck Pre-selection <strong>of</strong> markers for genome-wideselection10:45 - 11:15 C<strong>of</strong>fee break11:15 Yurii Aulchenko Methods for genome-wide associationanalyses <strong>of</strong> quantitative traitloci in human genetically <strong>is</strong>olatedpopulations (invited)11:45 Ronald Nelson A new R package for QTL analys<strong>is</strong>12:00 Kacper Żukowski <strong>The</strong> estimation <strong>of</strong> SNP effects on a binaryand a quantitative trait12:15 Magdalena Malina Logic regression based methods inapplication to detection <strong>of</strong> gene-geneinteractions12:30 - 13:30 Lunch9
14 th QTL-MAS Workshop, Poznań University <strong>of</strong> Life Sciences, Poland 2010Tuesday May 18 thAfternoonChair: Maciej Szydłowski 13:30 – 16:45Session IV Application <strong>of</strong> genomic selection13:30 Alain Charcosset Genetic architecture <strong>of</strong> yield and relatedtraits in European maize: insights into theeffects <strong>of</strong> linkage and allelic series.Consequences for marker ass<strong>is</strong>tedselection (invited)14:00 Weronica Ek Mapping systemic scleroderma genes in across between UCD200 and jungle fowlchickens14:15 Joanna Szyda Genomic selection in Pol<strong>is</strong>h Holstein14:30 Jan-Thijs van Kaam Validation experiences in Italian Holsteingenomic selection14:45 Organizing Committee Analys<strong>is</strong> <strong>of</strong> submitted breeding values andapplied methods15:00 - 15:30 C<strong>of</strong>fee break15:30 Karl Broman Tutorial on R/qtl (invited)16:15 Paweł Krajewski POLAPGEN-BD: a project on biotechnologyfor breeding cereals with increased res<strong>is</strong>tanceto drought16:30 Organizing Committee QTL-MAS 2010 Closing remarks10
14 th QTL-MAS Workshop, Poznań University <strong>of</strong> Life Sciences, Poland 2010ABSTRACTS11
14 th QTL-MAS Workshop, Poznań University <strong>of</strong> Life Sciences, Poland 2010Genetic architecture <strong>of</strong> quantitative traitsWilliam G. Hill 1∗1 Institute <strong>of</strong> Evolutionary Biology, University <strong>of</strong> Edinburgh∗ Presenting author: William Hill, email: w.g.hill@ed.ac.ukUnderstanding the ‘black box’ <strong>of</strong> the genetics <strong>of</strong> quantitative traits has been a long standingobjective. Important unknowns are the numbers <strong>of</strong> loci involved, and the d<strong>is</strong>tribution <strong>of</strong> theirfrequencies, effects on the trait and their interactions <strong>The</strong>se depend both on the basicarchitecture and on the selective and other forces whereby variation <strong>is</strong> lost or maintained.Some information has come at the quantitative level from covariances among relatives,inbreeding and selection experiments which indicate many loci are responsible. <strong>The</strong>availability <strong>of</strong> dense markers provides the opportunity for deeper study, but although somegenes <strong>of</strong> large effect have been detected, genome wide association studies <strong>of</strong> traits in humansalso indicate many loci are contributing to variation.I shall d<strong>is</strong>cuss what we may expect on the bas<strong>is</strong> <strong>of</strong> population genetics theory and knowledge<strong>of</strong> parameters to be the d<strong>is</strong>tributions <strong>of</strong> effects and frequencies, how these influenceinferences that can be drawn from GWAS and similar studies, and how these relate toobservations.12
14 th QTL-MAS Workshop, Poznań University <strong>of</strong> Life Sciences, Poland 2010Re-examining ep<strong>is</strong>tatic interactions in Virginia line chickensMats E. Pettersson 1∗1Computational Genetics, Department <strong>of</strong> Animal Breeding and Genetics, Swed<strong>is</strong>h Univer<strong>is</strong>ty <strong>of</strong> Agriculture∗ Presenting author: Mats Pettersson, email: mats.pettersson@hgen.slu.seIt has previously been shown that a substantial fraction <strong>of</strong> the phenotypic difference betweenthe high growth and low growth lines <strong>of</strong> Virginia lines chicken, which show a nine-folddifference in body-weight after 50 generations <strong>of</strong> differential selection, can be attributed toep<strong>is</strong>tatic interactions between different QTL 1 .<strong>The</strong> present study <strong>is</strong> based on data from an advanced intercross line, with a pedigree reachingdown to an F 8 generation, that <strong>is</strong> an extension <strong>of</strong> the F2 population originally used. In th<strong>is</strong> dataset, which also has a higher density <strong>of</strong> markers, the ep<strong>is</strong>tatic interactions, as well as singleQTL effects, have been re-evaluated. I employ a bootstrapping method to improve thereliability <strong>of</strong> QTL detection, and use data stratification to show ep<strong>is</strong>tatic interactions.<strong>The</strong> results are that several <strong>of</strong> the ep<strong>is</strong>tatic interactions previously found are recovered in th<strong>is</strong>analys<strong>is</strong>, reaffirming the importance <strong>of</strong> ep<strong>is</strong>tas<strong>is</strong> in the system. However, there are also somedifferences; not all interacting pairs are replicated and the total effect <strong>of</strong> ep<strong>is</strong>tas<strong>is</strong> <strong>is</strong> somewhatlower. Nevertheless, the overall picture <strong>is</strong> largely the same.1. Carlborg, Ö., Jacobsson, L., Åhgren, P., Siegel, P. & Andersson, L. Ep<strong>is</strong>tas<strong>is</strong> and the release <strong>of</strong> geneticvariation during long-term selection. Nature Genetics 38, 418-419 (2006).13
14 th QTL-MAS Workshop, Poznań University <strong>of</strong> Life Sciences, Poland 2010Haplotype inference based on Hidden Markov Models in the QTL-MASmulti-generational datasetCarl Nettelblad 1∗1Department <strong>of</strong> Information Technology, Uppsala University∗ Presenting author: Carl Nettelblad, email: carl.nettelblad@it.uu.seBackground. In previous work (Nettelblad et al., LNCS 6462, 2009, Springer Verlag) wedemonstrated an approach for efficient computation <strong>of</strong> genotype probabilities, and moregenerally probabilities <strong>of</strong> allele inheritance in inbred as well as outbred populations. Th<strong>is</strong>work also included an extension for haplotype inference, or phasing, using Hidden MarkovModels. <strong>The</strong> code was able to phase > 99.0 % <strong>of</strong> all heterozygous markers in the dataset fromthe 12 th QTL-MAS correctly.Computational phasing <strong>of</strong> multi-thousand marker datasets has not become common as <strong>of</strong> yet.In th<strong>is</strong> work, we elaborate on the differences in allele probabilities, as well as QTL detectionperformance, when considering an identical workflow with and without phasing based onexpectation-maximization.Results. Using phasing for 20 iterations, almost all heterozygous markers in all generationsconverged. Th<strong>is</strong> makes actual allele origin traceable, back to the founder generation, in over99 % <strong>of</strong> all locus-individual pairs. Some specific regions turned out to be hard to track, but theartifacts were minor in a dense marker set <strong>of</strong> the current type. Haldane mapping d<strong>is</strong>tanceswere also computed during the phasing.A litter/parental effect was fitted for each pair <strong>of</strong> parents for the scalar phenotype in thedataset, explaining about 27.7 % <strong>of</strong> the total phenotypic variance in that phenotype.Obviously, some genetic variance <strong>is</strong> also included in th<strong>is</strong> number.<strong>The</strong> residuals from the litter fitting were fitted against loci, with an indicator vector for eachindividual indicating the allele origin probability for each <strong>of</strong> the 40 founder alleles. Whenusing consecutive forward selection, 5 QTL were identified above a threshold derived fromrandom permutations, accounting for 14.30 % <strong>of</strong> the phenotypic variance.Corresponding results for an identical workflow without phasing, unable to d<strong>is</strong>tingu<strong>is</strong>hbetween founder alleles resulted in a total explainable variance <strong>of</strong> only 6.97 % for the 5highest ranking QTL, although not all <strong>of</strong> those were found significant.Conclusions. Using inferred phasing can greatly increase power and accuracy in multigenerationalQTL detection, at least when simple models are employed.14
14 th QTL-MAS Workshop, Poznań University <strong>of</strong> Life Sciences, Poland 2010QTL-MAS 2010: Simulated DatasetMaciej Szydlowski 1∗1 Poznań University <strong>of</strong> Life Sciences, Poznan, Poland∗ Presenting author: Maciej Szydłowski, email: mcszyd@jay.au.poznan.plHypothetical pedigree data set was simulated for a population cons<strong>is</strong>ting <strong>of</strong> 3226 individualsin 4 generations with large full-sib groups (about 30 <strong>of</strong>fspring per mating).Genome size was about 500 mln bp and it cons<strong>is</strong>ted <strong>of</strong> 5 chromosomes, each about 100 mlnbp long. <strong>The</strong> alleles for 20 founders were generated by the use <strong>of</strong> mh s<strong>of</strong>tware (Hudson 2002)and then dropped down the pedigree assuming incomplete interference. <strong>The</strong> SNP markerswere a random sample from all biallelic sites with MAF>0.1. For each individual a set <strong>of</strong>10031 unordered genotypes was <strong>available</strong>.Two traits were generated: a quantitative trait (Q) and a binary trait (B). <strong>The</strong> Q trait wassimulated assuming 30 random biallelic additive QTLs, two pairs <strong>of</strong> ep<strong>is</strong>tatic QTLs and 3imprinted loci (active paternal allele) and the narrow-sense heritability <strong>of</strong> 33% (30 add loci).<strong>The</strong> B trait was generated under pure additive threshold model, assuming 22 functional SNPsand heritability <strong>of</strong> 50%. <strong>The</strong> two traits shared 22 additive QTLs. Genotypes for 10 functionalSNPs were <strong>available</strong> in the data set. No systematic environmental effect was generated,residuals were normal and uncorrelated. Phenotypes for generation 4 was removed from thedataset.Hudson, R. R. (2002) Generating samples under a Wright-F<strong>is</strong>her neutral model. Bioinformatics 18:337-8.15
14 th QTL-MAS Workshop, Poznań University <strong>of</strong> Life Sciences, Poland 2010A Bayesian approach to detect (pleiotropic) QTL affecting a simulatedbinary and quantitative traitAniek C. Bouwman 1∗ , Luc L.G. Janss 2 , Henri C.M. Heuven 31Animal Breeding and Genomics Centre, Wageningen University, P.O. Box 338, 6700 AH Wageningen, theNetherlands2Aarhus University, DJF Department <strong>of</strong> Genetics and Biotechnology, P.O. Box 50, 8830 Tjele, Denmark3Clinical Sciences <strong>of</strong> Companion Animals, Faculty <strong>of</strong> Veterinary Medicine, Utrecht University, P.O. Box 80163,3508 TD Utrecht, the Netherlands∗ Presenting author: Aniek Bouwman, email: Aniek.Bouwman@wur.nlBackground. <strong>The</strong> simulated dataset <strong>of</strong> the QTL-MAS 2010 workshop in Poznan (Poland) wasanalyzed. <strong>The</strong> data contained 2,326 individuals phenotyped for two traits: a quantitative traitand a binary trait. <strong>The</strong> aim <strong>of</strong> th<strong>is</strong> paper was to detect QTL and to recover the geneticarchitecture <strong>of</strong> the traits. A genome-wide association was performed for each trait consideringall SNPs simultaneous using a Bayesian algorithm.Results. Applying a bivariate animal model in ASReml showed heritabilities <strong>of</strong>approximately 53% for the quantitative trait and approximately 22% for the binary trait. <strong>The</strong>genetic correlation between both traits was 0.66. <strong>The</strong> genome-wide scan revealed eightsignificant and one putative QTL affecting the quantitative trait. <strong>The</strong> genome-wide scanrevealed four significant and six putative QTL affecting the binary trait. <strong>The</strong> QTL differed insize. All SNPs together explained 26% <strong>of</strong> the phenotypic variation <strong>of</strong> the quantitative trait,and 38% <strong>of</strong> the phenotypic variation <strong>of</strong> the binary trait. None <strong>of</strong> the QTL appeared onchromosome 5. Two QTL on chromosome 2 and one QTL on chromosome 3 had an effect onboth traits, indicating pleiotropy, which explains the genetic correlation between the traits.Conclusions. Several QTL have been detected for both traits. <strong>The</strong> three pleiotropic QTLexplain the genetic correlation between the traits.16
14 th QTL-MAS Workshop, Poznań University <strong>of</strong> Life Sciences, Poland 2010Partial least square regression applied to the QTL-MAS 2010 datasetAlbart Coster 1 , Mario P. L. Calus 2∗1Animal Breeding and Genomics Centre, Wageningen University, Wageningen,<strong>The</strong> Netherlands2Animal Breeding and Genomics Centre, Wageningen UR Livestock Research,Lelystad, <strong>The</strong> Netherlands∗ Presenting author: Mario Calus, email: mario.calus@wur.nlBackground. Partial least square regression (PLSR) was used to analyze the data <strong>of</strong> theQTL-MAS 2010 workshop. <strong>The</strong> objectives <strong>of</strong> th<strong>is</strong> analys<strong>is</strong> were to identify genomic regionsaffecting either one <strong>of</strong> the two simulated traits and to accurately predict breeding values forthe two traits <strong>of</strong> the simulated individuals. PLSR was especially appropriate for the analys<strong>is</strong> <strong>of</strong>these data because it enables to simultaneously fit several traits to the large number <strong>of</strong>markers in the data.Results. A preliminary analys<strong>is</strong> showed that the two simulated traits were phenotypically andgenetically correlated. Consequently, the data for the two traits were analyzed jointly in PLSRfor each chromosome independently. Regression coefficients estimated for the markers wereused to calculate the variance <strong>of</strong> each marker and QTL inference was based on local maxima<strong>of</strong> a smoothed line traced through these variances. In th<strong>is</strong> way, 23 QTL for the continuoustrait were found and 30 for the d<strong>is</strong>crete trait. <strong>The</strong>re was clear evidence for pleiotropic QTL onchromosomes 1 and 3. Bootstrapping was used to calculate empirical standard errors <strong>of</strong> theregression coefficients and the 2000 most significant markers were used in a second PLSRmodel which was used to estimate breeding values <strong>of</strong> the individuals based on the markers.Breeding values estimated with th<strong>is</strong> method correlated well (correlation > 0.50) with theobserved phenotypes <strong>of</strong> both traits.Conclusions. Results <strong>of</strong> th<strong>is</strong> analys<strong>is</strong> show the viability <strong>of</strong> PLSR for QTL analys<strong>is</strong> <strong>of</strong>multivariate models and for estimating breeding values using markers. <strong>The</strong> methods used inth<strong>is</strong> study will need to be compared to the other methods used in th<strong>is</strong> workshop.17
14 th QTL-MAS Workshop, Poznań University <strong>of</strong> Life Sciences, Poland 2010Genomic breeding value estimation and QTL detection using univariateand bivariate modelsMario P.L. Calus 1∗ , Han. A. Mulder 1 , Roel F. Veerkamp 11 Animal Breeding and Genomics Centre, Wageningen UR Livestock Research, Lelystad, Netherlands∗ Presenting author: Mario Calus, email: mario.calus@wur.nlBackground. <strong>The</strong> provided simulated dataset, including a quantitative and a binary trait, wasanalyzed with four univariate and bivariate linear models to predict breeding values foranimals without phenotypes. Two models were used that estimated variance components withREML using a numerator relationship matrix (A), or a SNP based genomic relationshipmatrix (G), as well as two SNP based Bayesian models with one (BayesA) or twod<strong>is</strong>tributions (BayesC) for estimated SNP effects. <strong>The</strong> bivariate BayesC model sampled QTLprobabilities for each SNP conditional on both traits. Genotypes were permutated 2000 timesagainst the phenotype and pedigree data, to obtain significance thresholds for the posteriorQTL probabilities.Results. Estimated breeding values had correlations with phenotypes in the referencepopulation ranging from 0.75 and 0.89 for the quantitative trait, and from 0.58 to 0.67 for thebinary trait.Correlations were calculated between all different estimated breeding values, across modelsand traits, for animals without phenotypes. Correlations between the different SNP basedmodels were greater than 0.93 (0.87) for the quantitative (binary) trait. Correlations betweenboth traits ranged from 0.48 to 0.77 for the SNP based models, and from 0.36 to 0.61 formodel A. Correlations between both traits were on average 0.78 (0.55) for the bivariate(univariate) models. Estimated genetic correlations were 0.71 (0.66) for model G (A).<strong>The</strong> bivariate BayesC model detected 17 significant SNPs at the genome-wide level and 24significant SNPs chromosome-wide. Those SNPs clustered into 14 different windows <strong>of</strong>2Mb, suggesting that 14 QTLs were detected.Conclusions. Estimated breeding values <strong>of</strong> three different SNP based models, both in theirunivariate and bivariate forms, were in good agreement. Correlations between estimatedbreeding values <strong>of</strong> both traits indicated that bivariate models made better use <strong>of</strong> the data.Permutating the genotypes against phenotype and pedigree data in the BayesC modelprovided an effective way to derive significance thresholds for the posterior QTLprobabilities.18
14 th QTL-MAS Workshop, Poznań University <strong>of</strong> Life Sciences, Poland 2010Hierarchical likelihood opens a new way <strong>of</strong> estimating genetic values usinggenome-wide dense marker mapsXia Shen 1,2∗ , Lars Rönnegård 2,3 , Örjan Carlborg 1,31<strong>The</strong> Linnaeus Centre for Bioinformatics, Uppsala University, Uppsala, Sweden2Stat<strong>is</strong>tics Group, Dalarna University, Borlänge, Sweden.3Department <strong>of</strong> Animal Breeding and Genetics, Swed<strong>is</strong>h University <strong>of</strong> Agricultural Sciences, Uppsala, Sweden.∗ Presenting author: Xia Shen, email: xia.shen@lcb.uu.seBackground. Genome-wide dense markers can be used to detect genes and estimatepolygenic effects. Among many methods, Bayesian techniques have been shown to bepowerful in genome-wide breeding value estimation and association studies. However,computation <strong>is</strong> known to be intensive in the Bayesian framework, and specifying a suitableprior d<strong>is</strong>tribution for each parameter <strong>is</strong> difficult. We propose to use hierarchical likelihood asan alternative stat<strong>is</strong>tical approach to map genes and estimate genomic breeding values indatasets with dense marker maps, to solve such problems. Using double hierarchicalgeneralized linear models, estimation <strong>of</strong> marker-specific variance <strong>is</strong> unified in one model andestimated using a fast iterative algorithm solely based on weighted least squares.Results. We analyzed the dataset d<strong>is</strong>tributed for the QTL-MAS conference 2010 using doublehierarchical generalized linear models and report breeding value estimates and detected QTL.<strong>The</strong> estimated breeding values obtained using double hierarchical generalized linear modelswere quite similar to those obtained using generalized linear mixed models (Pearsoncorrelation <strong>of</strong> 0.990 for the quantitative trait and 0.987 for the binary trait). Using a smoothedversion <strong>of</strong> the double hierarchical generalized linear model that we propose, QTL were clearlymapped by estimating marker-specific variances.Conclusions. Hierarchical likelihood enables estimating marker-specific variances under anon-Bayesian framework. Double hierarchical generalized linear models can be estimatedusing an iterative algorithm, which greatly shortens the execution time comparing to theBayesian computation. <strong>The</strong>re <strong>is</strong> furthermore no need to specify any priors. Smoothing bydefining spatial correlation reduces no<strong>is</strong>es at zero-effect markers and <strong>is</strong> powerful in localizingQTL. Estimating ep<strong>is</strong>tatic effects <strong>is</strong> also possible by such a unified analys<strong>is</strong> via hierarchicallikelihood.19
14 th QTL-MAS Workshop, Poznań University <strong>of</strong> Life Sciences, Poland 2010Association analyses <strong>of</strong> the QTL-MAS data set using grammar, principalcomponents and Bayesian network methodologiesBurak Karacaören ∗ , José M. Álvarez-Castro, Chr<strong>is</strong> S. Haley, Dirk Jan de Koning<strong>The</strong> Roslin Institute and R(D)SVS, University <strong>of</strong> Edinburgh, EH25 9PS, Roslin, UK∗ Presenting author: Burak Karacaören, email: burak.karacaoeren@roslin.ed.ac.ukBackground. In th<strong>is</strong> study we want to apply association analyses with machine learningmethods to the workshop data. It has been shown that if genetic relationships amongindividuals are not taken into account for genome wide association studies, th<strong>is</strong> may lead t<strong>of</strong>alse positives. To address th<strong>is</strong> problem, we used Genome-wide Rapid Association usingMixed Model and Regression (Aulchenko et al, 2007) and principal component stratificationanalyses (Price et al, 2006). It has been shown that using principal components loadingsobtained from top markers as covariate may be useful to choose most significant SNPs basedon correction for linkage d<strong>is</strong>equilibrium (Pant et al, 2010). Estimation <strong>of</strong> Bayesian networksmay also be useful to investigate linkage d<strong>is</strong>equilibrium among SNPs and relation withenvironmental variables.For the quantitative trait we first estimated residuals while taking polygenic effects intoaccount. We then used a single SNP approach to detect most significant SNPs and appliedprincipal component regression to take linkage d<strong>is</strong>equilibrium among SNPs into account. Forthe categorical trait we used principal component stratification methodology with first 10principal components. For correction <strong>of</strong> linkage d<strong>is</strong>equilibrium we used principal componentlogit regression. Bayesian networks were estimated to investigate relationship among SNPSs.Using the natural and orthogonal interactions model we estimated the effects <strong>of</strong> the detectedSNPs from previous approaches.Results. Using the Genome-wide Rapid Association using Mixed Model and Regression andprincipal component stratification approach we detected around 100 <strong>of</strong> significant SNPs forthe quantitative trait (p
14 th QTL-MAS Workshop, Poznań University <strong>of</strong> Life Sciences, Poland 2010Testing association <strong>of</strong> genotypes with d<strong>is</strong>crete and continuous traitsKacper Żukowski 1∗ , Anna Macierzyńska 1 , Heliodor Wierzbicki 11Department <strong>of</strong> Genetics and Animal Breeding, Wrocław University <strong>of</strong> Environmental and Life Sciences,Kożuchowska 7, 51-631 Wrocław, Poland∗ Presenting author: Kacper Żukowski, email: kacper.zukowski@up.wroc.plBackground . <strong>The</strong> aim <strong>of</strong> th<strong>is</strong> study was to predict breeding values <strong>of</strong> continuous and binarytrait and to investigate associations between genetic markers and both traits. Differentapproaches were used to investigate both traits – some <strong>of</strong> them considered each traitseparately and the other considered traits simultaneously.Methods. Three groups <strong>of</strong> models were used. First group, named BLUP, was used forinvestigating associations between SNPs and continuous and binary trait. SNP’s effects weretreated as random whereas mean and gender were treated as fixed effects. <strong>The</strong> second group<strong>of</strong> models, named gBLUP, was applied to predict genomic breeding values, which wereconsidered as random effects. <strong>The</strong> fixed effects were analogical as in the first group <strong>of</strong>models. In both a. m. groups, two models considered both traits simultaneously. <strong>The</strong>n onetrait was put as the fixed effect in the model for the second trait. <strong>The</strong> third group <strong>of</strong> models,named Foulley’s methods, considered both traits simultaneously. <strong>The</strong>n the fixed and therandom effects for both traits were estimated in the same time (Foulley et al., 1983). Foulley’smethods were used to predict breeding values and to estimate SNPs effects, which weretreated as random effects. Results received from Foulley’s method were compared withresults obtained using two first groups <strong>of</strong> models.Results and Conclusions. <strong>The</strong> correlation between EBV and GEBV for the quantitative traitwas 0.67 for animals with phenotype and for all animals. For the binary trait accuracy was0.78 for all animals and 0.84 for animals with phenotype. Results obtained suggest thatadditive effect <strong>of</strong> SNPs in genome were not the same for the quantitative and the binary trait.Foulley J.L., Gianola D., Thompson R. (1983) Prediction <strong>of</strong> genetic merit from data on binary and quantitativevariates with an application to calving difficulty, birth weight and pelvic opening. Genet. Sel. Evol., 15(3), 401– 42421
14 th QTL-MAS Workshop, Poznań University <strong>of</strong> Life Sciences, Poland 2010<strong>The</strong> genetic d<strong>is</strong>section <strong>of</strong> complex traits in model organ<strong>is</strong>msKarl W. Broman 1∗1Department <strong>of</strong> Biostat<strong>is</strong>tics and Medical Informatics, University <strong>of</strong> W<strong>is</strong>consin – Mad<strong>is</strong>on∗ Presenting author: Karl Broman, email: kbroman@biostat.w<strong>is</strong>c.eduBoth agricultural and biomedical researchers seek to d<strong>is</strong>sect the genetic architecture <strong>of</strong>complex phenotypes, but their goals are somewhat different. Consequently, the appropriateanalys<strong>is</strong> strategies have important differences. I will d<strong>is</strong>cuss some <strong>of</strong> these differences andwill further describe recent advances in complex trait analys<strong>is</strong> in model organ<strong>is</strong>ms.22
14 th QTL-MAS Workshop, Poznań University <strong>of</strong> Life Sciences, Poland 2010Integrating genetic markers with ~omics data using genetical genomics andmodern regression methodsAnimesh Acharjee 1,2, * , Bjorn Kloosterman 1 , Chr<strong>is</strong> Maliepaard 1,3 , Ric de Vos 4 , Chr<strong>is</strong>tianBachem 1,3 , Richard GF V<strong>is</strong>ser 1,31Wageningen UR Plant Breeding, Wageningen University and Research Center, POBox 386, 6700 AJ Wageningen, <strong>The</strong> Netherlands2 Graduate School Experimental Plant Sciences3 Center for BioSystems Genomics4 Plant Research International, P.O. Box 16, 6700 AA Wageningen, <strong>The</strong> Netherlands*Presenting author: Animesh Acharjee, email: animesh.acharjee@wur.nlUtilization <strong>of</strong> the natural genetic variation in traditional breeding programs remains a majorchallenge in crop plants. In the post genomics era, high throughput technologies give r<strong>is</strong>e todata collection in fields like transcriptomics, metabolomics and proteomics and as a result,large amounts <strong>of</strong> data have become <strong>available</strong>. We have screened a diploid potato populationfor gene-expression and obtained LC-MS data resulting in the identification <strong>of</strong> manyexpression and metabolite QTL’s across the genome. However, the integration <strong>of</strong> these datasets with phenotypic and marker data <strong>is</strong> still problematic. Here we present novel approachesto study the various ~omic datasets to allow the construction <strong>of</strong> networks integrating geneexpression, metabolites and markers. We used univariate regression and modern regressionmethods like lasso, elastic net and sparse partial least squares regression to select a subset <strong>of</strong>the metabolites and transcripts which show association with potato tuber flesh colour. <strong>The</strong>selected subset <strong>of</strong> metabolites and transcripts shows high significant (p value
14 th QTL-MAS Workshop, Poznań University <strong>of</strong> Life Sciences, Poland 2010Genome wide association study using single and multiple SNP analys<strong>is</strong>G.C.B. Schopen 1* , M.P.L. Calus 2 , M.H.P.M. V<strong>is</strong>ker 3 , J.A.M. van Arendonk 3 , H. Bovenhu<strong>is</strong> 31 Animal Breeding and Genomics Centre, Wageningen University and Research Centre, P.O. Box 338, 6700 AHWageningen, the Netherlands2 Animal Breeding and Genomics Centre, Wageningen UR Livestock Research, 8200 AB Lelystad, theNetherlands∗ Presenting author: Ghyslaine Schopen, email: Ghyslaine.Schopen@crv4all.comBackground. <strong>The</strong> objective <strong>of</strong> th<strong>is</strong> study was to compare the SNPs showing the mostsignificant effects, the location and the fraction <strong>of</strong> variance explained by these SNPs betweensingle SNP analys<strong>is</strong> and multiple SNP analys<strong>is</strong> in the Dutch Holstein-Friesian population. <strong>The</strong>compar<strong>is</strong>on was performed for the relative concentrations <strong>of</strong> the six major milk proteins. Intotal, 1713 cows with genotypes and phenotypes were <strong>available</strong>. In total, 45,999 SNPsd<strong>is</strong>tributed across 29 bovine autosomes were used in the single and multiple SNP analyses.Results. <strong>The</strong> same main four chromosomal regions on BTA5, 6, 11, and 14 were detected inthe single and multiple SNP analys<strong>is</strong>. <strong>The</strong> proportion <strong>of</strong> genetic variance explained by each <strong>of</strong>the SNPs in the single SNP analys<strong>is</strong> was higher compared to the SNP with the highestposterior probability in the multiple SNP analys<strong>is</strong>, except for β-casein. Summing up theproportion <strong>of</strong> genetic variance explained by adjacent SNPs next to the SNP with the highestposterior probability in the multiple SNP analys<strong>is</strong>, resulted in an increase <strong>of</strong> the geneticvariance explained similar to the SNP most significantly associated in the single SNPanalys<strong>is</strong>, except for β-casein. <strong>The</strong>re was one additional region on BTA7 detected in themultiple SNP analys<strong>is</strong>. <strong>The</strong> number <strong>of</strong> SNPs with effects <strong>is</strong> considerably lower in the multipleSNP analys<strong>is</strong> as compared to the single SNP analys<strong>is</strong>.Conclusions. Multiple SNP analys<strong>is</strong> result in higher power and in higher mapping prec<strong>is</strong>ionto detect QTL as compared to the single SNP analys<strong>is</strong>.24
14 th QTL-MAS Workshop, Poznań University <strong>of</strong> Life Sciences, Poland 2010Robustness and power <strong>of</strong> single-SNP analys<strong>is</strong> in related populationsS. Teyssèdre 1∗ , J-M. Elsen 1 and A. Ricard 21INRA, UR 631, 31326 Castanet-Tolosan, France2INRA, UMR 1313, 78352 Jouy-en-Josas, France∗ Presenting author: Simon Teyssedre, email: simon.teyssedre@toulouse.inra.frBackground. <strong>The</strong> availability <strong>of</strong> the SNP array in many species reinforced the idea <strong>of</strong> usinglinkage d<strong>is</strong>equilibrium (LD) for QTL detection. Quite <strong>of</strong>ten, LD methods for QTL detectionmade the hypothes<strong>is</strong> <strong>of</strong> unrelated animals and th<strong>is</strong> <strong>is</strong> not the case in most animal species. <strong>The</strong>aim <strong>of</strong> th<strong>is</strong> study was to formulate algebraically and evaluate in practical example theoreticalrobustness and power <strong>of</strong> some single-SNP test such as regression or GRAMMAR (Aulchenkoet al., 2007) when animals are related and/or when paternal half sib’s families are used.Results. <strong>The</strong> obtained formulae clearly demonstrate that Regression analys<strong>is</strong> gave a falsed<strong>is</strong>covery rate (FDR) which was higher when the heritability <strong>of</strong> the trait increased. Moreover,FDR also increased with the number <strong>of</strong> progeny per sire and the variability <strong>of</strong> relationships inthe sample : With a sample size <strong>of</strong> 600 and h²=0.5, FDR was 5% for unrelated population, 8%for random sample with relationships parameters <strong>of</strong> French Trotters and 9% (resp. 26%) for 5(resp. 60) progeny per sire. In spite <strong>of</strong> increase <strong>of</strong> FDR, the power decreased with increase <strong>of</strong>variability <strong>of</strong> relationships (12% less for a 0.20σ p SNP effect and 60 progeny per sire).GRAMMAR analys<strong>is</strong> gave lower FDR and power when relationships ex<strong>is</strong>ted: FDR was 2.5%at the nominal 5% and the decrease <strong>of</strong> power was 12% for 60 progeny per sire with a samplesize <strong>of</strong> 600 and h²=0.5. Moreover, the estimate <strong>of</strong> the SNP effect was strongly biaseddownwards when h² increased: bias was -58% with the above sample.Conclusions.Regression and Grammar were not robust against population structure,Regression analys<strong>is</strong> was very anticonservative, while Grammar was conservative. Moreover,results showed in both cases a loss <strong>of</strong> power when the heritability and population structureincreased. Th<strong>is</strong> study provides the theoretical formulas <strong>of</strong> type I and type II errors forRegression and Grammar analys<strong>is</strong>. <strong>The</strong>se formulas can be used for any trait and pedigree <strong>of</strong> aQTL detection specific protocol.Aulchenko,Y.S., de Koning, D-J and Haley, C. (2007) Genomewide rapid association using mixed model andregression: A fast and simple method for genomewide pedigree-based quantitative trait loci associationanalys<strong>is</strong>. Genetics.177:577-58525
14 th QTL-MAS Workshop, Poznań University <strong>of</strong> Life Sciences, Poland 2010Compar<strong>is</strong>on <strong>of</strong> an improved method for calculating line origin probabilitiesagainst GridQTL using simulated dataLucy Crooks 1* , Carl Nettelblad 2 , Sverker Holmgren 2 , Örjan Carlborg 31Department <strong>of</strong> Cell and Molecular Biology, Uppsala University, Sweden2Department <strong>of</strong> Information Technology, Uppsala University3Department <strong>of</strong> Animal Breeding and Genetics, Swed<strong>is</strong>h University <strong>of</strong> Agricultural Sciences∗ Presenting author: Lucy Crooks, email: Lucy Crooks@icm.uu-.seA fundamental step in QTL analys<strong>is</strong> <strong>of</strong> line crosses <strong>is</strong> estimating the probability thatchromosome regions originate from each <strong>of</strong> the founder lines. GridQTL (Seaton et al., 2006)<strong>is</strong> a popular tool for calculating these probabilities. However, the algorithm employed byGridQTL <strong>is</strong> computationally inefficient and not designed for the large numbers <strong>of</strong> markersthat are now being genotyped. We have presented an alternative method, cnF2freq (Nettelbladet al., 2009) that achieves far greater efficiency using a hidden Markov model approach. Here,we compare the performance <strong>of</strong> the two methods on a series <strong>of</strong> replicates from simulated data.<strong>The</strong> simulation <strong>is</strong> based on dense SNP genotypes from a chicken intercross; the aim being toaccurately reflect the patterns <strong>of</strong> marker informativeness that occur in real data. Eachreplication compr<strong>is</strong>ed one chromosome <strong>of</strong> about 1,500 SNPs in nearly 800 F 2 individualsderived from the same set <strong>of</strong> grandparents. <strong>The</strong> grandparent haplotypes were determined byapproximate haplotyping <strong>of</strong> the actual founders and the pedigree structure <strong>of</strong> the real data wasused. GridQTL states that it can analyse datasets containing up to around 1500 markers on achromosome. With our data, it was unable to analyse a complete set <strong>of</strong> 10 replicates, evenwhen the number <strong>of</strong> markers was reduced to 1,200. For 1,200 markers it was around 80 timesslower than cnF2freq. In the analyses that worked, GridQTL failed to estimate probabilitiesfor large sections <strong>of</strong> the chromosome, with about a third <strong>of</strong> individuals having m<strong>is</strong>sing valuesfor most <strong>of</strong> the genome. For the positions where line origin probabilities were estimated byGridQTL, the accuracy <strong>of</strong> the results from GridQTL and cnF2freq were compared. <strong>The</strong>performance <strong>of</strong> cnF2freq was also evaluated over a more extensive set <strong>of</strong> 1000 replicates. Ourresults provide a validation <strong>of</strong> cnF2freq, show that GridQTL <strong>is</strong> unable to deal with datasets <strong>of</strong>the size generated by SNP chips and demonstrate that cnF2freq can handle substantially largerdatasets than GridQTL.Nettelblad C., Holmgren, S., Crooks, L., Carlborg, Ö. Proc. 1 st BICoB (2009): 307-319.Seaton G., Hernandez J., Grunchec, J. A., White, I. et al. Proc. 8 th WCGALP (2006).26
14 th QTL-MAS Workshop, Poznań University <strong>of</strong> Life Sciences, Poland 2010Genome wide evaluation using dominanceRobin Wellmann 1∗ , Jörn Bennewitz 11 Universität Hohenheim, Institut für Tierhaltung und Tierzüchtung, D-70599 Stuttgart, Germany∗ Presenting author: Robin Wellmann, email: r.wellmann@uni-hohenheim.deBackground. <strong>The</strong> inclusion <strong>of</strong> dominance effects into models for the prediction <strong>of</strong> genomicbreeding values could increase the accuracy <strong>of</strong> the predictions and dominance effects could beused to choose mating pairs with good combining ability. <strong>The</strong> effects <strong>of</strong> different amounts <strong>of</strong>dominance variance and inbreeding depression on the accuracy <strong>of</strong> predicted breeding valuesand dominance values <strong>is</strong> studied by simulation in a bottlenecked population.<strong>The</strong> d<strong>is</strong>tribution <strong>of</strong> the QTL effects was heavy tailed. Simulated dominance degrees werenormally d<strong>is</strong>tributed and independent from the additive effects. Multiple regression was usedto predict the accuracy <strong>of</strong> breeding values and dominance values with the heritability, thedominance variance and the inbreeding depression as covariates.Results and Conclusions. Inbreeding depression decreased the accuracy <strong>of</strong> predicted breedingvalues but it could well be utilized to predict dominance values. <strong>The</strong> inclusion <strong>of</strong> dominanceincreased the accuracy <strong>of</strong> the breeding values.27
14 th QTL-MAS Workshop, Poznań University <strong>of</strong> Life Sciences, Poland 2010Genome wide effects <strong>of</strong> divergent selection for body weight in chickensAnna M. Johansson 1* , Mats E. Pettersson 1 , Paul B. Siegel 2 , Örjan Carlborg 11 Department <strong>of</strong> Animal Breeding and Genetics, Swed<strong>is</strong>h University <strong>of</strong> Agricultural Sciences, Box 7023, S-75007 Uppsala, Sweden2 Virginia Polytechnic Institute and State University, Department <strong>of</strong> Animal and Poultry Sciences, Blacksburg,VA 24061-0306, USA*Presenting author: Anna Johansson, email: Anna.Johansson@hgen.slu.seTo understand the genetic mechan<strong>is</strong>ms leading to phenotypic differentiation, it <strong>is</strong> important toidentify regions in a genome that are under selection. Here, we perform a genome wide scanusing a 60k SNP chip in two chicken lines from a single trait selection experiment, where 40generations <strong>of</strong> selection have resulted in a nine-fold difference in body weight. We analysedindividuals after 40 and 50 generations <strong>of</strong> selection in both the high body weight line and thelow body weight line. We show that the effect <strong>of</strong> selection <strong>is</strong> as dramatic on the genome as onthe phenotype. More than 60 regions were identified where selection has fixed alternativealleles in the two lines. Many more regions with highly significant large allele frequencydifferences were present all across the genome. Another 10 regions d<strong>is</strong>played strong evidencefor ongoing selection during the last 10 generations.28
14 th QTL-MAS Workshop, Poznań University <strong>of</strong> Life Sciences, Poland 2010Using genome scans <strong>of</strong> DNA polymorph<strong>is</strong>m to identify regions exhibitingpositive selectionS. Qanbari 1∗ , D. Gianola 2 , B. Hayes 3 , F. Schenkel 4 , S. Miller 4 , S. Moore 5 , G. Thaller 6 , H.Simianer 11Animal Breeding and Genetics Group, Department <strong>of</strong> Animal Sciences, Georg-August University, 37075Göttingen, Germany2Department <strong>of</strong> Animal Sciences and Department <strong>of</strong> Dairy Science, University <strong>of</strong> W<strong>is</strong>consin-Mad<strong>is</strong>on, Mad<strong>is</strong>on,W<strong>is</strong>consin 53706, USA3 Animal Genetics and Genomics, Primary Industries Research Victoria, 475 Mickleham Rd, Attwood, VIC3049, Australia.4Centre for Genetic Improvement <strong>of</strong> Livestock, Animal and Poultry Science Department, University <strong>of</strong> Guelph,Guelph, Ontario, N1G 2W1 Canada5Department <strong>of</strong> Agricultural, Food and Nutritional Science, University <strong>of</strong> Alberta, Edmonton, AB, Canada6Institute <strong>of</strong> Animal Breeding and Animal Husbandry, Chr<strong>is</strong>tian-Albrechts-University, 24098 Kiel, Germany∗ Presenting author: Saber Qanbari, email: sqanbar@gwdg.deIn th<strong>is</strong> study, two different and complementary methods were applied to identify traces <strong>of</strong>decades <strong>of</strong> intensive artificial selection for traits <strong>of</strong> economic importance in modern cattle.We scanned the genome <strong>of</strong> a diverse set <strong>of</strong> dairy and beef breeds from Germany, Canada andAustralia with a 50K SNP panel. In the first study we employed the integrated HaplotypeHomozygosity Score (|iHS|) for tracing on-going sweeps. Across breeds, a total <strong>of</strong> 109extreme |iHS| values exceeded the empirical threshold level <strong>of</strong> 5% with 19, 27, 9, 10 and 17outliers in Holstein, Brown Sw<strong>is</strong>s, Australian Angus, Hereford and Simmental, respectively.Annotating the regions harboring clustered |iHS| signals to the genome revealed significantenrichment for functional genes like SPATA17, MGAT1, PGRMC2 and ACTC1, COL23A1,MATN2, respectively, in the context <strong>of</strong> reproduction and muscle formation. In the secondanalys<strong>is</strong> a new Bayesian F ST -based approach was applied with a set <strong>of</strong> geographicallyseparated populations including Holstein, Brown Sw<strong>is</strong>s, Simmental, Canadian Angus andPiedemontese for detecting differentiated loci. <strong>The</strong> algorithm used <strong>is</strong> able to process a largebattery <strong>of</strong> marker information and allows inference based on the posterior d<strong>is</strong>tribution <strong>of</strong> F STvalues. In total, 127 regions exceeding the 2.5 per cent threshold <strong>of</strong> the empirical posteriord<strong>is</strong>tribution were identified as extremely differentiated. To a substantial proportion (56 out <strong>of</strong>127 cases) the extreme F ST values were found to be positioned in poor gene content regionswhich deviated significantly (p < 0.05) from the expectation assuming a random d<strong>is</strong>tribution.However, significant F ST values were found in some gene regions, like SMCP and FGF1. Aremarkable observation in th<strong>is</strong> study <strong>is</strong> a selection signal confirmed by both |iHS| and F STanalyses in the vicinity <strong>of</strong> Sialic acid binding Ig-like lectin 5 gene on BTA18 which recentlywas reported as a major QTL on productive life and fertility traits in Holstein cattle. Overall,based on the results <strong>of</strong> th<strong>is</strong> study we conclude that high-resolution genome scans are capableto identify outlier regions that potentially contain genes contributing to within and inter-breedphenotypic variation.29
14 th QTL-MAS Workshop, Poznań University <strong>of</strong> Life Sciences, Poland 2010Genome-wide scans for quantitative trait loci in experimental populations -<strong>is</strong>sues <strong>of</strong> multiple testing and model selectionMałgorzata Bogdan 1∗1 Institute <strong>of</strong> Mathematics and Computer Science, Wrocław University <strong>of</strong> Technology, Poland∗ Presenting author: Małgorzata Bogdan, email: Malgorzata.Bogdan@pwr.wroc.pl<strong>The</strong>re ex<strong>is</strong>t a variety <strong>of</strong> methods for locating multiple interacting quantitative trait inexperimental population. Most <strong>of</strong> these methods are based on linear models, relating traitvalues to the genotypes <strong>of</strong> potential QTL. <strong>The</strong> most difficult part in selecting the best linear <strong>is</strong>the estimation <strong>of</strong> the number <strong>of</strong> QTL. Th<strong>is</strong> task could in principle be addressed by theapplication <strong>of</strong> one <strong>of</strong> the model selection criteria, like e.g. AIC or BIC. However, as observedin [1], BIC (and so AIC) has a strong tendency to overestimate QTL number. In [2] and [3] it<strong>is</strong> explained that th<strong>is</strong> phenomenon <strong>is</strong> related to the well known <strong>is</strong>sue <strong>of</strong> multiple testing. Also,in the Bayesian context, the overestimation can be explained by the undesired properties <strong>of</strong>the uniform prior on the class <strong>of</strong> possible models, implicitly used by BIC. To address theproblem <strong>of</strong> overestimation, some modified versions <strong>of</strong> BIC have been proposed. Two <strong>of</strong> theseversions, modified BIC (mBIC,[4]) and extended BIC (EBIC,[5]), are based on the Bayesianprinciples. BIC <strong>is</strong> extended by using different prior d<strong>is</strong>tributions on the class <strong>of</strong> possiblemodels. As shown in a series <strong>of</strong> papers, the priors used in mBIC and EBIC allow to overcomethe problem <strong>of</strong> overestimation and both these criteria have very good properties as applied forQTL detection.In th<strong>is</strong> talk we will give a brief overview <strong>of</strong> the problems <strong>of</strong> high dimensional model selectionand their relationship to multiple testing. We will also present mBIC and EBIC and the results<strong>of</strong> their application to the problem <strong>of</strong> localizing QTL influencing the count data. If timepermits, we will also briefly d<strong>is</strong>cuss the application <strong>of</strong> model selection tools in the context <strong>of</strong>Genome Wide Association Studies in human populations.[1] Broman K, Speed T. A model selection approach for the identification <strong>of</strong> quantitative trait loci inexperimental crosses. J. Roy. Stat. Soc. B., 2002, 64: 641--656.[2] Bogdan M,Ghosh JK,Żak-Szatkowska M. Selecting explanatory variables with the modified version <strong>of</strong>the Bayesian Information Criterion. QREI, 2008, 24:627--641.[3] Bogdan M,Frommlet F, Biecek P, Cheng R, Ghosh JK,Doerge RW. Extending the Modified BayesianInformation Criterion (mBIC) to dense markers and multiple interval mapping. Biometrics, 2008, 64: 1162--1169.[4] Bogdan M, Ghosh JK, Doerge RW. Modifying the Schwarz Bayesian Information Criterion to LocateMultiple Interacting Quantitative Trait Loci. Genetics, 2004, 167: 989-999.[5] Chen J, Chen Z. Extended Bayesian Information criteria for model selection with large model spaces.Biometrika, 2008, 95: 759--771.30
14 th QTL-MAS Workshop, Poznań University <strong>of</strong> Life Sciences, Poland 2010Genotype imputation for the prediction <strong>of</strong> genomic breeding values in nongenotypedand low-density genotyped individualsMatthew A. Cleveland 1∗ , John M. Hickey 2, , Brian P. Kinghorn 21Genus/PIC, 100 Bluegrass Commons Blvd. Suite 2200, Hendersonville, TN 37075, USA2School <strong>of</strong> Environmental and Rural Science, University <strong>of</strong> New England, Armidale, NSW, 2351, Australia∗ Presenting author: Matthew Cleveland, email: matthew.cleveland@pic.comBackground. <strong>The</strong>re <strong>is</strong> wide interest in calculating genomic breeding values (GEBVs) inlivestock using dense, genome-wide SNP data. <strong>The</strong> general framework for genomic selectionassumes all individuals are genotyped at high-density, which may not be true in practice.Methods to add additional genotypes for individuals not genotyped at high density have thepotential to increase GEBV accuracy with little or no additional cost. In th<strong>is</strong> study a longhaplotype library was created using a long range phasing algorithm and used in combinationwith segregation analys<strong>is</strong> to impute dense genotypes for non-genotyped dams in the trainingdataset (S1) and for non-genotyped or low-density genotyped individuals in the predictiondataset (S2). Alternative low-density scenarios were evaluated for accuracy <strong>of</strong> imputedgenotypes and prediction <strong>of</strong> GEBVs.Results. In S1, females in the training population were not genotyped and predictionindividuals were either not genotyped or genotyped at low-density (evenly spaced at 2, 5 or10cM). <strong>The</strong> accuracy <strong>of</strong> imputed genotypes for training females did not change with theaddition <strong>of</strong> genotypes in the prediction set, as expected, whereas the number <strong>of</strong> correctlyimputed genotypes in the prediction set increased slightly. S2 assumed the complete trainingset was genotyped for all SNPs and the prediction set was not genotyped or genotyped at lowdensity.<strong>The</strong> number <strong>of</strong> correctly imputed genotypes increased with genotyping density in theprediction set. Genomic breeding values for the prediction set in each scenario werecorrelated with predicted GEBVs when all animals were genotyped for all SNPs to evaluatethe potential loss in accuracy with reduced genotyping. For both S1 and S2 the correlationswith the high-density GEBVs were similar when the prediction set was not genotyped andincreased with the addition <strong>of</strong> low-density genotypes, where the increase was larger for S2than S1.Conclusions. Genotype imputation using a long haplotype library and segregation analys<strong>is</strong>has prom<strong>is</strong>e for application in sparsely-genotyped pedigrees. <strong>The</strong> results <strong>of</strong> th<strong>is</strong> study suggestthat dense genotypes can be imputed for selection candidates with some loss in GEBVaccuracy compared to the high-density case, but genotyping strategies for the training set maybe needed to maintain accuracy when using low-density SNP panels for genomic selection.31
14 th QTL-MAS Workshop, Poznań University <strong>of</strong> Life Sciences, Poland 2010A compar<strong>is</strong>on <strong>of</strong> random forests, boosting and support vector machines forgenomic selection with SNP markersJoseph O. Ogutu 1∗ , Hans-Peter Piepho, Torben Schulz-Streeck 11Bioinformatics Unit, Institute for Crop Science, University <strong>of</strong> Hohenheim, Fruwirthstrasse 23, 70599 Stuttgart,Germany∗ Presenting author: Joseph Ogutu, email: jogutu2007@gmail.comBackground. Genomic selection (GS) <strong>is</strong> a method for estimating breeding values usingmolecular markers spanning the entire genome. It involves jointly estimating the effects <strong>of</strong> allgenes or chromosomal segments and combining the estimates to predict the total genomicbreeding value (GBV). Accurate prediction <strong>of</strong> GBVs thus represents a central challenge tocontemporary plant and animal breeders. However, the ex<strong>is</strong>tence <strong>of</strong> a wide array <strong>of</strong>approaches for predicting breeding values using markers makes it essential to evaluate andcompare their relative predictive performances to identify approaches able to accuratelypredict breeding values. Here, we compare the predictive performances <strong>of</strong> three key machinelearning methods, namely random forests; boosting and support vector machines, forpredicting GBV using SNP-marker data. We also explore the utility <strong>of</strong> random forests forimportance ranking <strong>of</strong> markers prior to mapping their chromosomal positions.Methods. We predicted GBV for one quantitative trait in a simulated data set <strong>of</strong> 3226individuals spanning five generations and an associated genome encompassing fivechromosomes with 10031 biallelic SNP-marker loci generated for the 14 th QTL-MASworkshop. Of the 3226 individuals 2326 in the first four generations were phenotyped andgenotyped and were used to train the random forest, boosting and support vector machineregression models. <strong>The</strong> models were used to predict GBV for the remaining 900 individuals inthe fifth generation without phenotypic records. A 5-fold cross-validation was used toevaluate the predictive performance <strong>of</strong> each method. Predictive accuracy was measured bymean squared error and the correlation between GBV and the simulated values. Randomforest was used to rank the importance <strong>of</strong> markers and positions <strong>of</strong> the most importantmarkers mapped on the pertinent chromosomes.Results. <strong>The</strong> correlation between the predicted and simulated breeding values for the 5-foldcross validation for random forests was modest and ranged from 0.393 to 0.5878 and themean squared error from 65.47 to 70.71. For support vector machines the mean squared errorfor the 5-fold cross-validation ranged from 196.4599 to 236.4377.Conclusions. <strong>The</strong> support vector machine predicted GBV better than random forests andboosting but our evaluation <strong>of</strong> the performance <strong>of</strong> boosting <strong>is</strong> still ongoing.32
14 th QTL-MAS Workshop, Poznań University <strong>of</strong> Life Sciences, Poland 2010Genomic selection using Best Linear Unbiased Prediction with a traitspecific relationship matrixZhe Zhang 1,2∗ , Xiangdong Ding 1 , Jianfeng Liu 1 , Dirk-Jan de Koning 2 , Qin Zhang 11 Key Laboratory <strong>of</strong> Animal Genetics and Breeding <strong>of</strong> the Min<strong>is</strong>try <strong>of</strong> Agriculture, College <strong>of</strong> Animal Scienceand Technology, China Agricultural University, Beijing, 100193, China2<strong>The</strong> Roslin Institute and Royal (Dick) School <strong>of</strong> Veterinary Studies, University <strong>of</strong> Edinburgh, Roslin, EH259PS, UK∗ Presenting author: Zhe Zhang, email: zhangzhecau@126.comBackground. Using the common dataset publ<strong>is</strong>hed from the XIV QTL-MAS workshop, threemethods for estimating genomic breeding values (GEBVs) <strong>of</strong> a quantitative trait werecompared: best linear unbiased prediction with a trait specific relationship matrix (TA-BLUP), ridge regression best linear unbiased prediction (RR-BLUP), and BayesB.Methods. TA-BLUP <strong>is</strong> a method that <strong>is</strong> identical to the conventional BLUP method exceptthat the numeric relationship matrix <strong>is</strong> replaced with a trait specific relationship matrix (TA).<strong>The</strong> TA matrix <strong>is</strong> constructed based on both marker genotypes and their estimated effects onthe trait <strong>of</strong> interest. <strong>The</strong> marker effects were estimated in a reference population cons<strong>is</strong>ting <strong>of</strong>2,326 individuals using RR-BLUP and BayesB and the GEBVs <strong>of</strong> individuals <strong>of</strong> the referencepopulation as well as 900 young genotyped individuals were estimated using the threemethods. Subsets <strong>of</strong> markers were selected to perform low-density marker genomic selectionfor TA-BLUP method.Results. <strong>The</strong> correlations between GEBVs from different methods are over 0.95 in mostcases. <strong>The</strong> correlation between BayesB and TA-BLUP using 200 selected markers toconstruct the TA matrix <strong>is</strong> 0.98 in the candidate population.Conclusions. TA-BLUP provides the possibility to use low-density markers for estimatingGEBVs in candidate populations. Using only a small proportion <strong>of</strong> the total markers, selectedon the bas<strong>is</strong> <strong>of</strong> their estimated effects, TA-BLUP gives GEBVs that are almost equivalent tothat from RR-BLUP or BayesB. TA-BLUP <strong>is</strong> therefore a prom<strong>is</strong>ing method for genomicselection in the candidate populations because <strong>of</strong> the remarkably reduced cost for genotyping,even though there might be a little loss <strong>of</strong> accuracy.33
14 th QTL-MAS Workshop, Poznań University <strong>of</strong> Life Sciences, Poland 2010Applying different genomic selection approaches on QTL-MAS 2010 dataJavad Nadaf 1∗ , Ricardo Pong-Wong 11<strong>The</strong> Roslin Institute and R(D)SVS, University <strong>of</strong> Edinburgh, Roslin, Midlothian, EH25 9PS, UK∗ Presenting author: Javad Nadaf, email: javad.nadaf@roslin.ed.ac.ukBackground. Four different genomic evaluation methods were applied on the QTL-MAS 14thdataset which includes 3226 individuals across 4 generations, all genotyped for 10031 SNPson 5 chromosomes. <strong>The</strong> genomic selection analyses included two Bayes B type <strong>of</strong> methods(BB): using only SNP information (GBB) or SNP and Pedigree information (GPBB); and twoGBLUP and GPBLUP. When using BB methodology, the probability <strong>of</strong> SNP having aneffect on the traits (which include a quantitative and a binary trait) was also estimated.Supplementary analyses were also done, including association analys<strong>is</strong> and QTL mapping, tohave a better interpretation <strong>of</strong> the results.Results. <strong>The</strong> polygenic heritability <strong>of</strong> the traits was estimated at 0.55 and 0.42, for thequantitative and the binary trait respectively. <strong>The</strong> correlation <strong>of</strong> EBVs between the two traits(a good estimation <strong>of</strong> genetic correlation) was estimated at 0.58. A good cons<strong>is</strong>tency wasobtained between different methods in the estimation <strong>of</strong> EBVs: the correlation between EBVs<strong>of</strong> 900 juveniles (the 4th generation), estimated by different approaches were at least 0.90, forthe two traits; when considering all individuals, th<strong>is</strong> number was as high as 0.94. <strong>The</strong>correlation was less affected by adding polygenic effect in the model than changing themethodology (BB vs. GBLUP); however, adding polygenic effect was still important, at leastfor the quantitative trait. <strong>The</strong> percentage <strong>of</strong> SNPs with an effect on the traits was estimated atabout 5 and 10% for the quantitative and binary trait respectively, using the GBB method. <strong>The</strong>results <strong>of</strong> BB analyses were cons<strong>is</strong>tent with association and QTL mapping analyses: <strong>The</strong>SNPs with the most important effects were common and positioned on chromosome 1 and 3.<strong>The</strong>re was also good cons<strong>is</strong>tency regarding the SNPs with moderate effects.Conclusions. An important part <strong>of</strong> additive genetic effects, estimated for both traits, could becaptured by genomic information. Using th<strong>is</strong> source <strong>of</strong> information, the results obtained bythe 4 different approaches were quite cons<strong>is</strong>tent. Good cons<strong>is</strong>tency was also observedbetween genomic selection (BB) and association and QTL mapping analyses, concerning theeffect <strong>of</strong> SNPs on traits.34
14 th QTL-MAS Workshop, Poznań University <strong>of</strong> Life Sciences, Poland 2010Pre-selection <strong>of</strong> markers for genome-wide selectionTorben Schulz-Streeck 1∗ , Joseph O Ogutu 1 , Hans-Peter Piepho 11 Bioinformatics Unit, Institute <strong>of</strong> Crop Science, University <strong>of</strong> Hohenheim, Fruwirthstrasse 23, 70599 Stuttgart,Germany∗ Presenting author: Torben Schulz-Streeck, email: torben.schulz-streeck@uni-hohenheim.deBackground. Accurate prediction <strong>of</strong> genomic breeding values (GEBVs) requires numerousmarkers. However, prediction accuracy can be enhanced by excluding markers with no effectsor markers with incons<strong>is</strong>tent effects among crosses that can adversely affect the prediction <strong>of</strong>GEBVs.Methods. We present three different approaches for pre-selecting markers prior to predictingGEBVs and assess the extent to which pre-selection <strong>of</strong> markers improves prediction accuracy.1. Testing each SNP using a linear regression model similar to Macciotta et al. (2009)2. Analyzing each SNP for cons<strong>is</strong>tency among crosses using mixed models3. Analyzing each SNP for cons<strong>is</strong>tency among generations using mixed modelsWe predicted GEBVs for the single quantitative trait in the common dataset provided for the14 th QTL-MAS workshop using four different BLUP methods, including ridge regression andthree geostat<strong>is</strong>tical models. Performances <strong>of</strong> the models were evaluated using four differentmodel selection criteria plus 5-fold cross-validation.Results and conclusions. Ridge regression and the geostat<strong>is</strong>tical models gave almost similarfits. Pre-selecting markers was evidently beneficial since excluding markers with incons<strong>is</strong>tenteffects among crosses increased the correlation between GEBVs and observed values invalidation datasets from 0.530 (using all markers) to 0.584 (using pre-selected markers).However, extension <strong>of</strong> the ridge regression model to allow for heterogeneous variancesbetween the n (n =5, 10, 50, 100, 250) most significant markers and the remaining markersonly marginally increased the accuracy <strong>of</strong> prediction (from 0.584 to 0.587).Results produced using models selected by AIC and GCV were nearly cons<strong>is</strong>tent with thosefor models selected by the 5-fold cross-validation, implying that model selection criteria suchas AIC and GCV may be used instead <strong>of</strong> cross-validation to reduce computing time.We submit results from the following two final models:1. Linear spatial model with the 1000 most significant markers selected by method 22. Ridge regression with the 1000 most significant marker selected by method 2 andheterogeneous variance between the 50 most significant markers and the remainingmarkersMacciotta NPP, Gaspa G, Steri R, Pieramati C, Carnier P, Dimauro C: Pre-selection <strong>of</strong> most significant SNPSfor the estimation <strong>of</strong> genomic breeding values. BMC Proc 2009, 3(Suppl 1):S1435
14 th QTL-MAS Workshop, Poznań University <strong>of</strong> Life Sciences, Poland 2010Methods for genome-wide association analyses <strong>of</strong> quantitative traitloci in human genetically <strong>is</strong>olated populationsYurii Aulchenko 1∗1 Department <strong>of</strong> Epidemiology, Rotterdam, <strong>The</strong> Netherlands∗Presenting author: Yurii Aulchenko, email: i.aoultchenko@erasmusmc.nlHumans are one <strong>of</strong> the worst genetic model objects in the sense <strong>of</strong> possible applicableexperimentation techniques, maintainability and generation time. On the other hand, there <strong>is</strong> ahuge interest in studying the determinants <strong>of</strong> the health and d<strong>is</strong>ease <strong>of</strong> humans, leading tolarge investments and possibilities to apply top technology to challenge the questions abouthumans.In th<strong>is</strong> talk, I will d<strong>is</strong>cuss the problem <strong>of</strong> identification <strong>of</strong> genomic loci whose variation <strong>is</strong>responsible for the variance in complex traits in human populations. In particular, I will givean overview <strong>of</strong> methodology, implementation <strong>of</strong> different variants <strong>of</strong> linear mixed models(FASTA, GRAMMAR, etc.). <strong>The</strong> uses and limitations <strong>of</strong> th<strong>is</strong> approach will be outlined, andpractical examples provide.Implications <strong>of</strong> previous knowledge to new generation <strong>of</strong> molecular data (e.g. HT resequencing,-'omics'), general uses <strong>of</strong> linear mixed models, and d<strong>is</strong>cussion <strong>of</strong> what are theways to go further with the genetics <strong>of</strong> complex (human) traits will conclude the talk.36
14 th QTL-MAS Workshop, Poznań University <strong>of</strong> Life Sciences, Poland 2010A new R package for QTL analys<strong>is</strong>Ronald Nelson 1∗ , José Álvarez-Castro 1 , Lucy Crooks 2 , Franco<strong>is</strong> Besnier 1 , Carl Nettelblad 3 ,Lars Rönnegård 1 , Xia Shen 2 , Örjan Carlborg 11Department <strong>of</strong> Animal Breeding and Genetics, Swed<strong>is</strong>h University <strong>of</strong> Agricultural Sciences, Sweden2Department <strong>of</strong> Cell and Molecular Biology, Uppsala University, Sweden3Department <strong>of</strong> Information Technology, Uppsala University, Sweden∗ Presenting author: Ronald Nelson, email: ronnie.nelson@hgen.slu.se<strong>The</strong> availability <strong>of</strong> high-throughput methods for molecular characterization <strong>of</strong> individualsmeans that many individuals can be typed for thousands <strong>of</strong> markers. It <strong>is</strong> therefore necessaryto develop new algorithms to handle these large datasets when analyzing complex traits. Weare developing a computationally efficient, easy to use, well-documented, freely <strong>available</strong> andflexible s<strong>of</strong>tware package for the analys<strong>is</strong> and mapping <strong>of</strong> complex traits in inbred andoutbred line-crosses. <strong>The</strong> package will be developed with a front-end in the R-language.Several modules have already been developed and tested. <strong>The</strong>se include: cnF2freq forcalculating genotype probabilities from line-crosses (including outbred lines) typed forthousands <strong>of</strong> markers; FIA for variance component based mapping <strong>of</strong> QTL includingep<strong>is</strong>tas<strong>is</strong>; MCIBD, for determining identity by descent from pedigree data; and NOIA, formodeling ep<strong>is</strong>tas<strong>is</strong>. We also have modules to analyze and haplotype individuals from deeppedigrees as well as optimized user-friendly algorithms implemented in the R-language forregression based analys<strong>is</strong>. <strong>The</strong> s<strong>of</strong>tware will enhance QTL analys<strong>is</strong> by allowing the inclusion<strong>of</strong> substantially more markers than current s<strong>of</strong>tware can handle, increasing the accuracy <strong>of</strong>mapping single and interacting QTL by including variance component analys<strong>is</strong> and extractingadditional information from deep pedigree crosses, if <strong>available</strong>. Th<strong>is</strong> package will be animportant resource for utilizing current, and future, data within the framework <strong>of</strong> geneticanalys<strong>is</strong> <strong>of</strong> complex traits.37
14 th QTL-MAS Workshop, Poznań University <strong>of</strong> Life Sciences, Poland 2010<strong>The</strong> estimation <strong>of</strong> SNP effects on a binary and a quantitative traitKacper Żukowski 1,∗ , Joanna Szyda 1,21Department <strong>of</strong> Genetics and Animal Breeding, Wrocław University <strong>of</strong> Environmental and Life Sciences,Kożuchowska 7, 51-631 Wrocław, Poland2Institute <strong>of</strong> Natural Sciences, Wrocław University <strong>of</strong> Environmental and Life Sciences, Norwida 25, 50-375Wrocław, Poland∗ Presenting author: Kacper Żukowski, email: kacper.zukowski@up.wroc.plBackground . <strong>The</strong> analys<strong>is</strong> concerns on estimating the effects <strong>of</strong> Single NucleotidePolymorph<strong>is</strong>ms (SNP) on a binary and a quantitative trait, based on the simulated QTL-MASworkshop data. Moreover, the association between the two traits <strong>is</strong> considered.Methods. For a quantitative trait a gBLUP model was appliedy = µ + Za + ε , where: y <strong>is</strong>a quantitative trait, Z <strong>is</strong> an incidence matrix for SNP effects, a <strong>is</strong> a vector <strong>of</strong> random SNPeffects assuminga2⎛ σ⎟ ⎞N⎜0,I with n representing the number <strong>of</strong> SNPs, ε <strong>is</strong> a vector <strong>of</strong>⎝ n ⎠~α2random errors assuming e N( 0, Iσ )~ε. Th<strong>is</strong> model was applied for all animals, for affectedanimals only, and for unaffected animals only. Further on, a modification <strong>of</strong> the gBLUPmodel with SNP effects estimated separately for affected and unaffected animals (CgBLUP)was used: y = µ + Za unaff+ Zaaff+ ε , where aunaffand aaffare random vectors for unaffectedand affected animal respectively, both effects were assumed to be uncorrelated. For a binarytrait a log<strong>is</strong>tic regression model (LOGIT) was used:probability <strong>of</strong> being affected, β0<strong>is</strong> an intercept andwith a corresponding column in incidence matrix⎛ p ⎞log ⎜ ⎟ = β0+ β⎝1−p ⎠Z i i, where p <strong>is</strong> aβirepresents an additive effect <strong>of</strong> SNP iResults. <strong>The</strong> most significant SNPs for both traits were found on chromosome 1 andchromosome 3. Two most significant SNPs influencing both, a binary and a quantitative trait:#4480 (22 030 629 bp) and #4491 (22 520 568 bp) were located on chromosome 3.Generally, similar locations were significant for both traits, but no significant SNPs effectswere reported by CgBLUP model.Conclusions. <strong>The</strong> analys<strong>is</strong> showed many significant SNPs, one gene located on 22,0-22,5 Mbon chromosome 3 could have influence on a quantitative and a binary trait simultaneously.Zi.38
14 th QTL-MAS Workshop, Poznań University <strong>of</strong> Life Sciences, Poland 2010Logic regression based methods in application to detection <strong>of</strong> gene-geneinteractionsMagdalena Malina 1* , Małgorzata Bogdan 21 Mathematical Institute, University <strong>of</strong> Wrocław2 Institute <strong>of</strong> Mathematics and Computer Science, Wrocław University <strong>of</strong> Technology,∗ Presenting author: Magdalena Malina, email: malina@math.uni.wroc.plBackground. We consider a biological problem <strong>of</strong> locating multiple interacting QTLs. Logicregression introduced in [2] by Ruczinski, Kooperberg, LeBlanc <strong>is</strong> a regression method,specifically aimed at detecting high order interactions in SNP data. <strong>The</strong> method attempts toconstruct predictors as Boolean combinations <strong>of</strong> dummy variables coding marker genotypes.<strong>The</strong> method searches for these combinations <strong>of</strong> predictors in the entire space <strong>of</strong> suchcombinations, which are represented by logic binary trees. In [1] Schwender and Ickstadtpropose a procedure called logicFS (logic feature selection) in which the “best” model <strong>of</strong> afixed dimension <strong>is</strong> estimated with simulated annealing, aimed at maximizing the likelihood.<strong>The</strong> instability <strong>of</strong> binary trees <strong>is</strong> overcome by using bootstrap aggregation. Based on bootstrapreplications, for each interaction an importance measure <strong>is</strong> calculated. <strong>The</strong> method can beapplied for both binary and quantitative responses.Results. We applied LogicFS for QTL mapping. We analyzed two real QTL data sets (see[3], [4]). <strong>The</strong> data by Lyons et.al ([3]) contains different phenotypes related to cholesterolgallstone formation detected in an intercross <strong>of</strong> CAST/Ei and 129S1/SvImJ inbred mice. Wesearched for interactions that influence gallbladder bile character<strong>is</strong>tics (binary variable). <strong>The</strong>second data set ([4]) considers different phenotypes related to obesity detected in an intercross<strong>of</strong> SM/J and NZB/BINJ inbred mice. Here we searched for interactions that influence gonadalfat pads weight. For both data sets logicFS was able to detect several interactions which werenot reported in original papers.Conclusions. Logic regression models allow to present very complex linear models withmany parameters in a much simpler form. Increasing number <strong>of</strong> components that may beincluded to models <strong>of</strong> th<strong>is</strong> form causes also that the problem <strong>of</strong> multiple testing become morecomplex. In such models however it <strong>is</strong> easier to get to the higher order interactions withoutaddition <strong>of</strong> new parameters. Interactions included in such model are also much easier tointerpret. According to our results, logicFS can be successfully applied to identification <strong>of</strong>interacting QTLs.[1]Schwender, H. and Ickstadt, K. (2008). Biostat<strong>is</strong>tics, 9. 187-198[2] Ruczinski I., Kooperberg C., LeBlanc M. (2003). J. Comput. Graphical Stat<strong>is</strong>t. 12 (3) 474-511[3] Lyons MA, Wittenburg H, Li R, Walsh KA, Leonard MR, Churchill GA, Carey MC, Paigen B. Physiol Genomics. 2003Aug 15;14(3):225-39. PMID 12837957[4] Stylianou IM, Korstanje R, Li R, Sheehan S, Paigen B, Churchill GA. Mamm Genome. 2006 Jan;17(1):22-36. PMID1641608839
14 th QTL-MAS Workshop, Poznań University <strong>of</strong> Life Sciences, Poland 2010Genetic architecture <strong>of</strong> yield and related traits in European maize: insightsinto the effects <strong>of</strong> linkage and allelic series. Consequences for markerass<strong>is</strong>ted selectionA. Charcosset 1∗ , G . Blanc 1 , Y.-F. Huan 1 , A. Galla<strong>is</strong> 1 , L. Moreau 11 INRA-CNRS-UPS-AgroPar<strong>is</strong>Tech Station de Génétique Végétale, Ferme du Moulon, 91190 Gif sur Yvette,France∗ Presenting author: Alain Charcosset, email: charcos@moulon.inra.frBackground. QTL mapping experiments conducted so far in plants generally consideredpopulations derived from the cross between two inbred lines. <strong>The</strong>y have proven efficient todetect QTL involved in trait variation. However, due to a limited number <strong>of</strong> effectiverecombination generations, they provide a poor resolution, with QTL confidence intervals<strong>of</strong>ten exceeding 20 cM for QTL <strong>of</strong> small effect and usual population sizes (between 100 or200 individuals). <strong>The</strong>y also address only a limited fraction <strong>of</strong> the genetic variability <strong>available</strong>in a breeding program. Alternative QTL experimental designs such as advanced intermatedpopulations or multiparental populations, have been proposed to overcome these drawbacks.Results. To evaluate the first strategy, we conducted a QTL detection experiment in (i) anadvanced intermated F 3 population <strong>of</strong> 322 lines and (ii) a conventional F 3 population <strong>of</strong> 300lines. Both were derived from the same parental maize inbred lines, with four additionalgenerations <strong>of</strong> intermating for (i), and jointly evaluated in testcross progeny for dry grainyield and related traits. QTL confidence intervals were on average 2.31 shorter in theintermated population than in the conventional population. However, fewer QTLs weredetected in the intermated population and less than 50% <strong>of</strong> the detected QTLs were commonto the two populations. Cross-validation showed that selection bias was more important in theintermated population. Results suggest that the a substantial fraction <strong>of</strong> the QTLs detected forGrain mo<strong>is</strong>ture at harvest and Grain Yield in the conventional population were actually due tocoupling phase between small effect QTL. Regarding the second strategy, we conducted aQTL detection experiment in six F2 populations (150 individuals each) derived from a halfdiallelbetween four European maize inbred lines. <strong>The</strong> joint analys<strong>is</strong> <strong>of</strong> the whole designincreased the power <strong>of</strong> QTL detection and its resolution. It revealed stronger ep<strong>is</strong>tatic effectsfor yield than for other traits. It also revealed allelic series with gradual effects for most QTLand allowed us to identify the parental origin <strong>of</strong> the most favorable alleles. Th<strong>is</strong> informationwas used to conduct rapid cycles <strong>of</strong> selection based only on marker evaluation. Phenotypicevaluation <strong>of</strong> plants selected at each generation showed a significant genetic gain throughcycles <strong>of</strong> selection. Interest <strong>of</strong> applying marker ass<strong>is</strong>ted selection to such multiparentaldesigns was further supported by simulations.Conclusions. <strong>The</strong>se results illustrate that yield related traits in maize have a complex geneticarchitecture, involving several tens <strong>of</strong> loci, linkage situations affecting apparent QTL effectsand possibly genetic variance, and allelic series with gradual effects. <strong>The</strong>y also show thatstrategies, such as genomic selection, addressing a broad diversity and using present highthroughputgenotyping technologies should prove highly beneficial to accelerate genetic gainfor such traits.40
14 th QTL-MAS Workshop, Poznań University <strong>of</strong> Life Sciences, Poland 2010Mapping systemic scleroderma genes in a cross between UCD200 andjungle fowl chickensWeronica Ek 1* , Anna-Stina Sahlqv<strong>is</strong>t 2 , Roswitha Sgonc 3 , Hermann Dietrich 3 , Georg Wick 3 ,Olov Ekvall 4 , Leif Andersson 1,5 , Örjan Carlborg 1 , Olle Kämpe 2 , Susanne Kerje 51 Department <strong>of</strong> Animal Breeding and Genetics, Swed<strong>is</strong>h University <strong>of</strong> Agricultural Sciences, Uppsala, Sweden.2 Department <strong>of</strong> Medical Sciences, Uppsala University Hospital, Uppsala, Sweden3 Div<strong>is</strong>ion <strong>of</strong> Experimental Pathophysiology and Immunology, Biocenter, Innsbruck Medical University,Innsbruck, Austria.4 Department <strong>of</strong> Rheumatology och Inflammation Research, <strong>The</strong> Sahlgrenska Academy, Gothenburg, Sweden5 Department <strong>of</strong> Medical Biochem<strong>is</strong>try and Microbiology, Uppsala University, Uppsala, Sweden.*Presenting author: Weronica Ek, email: weronica.ek@hgen.slu.seBackground. Systemic Scleroderma (SSc) <strong>is</strong> a rare autoimmune d<strong>is</strong>ease characterized byfibros<strong>is</strong> <strong>of</strong> skin and internal organs, such as gastrointestinal tract, lungs kidneys and heart.Scleroderma <strong>is</strong> a complex d<strong>is</strong>ease and evidence suggests that genetic factors may be involvedand that immune-regulation plays a major role. University <strong>of</strong> California at Dav<strong>is</strong> (UCD) line200 chickens develops a heritable systemic scleroderma, similar to the one in humans, and <strong>is</strong>therefore important as an animal model for the study <strong>of</strong> human scleroderma.Method. We have generated a backcross between UCD200 and the red jungle fowl (control)chickens and performed a genome-wide QTL scan to identify loci underlying the d<strong>is</strong>ease.Two approaches were used to analyze the data. Generalized linear regression on line-originQTL genotype probabilities calculated using cnF2freq (Nettelblad et al, 2009) and FlexibelIntercross Analys<strong>is</strong> (FIA), a variance component model that allows for variation within lines(Rönnegård et al, 2007). Scleroderma was scored as a binary trait, affected or not.Results. <strong>The</strong> analys<strong>is</strong> confirmed one significant QTL on chromosome 14 (OR 2.7, p Genome-wide< 0.05) and one suggestive QTL on chromosome 2 (OR 2.8, p Genome-wide = 0.06). Birdsphenotyped for early comb necros<strong>is</strong>, scored at 3-weeks <strong>of</strong> age, showed a significant peak onchromosome 12 (OR 2.9, p Genome-wide < 0.05). Scleroderma was more frequent in males (94%affected) then in females (25% affected) at 175 days <strong>of</strong> age.C. Nettelblad, S. Holmgren, L. Crooks, O. Carlborg (2009) cnF2freq: Efficient Determination <strong>of</strong> Genotype andHaplotype Probabilities in Outbred Populations using Markov Models. Proceedings to BICoB 2009, NewOrleans, LNBI 5462, pp. 307-319, Springer Verlag BerlinRönnegård, L., Besnier, F., Carlborg, Ö. 2007. An improved method for quantitative trait loci detection andidentification <strong>of</strong> within-line segregation in F2 intercross designs. Genetics 178: 2315-2326.41
14 th QTL-MAS Workshop, Poznań University <strong>of</strong> Life Sciences, Poland 2010Genomic selection in Pol<strong>is</strong>h HolsteinJoanna Szyda 1∗ , Andrzej Żarnecki 2 , Stan<strong>is</strong>ław Kamiński 31 Department <strong>of</strong> Animal Genetics, Institute <strong>of</strong> Natural Sciences, Wrocław University <strong>of</strong> Life and EnvironmentalSciences, Wrocław, Poland2 National Research Institute for Animal Production, Balice, Poland3 Department <strong>of</strong> Animal Genetics, University <strong>of</strong> Warmia and Mazury, Olsztyn, Poland∗ Presenting author: Joanna Szyda, email: joanna.szyda@up.wroc.plBackground. Recently many countries incorporated the genomic information, in the form <strong>of</strong>thousands <strong>of</strong> Single Nucleotide Polymorph<strong>is</strong>ms (SNP) genotypes originating from amicroarray technology, into their genetic evaluation systems. We describe the results <strong>of</strong> fittinga genomic evaluation model to the Pol<strong>is</strong>h population <strong>of</strong> Holstein Friesian cattle, as well as thefuture activities related to genomic selection in th<strong>is</strong> breed.<strong>The</strong> data set, used as a training data set for the estimation <strong>of</strong> additive effects <strong>of</strong> SNPs in thegenomic evaluation model, cons<strong>is</strong>ted <strong>of</strong> 1,227 Pol<strong>is</strong>h Holstein-Friesian bulls, born between1987 and 2003. Genotypes were generated by the use <strong>of</strong> the Illumina BovineSNP50Genotyping BeadChip, which cons<strong>is</strong>ts <strong>of</strong> 54,001 SNPs. For the estimation <strong>of</strong> Direct GenomicValues (DGV) 46,267 SNPs were selected based on the minor allele frequency and call rate,giving 56,502,470 bull-SNP genotypes in total for milk yield. Direct genomic values (DGV)were calculated for 28, compr<strong>is</strong>ing three production traits: milk-, fat- and protein- 305-dayyields, somatic cell score, three fertility traits, and 21 traits describing conformation. For th<strong>is</strong>purpose a mixed linear model with a random effect <strong>of</strong> additive SNP effect was applied toderegressed national pro<strong>of</strong>s (EBV) based on daughter production data <strong>available</strong> in 2009.Results. For bulls from the training data set correlations between EBV and DGV are high,varying from 0.98 for milk yield to 0.83 for rear leg rear view - the trait with the lowestheritability (0.04). <strong>The</strong> average reliability <strong>of</strong> DGV also varied across the analyzed traits,ranging from 0.573 for foot angle to 0.940 for milk yield. <strong>The</strong> average reliability <strong>of</strong> DGV foryoung selection candidates <strong>is</strong> however lower: 0.228 for milk- and 0.216 for fat- and proteinyields.Conclusions. Thousands <strong>of</strong> SNP genotypes densely d<strong>is</strong>tributed along the genome for manyindividuals with well defined phenotypes and familial relationships provide very valuablepiece <strong>of</strong> information. From the point <strong>of</strong> view <strong>of</strong> animal breeders, the genomic selection <strong>is</strong> apowerful, internationally recognized selection tool. Moreover, from a genetic<strong>is</strong>t perspectiveestimation <strong>of</strong> SNP effects densely d<strong>is</strong>tributed along the genome provides a unique opportunityfor detection <strong>of</strong> causal mutations and interplay between them.42
14 th QTL-MAS Workshop, Poznań University <strong>of</strong> Life Sciences, Poland 2010Validation experiences in Italian Holstein genomic selectionJ.B.C.H.M. van Kaam 1∗ , R. Finocchiaro 1 , F. Canavesi 1 , G.B. Jansen 21 ANAFI - Italian Holstein Association, Via Bergamo 292, 26100 Cremona, Italy2 Dekoppel Consulting, Casale Rovera 10, 10010, Chiaverano, Italy∗ Presenting author: Jan-Thijs van Kaam, email: jtkaam@anafi.itBackground. In Italy, several projects (SelMol, ProZoo and Elica) have been set up, whichcontribute to the creation <strong>of</strong> a reference data set. SNP marker data were recoded, merged orrejected when needed and then checked to determine which SNPs and which bulls to retain.Data editing resulted in a reduction from 2694 samples on 2613 Italian Holstein bulls to 2568bulls and from 54,001 SNPs to 39,259 SNPs. Deregressed pro<strong>of</strong>s were obtained by fullpedigree deregression. Individual SNP effects were estimated with genomic BLUP usingresidual updating. Direct genomic values resulted from summing SNP allelic effects. Variousvalidation runs with 12 traits have been undertaken.Results. For random effects in a mixed model a variance ratio, between residual andexplanatory effect, <strong>is</strong> needed. Rough estimates <strong>of</strong> Ve and Vg were obtained by partitioningthe variance <strong>of</strong> deregressed pro<strong>of</strong>s in residual and genetic components, using heritabilities andaverage effective daughter contributions derived from average reliabilities. For the markereffects, a variance ratio <strong>of</strong> Ve/Vm with Vm=Vg/sum2pq, i.e. marker effects are proportionalto the informativity <strong>of</strong> the marker, was used. Results <strong>of</strong> regressing direct genomic values onderegressed pro<strong>of</strong>s show that the regression coefficient was clearly below 1 for all traits.Using larger variance ratios, i.e. regressing marker estimates to lower values, resulted inlarger regression coefficients with slightly lower R 2 . A variance ratio multiplied by 5 gaveregression coefficients near 1.Conclusions. Results indicated that R 2 depends mainly on the number <strong>of</strong> phenotypes, whichwas expected due to the excess <strong>of</strong> explanatory variables compared to response variables.More lax or stringent selection <strong>of</strong> SNPs only affected the 3 rd decimal <strong>of</strong> the R 2 . <strong>The</strong> varianceratio needed to be higher than expected to obtain regression coefficients near 1.43
14 th QTL-MAS Workshop, Poznań University <strong>of</strong> Life Sciences, Poland 2010Tutorial on R/qtlKarl W. Broman 1∗1Department <strong>of</strong> Biostat<strong>is</strong>tics and Medical Informatics, University <strong>of</strong> W<strong>is</strong>consin – Mad<strong>is</strong>on∗ Presenting author: Karl Broman, email: kbroman@biostat.w<strong>is</strong>c.eduR/qtl <strong>is</strong> an extensible, interactive environment for mapping quantitative trait loci (QTL) inexperimental crosses. It <strong>is</strong> implemented as an add-on package for the freely <strong>available</strong> andwidely used stat<strong>is</strong>tical language/s<strong>of</strong>tware R (www.r-project.org). <strong>The</strong> development <strong>of</strong> th<strong>is</strong>s<strong>of</strong>tware as an add-on to R allowed us to take advantage <strong>of</strong> the basic mathematical andstat<strong>is</strong>tical functions, and powerful graphics capabilities, that are provided with R. Further, theuser benefits by the seamless integration <strong>of</strong> the QTL mapping s<strong>of</strong>tware into a generalstat<strong>is</strong>tical analys<strong>is</strong> program. Our goal was to make complex QTL mapping methods widelyaccessible and allow users to focus on modeling rather than computing.In th<strong>is</strong> tutorial, we will briefly demonstrate a portion <strong>of</strong> the features <strong>of</strong> R/qtl (for those thatw<strong>is</strong>h to follow along, see http://www.rqtl.org/qtlmas2010).44
14 th QTL-MAS Workshop, Poznań University <strong>of</strong> Life Sciences, Poland 2010POLAPGEN-BD: a project on biotechnology for breeding cereals withincreased res<strong>is</strong>tance to drought #Paweł Krajewski 1∗ , Anetta Kuczyńska 1 and POLAPGEN Consortium 21 Institute <strong>of</strong> Plant Genetics, Pol<strong>is</strong>h Academy <strong>of</strong> Sciences, Strzeszyńska 34, 60-479 Poznań2 POLAPGEN Consortium for Applied Genetics and Genomics, Strzeszyńska 34, 60-479 Poznań,www.polapgen.pl∗ Presenting author: Paweł Krajewski, email: pkra@igr.poznan.pl<strong>The</strong> subject <strong>of</strong> the project <strong>is</strong> drought res<strong>is</strong>tance in cereals, investigated in spring barley treatedas both a model and economically important plant. Increasing desiccation <strong>of</strong> the environment,reflecting the water deficit in the soil, requires tools that would enable the breeders to carryout selection <strong>of</strong> genotypes res<strong>is</strong>tant to drought. <strong>The</strong> project cons<strong>is</strong>ts <strong>of</strong> 23 research taskscarried out under POLAPGEN Consortium whose partners are 10 research units and 2breeding companies. Tasks were formulated in such a way that a wide range <strong>of</strong> character<strong>is</strong>ticsdetermining plants’ res<strong>is</strong>tance to drought will be studied. All tasks will be realized on thesame plant material, which enables integration <strong>of</strong> many research teams around the sameproblem solved in a modern way. Comprehensive approach to the problem <strong>of</strong> cerealres<strong>is</strong>tance to shortage <strong>of</strong> water will enable to evaluate interdependence <strong>of</strong> various parametersdetermining that character<strong>is</strong>tic. System approach will be achieved by adopting a model <strong>of</strong>tolerance <strong>of</strong> plants to drought stress containing ecophysiological, morphological, anatomical,metabolic, proteomic, and molecular levels considered in the context <strong>of</strong> genetics. Selectedparameters <strong>of</strong> the model and interdependence between them will be evaluated. <strong>The</strong> projectwill allow to set new markers for res<strong>is</strong>tance to drought, both molecular and morphological, aswell as new methods <strong>of</strong> evaluation <strong>of</strong> res<strong>is</strong>tance based on physiological and physicalindicators. Data obtained will also allow the creation <strong>of</strong> the ideotype <strong>of</strong> res<strong>is</strong>tant varieties,characterized by the complex <strong>of</strong> character<strong>is</strong>tics and properties at the whole plant level and atthe cellular and molecular level.#Project carried out under Innovative Economy Programme 2007-2013, Action 1.3, Subaction 1.3.1. within thesubject „Biological progress in agriculture and environment protection”.45
14 th QTL-MAS Workshop, Poznań University <strong>of</strong> Life Sciences, Poland 2010Genomic estimated breeding values and QTL positions: Common dataset <strong>of</strong>QTL-MAS 2010 WorkshopX. Sun 1* , J. C. M. Dekkers 11 Department <strong>of</strong> Animal Science and Center for Integrated Animal Genomics, Iowa State University, Ames, Iowa50011*Presenting author: Xiaochen Sun, email: xsun1120@iastate.eduWe used a linear model with sex as fixed effects and random SNP effects to fit the datasetprovided by QTL-MAS 2010 Workshop and applied Bayesian analys<strong>is</strong> to obtain genomicestimated breeding values (GEBVs) and QTL positions.GEBV <strong>of</strong> each individual in Generation 5 was the sum <strong>of</strong> genetic effects <strong>of</strong> all SNPs itcarried, where effects <strong>of</strong> SNPs were estimated from phenotypic and genotypic records in thefirst four generations. <strong>The</strong> accuracy <strong>of</strong> our Bayesian method was evaluated by the correlation<strong>of</strong> phenotypes <strong>of</strong> individuals in the fourth generation with their GEBVs and divided by thesquare root <strong>of</strong> estimated heritability from REML, which <strong>is</strong> equivalent to the correlation <strong>of</strong>GEBVs with true breeding values. <strong>The</strong> accuracy estimated th<strong>is</strong> way could be as high as 0.8.However, since the individuals in the fifth generation did not have phenotypic records, theaccuracy <strong>of</strong> their GEBVs was not <strong>available</strong>.<strong>The</strong> bins spanning every 10 adjacent SNPs that explained genetic variances higher than apredefined threshold were selected as candidate genome regions containing QTLs. Withineach bin, the SNP explaining the highest genetic variance was used as the position <strong>of</strong> QTL.To set a threshold for genetic variances <strong>of</strong> bins, we simulated genotypes without QTL forindividuals in the first four generations using the same pedigree and SNP panel as thecommon dataset. Simulated SNP effects and genetic variances <strong>of</strong> bins were estimated fromsimulated genotypes and original phenotypes using the same Bayesian method. <strong>The</strong> threshold<strong>of</strong> certain significance level was determined from the d<strong>is</strong>tribution <strong>of</strong> genetic variancesexplained by the bins across the whole genome. Since the threshold was arbitrary, we reporteda primary QTL l<strong>is</strong>t together with a secondary l<strong>is</strong>t, where the threshold <strong>of</strong> the former wasstringent and the latter more liberal.46
SPONSORS