Finding probabilities involving Z scores
Finding probabilities involving Z scores
Finding probabilities involving Z scores

You also want an ePaper? Increase the reach of your titles
YUMPU automatically turns print PDFs into web optimized ePapers that Google loves.
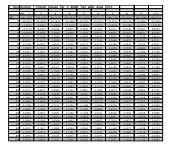
Example 1B<strong>Finding</strong> the area to the Right of a negative Z scoreFind P( z > – 1.86 )The area under the z curve that is to the right of a given z value represents the probability ofselecting one number from the z distribution and having that number be more than the z value.If we want to find the probability of selecting one number from the z distribution and having thatnumber be more than the z value of – 1.86 we need to find the area to the RIGHT of z = – 1.86The number at the intersection of the –1.8 row and the 0.06Negative Z Scorescolumn is 0.0314Standard Normal (Z) Distribution: Cumulative Area to the LEFT of ZZ 0.00 0.01 0.02 0.03 0.04 0.05 0.06 0.07 0.08 0.09–1.8 0.0359 0.0351 0.0344 0.0336 0.0329 0.0322 0.0314 0.0307 0.0301 0.0294This means that the area to the LEFT of z = – 1.86 is 0.0314The vertical line drawn at the value of z divides the area under the z curve into two areas. The yellowarea is to the left of the z value and the white area is to the right of the z value.the area to the left of z = – 1.86is .0314The total of the yellow and white areas is 1the area to the right of z = – 1.86is 1– .0314 = .9686left tail area= .0314right tail area= .9686z = – 1.86 0soIf the area to the Left of Z = – 1.86 is .0314then the area to the Right of Z = – 1.86 is 1 – .0314 = .9686P( z > – 1.86 ) = 1 –0.0314 = .9686Section 6 – 3B Lecture Page 4 of 16 © 2012 Eitel